Nurses worth listening to
Professor Desley Hegney
Dr Ashley Plank
Dr Elizabeth Buikstra
Ms Victoria Parker
Dr Rob Eley
Acknowledgements
We wish to thank the QNU for providing the funds for both the 2001 and 2004
studies. Their foresight has ensured the first workforce study in Queensland
with comparative data. We also wish to acknowledge the work of Annette
Nanka, Sarah Crundwell and Erin Bowly for their assistance with graphics and
desktop publishing. Lastly, but most importantly we wish to thank the QNU
© 2005 Hegney, Plank, Buikstra, Parker, Eley
All rights reserved. No part of this publication may be reproduced, stored in a retrieval system or transmitted in any form or by any means, electronic,
TABLE OF CONTENTS
EXECUTIVE SUMMARY………...vii
1.0 INTRODUCTION AND LITERATURE REVIEW ... 1
1.1 Background to the study ...1
1.2 Literature review...1
1.3 Summary...28
2.0 METHOD... 29
2.1 Project Aims ...29
2.2 Research Questions...29
2.3 Principal Outcomes ...29
2.4 Method ...29
2.5 Data Analysis ...32
3.0 RESULTS... 34
3.1 Your Current Employment...34
3.2 Your Working Hours ...37
3.3 Your Working Conditions ...47
3.4 Responsibilities Outside Work ...98
3.5 Your Professional Development...107
3.6 Your Experience in Nursing ...118
3.7 Demographic Data on Respondents ...140
3.8 Five Most Important Activities for the QNU in the coming Year ...150
3.9 Further Comments ...167
4.0 DISCUSSION ... 184
4.1 Personal demographics of the respondents in the study ...184
4.2 Work profile of the respondents ...186
4.3 Working hours ...191
4.4 Professional development ...196
4.5 Workload ...200
4.6 Rostering systems (Q23 and Q24 and Q25) ...205
4.7 Violence in the workplace (Q32) ...206
4.8 Nursing work (Q57) ...211
4.9 Occupational health and safety (Q57)...215
4.10 Safety of workplace ...215
4.11 Working conditions and remuneration (Q57)...216
4.12 Sector analysis...218
5.0 CONCLUSION ... 224
6.0 REFERENCES ... 225
7.0 APPENDICES ... 232
7.1 Covering Letter...232
7.2 Plain Language Statement ...233
List of Tables
Table 3.1 Type of workplace participants ...36
Table 3.2 Hours worked in nursing agencies in last four weeks...37
Table 3.3 Number of hours worked: Aged care ...43
Table 3.4 Number of hours worked: Public...43
Table 3.5 Number of hours worked: Private ...43
Table 3.6 Reasons for inadequate skill mix: 2004 ...49
Table 3.7 Reasons for inadequate skill mix: 2001 ...50
Table 3.8 Minimum standard rostered shift length (hours): Aged care...63
Table 3.9 Maximum standard rostered shift length (hours): Aged care...63
Table 3.10 Minimum standard rostered shift length (hours): Public ...63
Table 3.11 Maximum standard rostered shift length (hours): Public ...63
Table 3.12 Minimum standard rostered shift length (hours): Private ...63
Table 3.13 Maximum standard rostered shift length (hours): Private ...63
Table 3.14 Factors influencing working hours: 2004 ...64
Table 3.15 Factors influencing working hours: 2001 ...64
Table 3.16 Themes and sub-themes arising from analysis of the qualitative data relating to workload...72
Table 3.17 Sources of workplace violence: 2004 ...83
Table 3.18 Sources of workplace violence: 2001 ...84
Table 3.19 Family responsibilities: 2004...99
Table 3.20 Family responsibilities: 2001...99
Table 3.21 Factors influencing perceptions of the adequacy of childcare: 2004 ...106
Table 3.22 Factors influencing perceptions of the adequacy of childcare: 2001 ...107
Table 3.23 Type of support provided by employer for study: 2004...108
Table 3.24 Type of support provided by employer for study: 2001...109
Table 3.25 Work-related education and training activities in the previous 12 months: 2004 ...109
Table 3.26 Work-related education and training activities in the previous 12 months: 2001 ...109
Table 3.27 Training hours paid by employer: Aged care ...111
Table 3.29 Training hours paid by employer: Private ...111
Table 3.30 Type of education and training support provided: 2004...112
Table 3.31 Type of education and training support provided: 2001...112
Table 3.32 Barriers to undertaking education and training activities for nurses employed for greater than 12 months: 2004...113
Table 3.33 Barriers to undertaking education and training activities: 2001 ...113
Table 3.34 Relationship (correlation coefficient) between age and future time in nursing .134 Table 3.35 Relationship (correlation coefficient) between age and future time in nursing according to nursing level ...134
Table 3.36 Relationship (correlation coefficient) between age and future time in nursing according to employment status ...135
Table 3.37 Reasons for breaks in nursing: 2004 ...138
Table 3.38 Reasons for breaks in nursing: 2001 ...139
Table 3.39 Job designation across all sectors for 2004 (in percent) ...141
Table 3.40 Job designation across all sectors for 2001 (in percent) ...141
Table 3.41 Goodness-of-fit between results of the 2004 study and the QNU database (in percent)...142
Table 3.42 Nursing Qualifications gained outside a University or TAFE ...143
Table 3.43 Qualifications completed at university or TAFE ...144
Table 3.44 Endorsements: 2004...144
Table 3.46 Gender across all sectors for 2004 survey ...145
Table 3.47 Gender across all sectors for 2001 survey ...145
Table 3.48 Gender according to QNU database 2004 ...145
Table 3.49 Estimated mean age by year and sector ...147
Table 3.50 Aboriginal, Torres Strait or South Sea Island origin: 2004...147
Table 3.51 Major themes from data analysis of question 76 ...150
List of Figures
Figure 3.1 Nurses with one or more paid jobs ...34
Figure 3.2 The main reason for more than one paid job...35
Figure 3.3 Length of time employed in current position...35
Figure 3.4 Percentages of nurses who have worked for a nursing agency in the last 12 months ...36
Figure 3.5 Comparison across sectors of hours worked by permanent full-time employees in previous four weeks ...38
Figure 3.6 Comparison across sectors of hours worked by permanent part-time employees in previous four weeks ...39
Figure 3.7 Comparison across sectors of hours worked by casual employees in previous four weeks...40
Figure 3.8 Typical hours worked in the last four weeks...41
Figure 3.9 Type of employment ...42
Figure 3.10 Respondents who indicated whether they worked a minimum number of shifts. ...42
Figure 3.11 Preference to work more contracted shifts ...43
Figure 3.12 Preference for permanent employment ...44
Figure 3.13 Type of shift worker ...45
Figure 3.14 Permanent full-time workers and type of shift worked...45
Figure 3.15 Work patterns of respondents ...46
Figure 3.16 Full-time employees and work patterns...46
Figure 3.17 Ability to complete work in the paid time available ...47
Figure 3.18 Sufficient staff to meet patient/client needs? ...48
Figure 3.19 Skill mix adequate? ...49
Figure 3.20 Inexperienced staff as reason for inadequate skill mix...50
Figure 3.21 Too few experienced staff as reason for inadequate skill mix ...51
Figure 3.22 Unlicenced care providers as reason for inadequate skill mix...51
Figure 3.23 Too many agency staff as reason for inadequate skill mix ...52
Figure 3.24 Too many casual staff as reason for inadequate skill mix ...52
Figure 3.25 Too few relief/agency staff as reason for inadequate skill mix ...53
Figure 3.26 Lack of funding and inadequacy of skill mix ...53
Figure 3.27 Employer policy and inadequacy of skill mix ...54
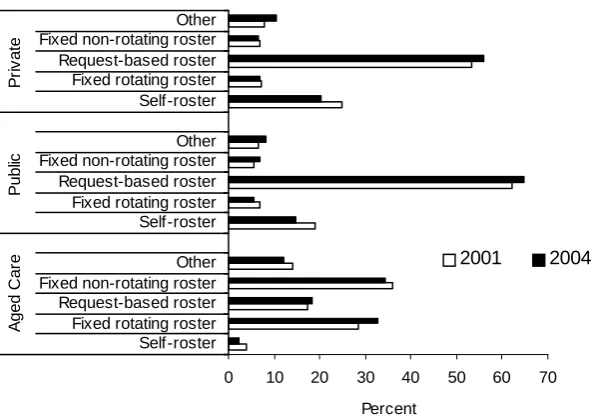
Figure 3.28 Type of roster in work unit or ward ...55
Figure 3.29 Satisfaction with rostering practices ...55
Figure 3.30 Satisfaction with rostering practices and estimated mean age of nurse...56
Figure 3.31 Significant family responsibility and satisfaction with rostering practices (2004) ...56
Figure 3.32 Significant family responsibility and satisfaction with rostering practices (2001) ...57
Figure 3.33 Dependent child and satisfaction with rostering practices (2004) ...57
Figure 3.34 Dependent child and satisfaction with rostering practices (2001) ...57
Figure 3.35 Satisfaction with rostering practices and job designation (2004)...58
Figure 3.36 Satisfaction with rostering practices and job designation (2001)...58
Figure 3.37 Input into roster...59
Figure 3.38 Level of input into roster and estimated age of the nurse...59
Figure 3.39 Significant family responsibility and level of input into roster (2004) ...60
Figure 3.40 Significant family responsibility and level of input into roster (2001) ...60
Figure 3.41 Dependent child and level of input into roster (2004) ...60
Figure 3.42 Dependent child and level of input into roster (2001) ...61
Figure 3.43 Roster input and job designation (2004)...61
Figure 3.45 Working double shifts ...62
Figure 3.46 Not applicable responses to factors affecting hours and type of shifts worked. 65 Figure 3.47 Family responsibilities affecting shifts worked...65
Figure 3.48 Study commitments affecting shifts worked ...66
Figure 3.49 Sporting commitments affecting shifts worked ...67
Figure 3.50 Staff turnover affecting shifts worked (2004) ...67
Figure 3.51 Leave (2001) ...68
Figure 3.52 Your leave/absence affecting shifts worked (2004)...68
Figure 3.53 Other staff leave/absence affecting shifts worked (2004)...68
Figure 3.54 Workplace committee/process dealing with workload related issues...69
Figure 3.55 Workplace committee/process dealing with workload related issues (excluding don’t know responses) ...70
Figure 3.56 Effectiveness of workload committee/process...70
Figure 3.57 Experience of workplace violence in previous three months ...83
Figure 3.58 Clients/patients as a source of workplace violence ...84
Figure 3.59 Visitors/relatives as a source of workplace violence ...85
Figure 3.60 Other nurses as a source of workplace violence...85
Figure 3.61 Nursing management as a source of workplace violence ...86
Figure 3.62 Medical practitioners as a source of workplace violence...86
Figure 3.63 Workplace Violence and Gender...87
Figure 3.64 Workplace violence and designation ...88
Figure 3.65 Workplace violence and work patterns...88
Figure 3.66 Workplace violence and mean age of nurse ...89
Figure 3.67 Respondents have experienced abuse in the workplace in the last 3 months according to their perceived level of workplace safety...89
Figure 3.68 Respondents have experienced abuse in the workplace in the last 3 months according to their perceived level of morale (2004) ...90
Figure 3.69 Respondents have experienced abuse in the workplace in the last 3 months according to their perceived level of morale (2001) ...90
Figure 3.70 Existence of a workplace policy for aggressive behaviour of other staff ...91
Figure 3.71 Adequacy of policy for aggressive behaviour of other staff ...92
Figure 3.72 Workplace policy to deal with aggressive behaviour of patients/clients/visitors 93 Figure 3.73 Perceptions of the adequacy of workplace policy for aggressive behaviour of patients/visitors/clients ...93
Figure 3.74 Replacement of staff on sick leave...94
Figure 3.75 Replacement of staff on long service leave...95
Figure 3.76 Replacement of staff on annual leave ...95
Figure 3.77 Replacement of staff on accrued days off ...96
Figure 3.78 Staff replacement when on training/study leave...97
Figure 3.79 Replacement of staff on TOIL...97
Figure 3.80 Ability to take annual leave when required ...98
Figure 3.81 Dependent spouse by employment status across sectors ...100
Figure 3.82 Dependent Spouse according to gender ...100
Figure 3.83 Dependent disabled or ill family members by employment status...101
Figure 3.84 Dependent elderly relative by age ...101
Figure 3.85 Adequacy of care arrangements for dependent family members ...102
Figure 3.86 Adequacy of care arrangements for dependent family members and nurse employment status...102
Figure 3.87 Adequacy of care arrangements of dependent members according to estimated age ...103
Figure 3.88 Adequacy of care arrangements and nurses working full time versus part time ...103
Figure 3.89 Inadequate support or assistance and its effect on hours able to work...104
Figure 3.90 Access to family leave ...104
Figure 3.92 Employer provision of childcare...105
Figure 3.93 Employer assistance or support for childcare adequate?...106
Figure 3.94 Access to training and/or professional development opportunities through the workplace...108
Figure 3.95 Employer support for time off for work-related education activities undertaken in the last 12 months...111
Figure 3.96 Perceptions for support for new nursing graduates...114
Figure 3.97 Perceptions or support for new nursing graduates by estimated age ...114
Figure 3.98 Graduates given enough support by designation (2004)...115
Figure 3.99 Graduates given enough support by designation (2001)...115
Figure 3.100 Orientation for all new staff into clinical areas ...116
Figure 3.101 Orientation for all new staff into clinical areas by estimated age of the nurse ...116
Figure 3.102 Orientation for all new staff into clinical areas by time in current position ...117
Figure 3.103 Orientation for all new staff into clinical areas by job designation (2004) ...117
Figure 3.104 Orientation for all new staff into clinical areas by job designation (2001) ...118
Figure 3.105 Perceptions of the emotionally challenging nature of nursing work...119
Figure 3.106 Perceptions of workload being ‘heavy’ or ‘light’...120
Figure 3.107 Perceptions of the physically demanding nature of nursing work...120
Figure 3.108 Perceptions of the adequacy of pay rates ...121
Figure 3.109 Perceptions of the convenience of working hours ...122
Figure 3.110 Perceptions of career prospects in nursing ...122
Figure 3.111 Reward for skills and experience...123
Figure 3.112 Perceptions of the high or low status of nursing as a career...124
Figure 3.113 Perceptions of work stress ...124
Figure 3.114 Teamwork and support from colleagues ...125
Figure 3.115 Perceptions of the safety of the workplace...126
Figure 3.116 Perceptions of autonomy within the workplace ...126
Figure 3.117 Morale within the workplace ...127
Figure 3.118 Changes in staff morale within the workplace ...127
Figure 3.119 Staff morale by job designation (2004)...128
Figure 3.120 Staff morale by job designation (2001)...129
Figure 3.121 Staff morale by gender (2004)...129
Figure 3.122 Staff morale by gender (2001)...130
Figure 3.123 How adequately was the workplace equipped? ...130
Figure 3.124 Perceptions of how the community values nursing work...131
Figure 3.125 Value of nursing work within the health system...132
Figure 3.126 Length of time in nursing ...133
Figure 3.127 Time expected to work in nursing in the future...134
Figure 3.128 Breaks from nursing ...135
Figure 3.129 Number of breaks from nursing (2004)...136
Figure 3.130 Number of breaks from nursing (2001)...136
Figure 3.131 Length of longest break in nursing ...137
Figure 3.132 Retraining following longest break from nursing...138
Figure 3.133 Designation of nurses employed in the private aged care and acute sectors140 Figure 3.134 Job designation of nurses in public sector (aged care and acute) ...141
Figure 3.135 Gender...145
Figure 3.136 Age distribution...146
Figure 3.137 Distribution of estimated mean ages by year and sector...147
Figure 3.138 Comparison between Aboriginal and Torres Strait Islander respondents: 2001 and 2004 ...148
Figure 3.139 Non-English speaking background...148
Figure 3.140 Identification as a person with a disability ...149
EXECUTIVE SUMMARY
In 2001 the University of Southern Queensland (USQ) in conjunction with the Queensland Nurses’ Union (QNU) undertook a study of enrolled and registered nurse and assistant-in-nursing members. In Queensland, registered nurses (RNs) and enrolled nurses (ENs) are qualified to practice nursing and are licensed by the Queensland Nursing Council (QNC), an independent body responsible for the setting and maintaining of nursing standards in the State. Although not licensed by the QNC Assistants in Nursing (AINs) work within a nursing model of care. These workers may also have other titles such as Personal Care Assistants or Carers. Regardless of their title, they work under the direct or indirect supervision of a RN.
The study was confined to nurses employed in the public sector (acute hospitals, community health), the private sector (acute hospitals and domicillary nursing) and the aged care sector (government and non-government). In 2004 a similar study was conducted.
The major findings of the 2004 study were that nurses believed:
• nursing is emotionally challenging and physically demanding
• their workload is heavy and that their skills and experience as a professional nurse are poorly rewarded (remunerated or recognised)
• work stress is high and morale is perceived to be poor and, similar to 2001, deteriorating
• there are insufficient staff in their workplace and that the skill mix is inadequate
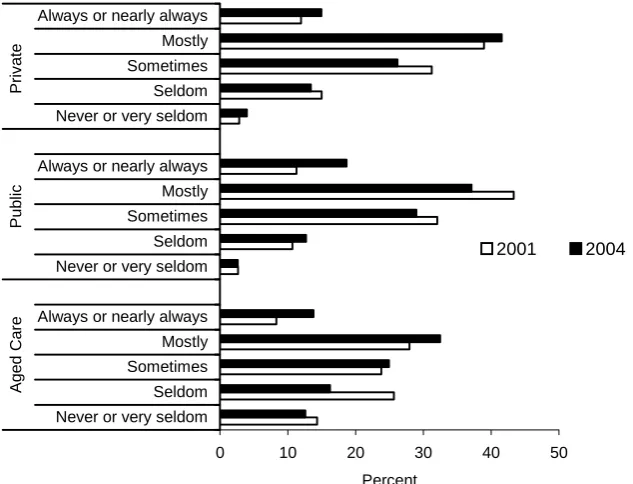
• the majority of nurses are unable to complete their work to their level of professional satisfaction in the time available.
While there were some changes between 2001 and 2004 (some could be seen as improvements, others deteriorations), the overwhelming impression one has, especially from the qualitative data, is of a workforce frustrated and unable to provide safe and quality care to their patients/clients within the time allocated.
Some aspects of this study (for example, the increase in reports of workplace violence) require further investigation. For example, it is unclear as to whether workplace violence has increased or whether, due to an increased awareness of what constitutes workplace violence, nurses now recognise workplace violent behaviour.
The aim of both studies was to identify the factors impacting upon nursing work and to use the results to inform strategic planning of the QNU. The research questions of the 2004 study were:
• from the perspective of members of the Queensland Nurses’ Union, what were the factors impacting upon nursing work in Queensland?
• how satisfied were members of the Queensland Nurses’ Union with nursing work in Queensland?
This report outlines the findings of the 2004 study. Comparisons are provided between the 2001 and 2004 studies if the same question was asked. The results are reported for each of the three sectors.
Of the 3000 participants (1000 from each sector) invited to participate in the 2004 survey, 1349 responded, representing an overall response rate of 45%. Response rates varied between the sectors (aged care 52%, public sector 45% and private sector 48%). In 2001, a total of 1484 nurses responded to the 2800 mailed surveys (51% return rate). Similarly there were some differences in the return rates across the sectors (47% aged care, 53% public and private sectors).
Data were gathered using a mail-out questionnaire containing 77 questions divided into eight sections – Your Current Nursing Employment, Your Working Hours, Your Working Conditions, Your Responsibilities Outside Work, Your Professional Development, Your Experience in Nursing, About You, and You and the QNU. The questionnaire and survey procedure were pilot tested before adoption. One reminder was sent to non-respondents four weeks after the initial mail out. In 2004, all quantitative data were scanned into the software program Verity TeleForm Version 9. Qualitative data were typed verbatim into a word processing document.
Quantitative data were analysed within and across the three sectors using descriptive and inferential statistical tools as appropriate to the scale of measurement involved. Also, where appropriate, 2001 and 2004 results were compared within each sector. In order to contain the false positive error rate, only inferences supported at the one percent level of significance are reported except where more than one sector exhibits a similar trend or where there is prior expectation of an effect. In these cases a five percent level of significance has been invoked. It should be noted that because the number of nurses in each of the sectors in the QNU database are not proportional to the number of respondents in each sector, measure averaged over the three sectors must be weighted to be valid. The appropriate weights for the 2004 data are 17.8%, 65.8% and 16.4% respectively for the aged care, public and private sectors.
There were three questions that collected qualitative data. The verbatim data were analysed question by question for each of the sectors. A content analysis of the data was then carried out to identify emergent themes and sub-themes within each sector for each of the three questions.
The study was approved by the University of Southern Queensland’s Human Research and Ethics Committee.
As each sector analysis was different, an overview of the major findings for each sector are discussed below.
Aged Care Sector
to their satisfaction within the paid time available, however this has improved since 2001. They also believe that ‘very seldom’ are there sufficient staff employed to meet patient/resident needs. Similarly, these perceptions have improved since 2001. Additionally, nurses in this sector were more likely to believe that too many unregulated care providers (has improved since 2001), lack of funding, employer policy on skill mix and too few experienced staff impact upon skill mix in their facility. They were the most likely of nurses in the three sectors to be replaced when on leave. They were more likely to report the workplace is safe and well-equipped. Nurses in this sector were more likely to indicate that a workload committee/process was in place than they were in 2001. However, nurses in this sector were more likely to believe that the committee or process was effective than nurses in other sectors.
Similar to the other sectors, nurses in this sector have reported an increase in workplace violence since 2001. In the aged care sector, the most common sources of this violence are clients/patients, medical practitioners, nursing management, other nurses, and visitors/relatives. The last three of these sources have all increased since 2001. They believe that workplace violence impacts upon workplace safety. The older the nurse in this sector, the more likely they are to report experiencing workplace violence. AINs and ENs were more likely to report workplace violence than RNs. Nurses who report low morale are more likely to have reported workplace violence, with those nurses reporting ‘extremely’ poor morale more likely to have been subjected to workplace violence than other nurses. Male nurses were more likely to report experiencing workplace violence than female nurses.
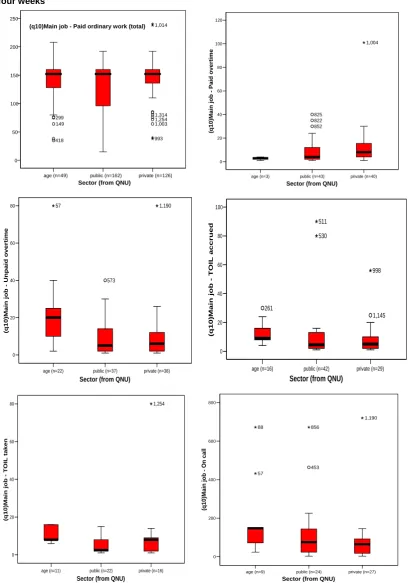
Permanent full-time nurses in this sector were more likely to work unpaid overtime or Time Off in Lieu (TOIL). However, they were also more likely than nurses in the other sectors to be able to take accrued TOIL. They are more likely to work on fixed non-rotating rosters and least likely to work on a request-based rostering system. They were least likely to be satisfied with rostering practices. Older nurses in this sector were more likely to be satisfied with the rostering system. Reflecting the fact that RNs have more input into the roster in their work unit, RNs, rather than ENs or AINs were the most satisfied with rostering practices.
The fact that the nurses in this sector are older (and the average age of nurses in this sector has increased since 2001) and they were less likely to have dependent children (decreased since 2001). In those nurses who indicated they had dependent children, these children were likely to be older than dependent children in the other sectors. In all sectors, childcare was seen to be inadequate, however, in the aged care sector nurses were more likely in 2004 than they were in 2001, to see the reason for this inadequacy as the inflexibility of childcare services. Nurses in this sector have reported a slight improvement in their perception of the adequacy of childcare since 2001.
Nurses in this sector were more likely to have had a longer break from nursing and, as a consequence, were more likely to have undertaken a re-entry program. Compared to nurses in the other sectors, they are more likely to have taken a break from nursing because of family responsibilities and are less likely to have taken this break as paternity/maternity leave. They are also more likely to have taken a break from nursing: due to ill-health, because they have lacked motivation or encouragement to continue their nursing career; or to go to a better paid position. While similar to the percentages of nurses in other sectors, the numbers leaving left to pursue further education, have increased since 2001.
These nurses have the most (over 35 years) or least (less than 10 years) experience in nursing. Reflecting the older workforce in this sector, these nurses are more likely to indicate they will leave nursing earlier than nurses in the other sectors.
With regard to education and training, the nurses in this sector are more likely to participate in workplace training by watching a training video but less likely to receive funding from their employer to attend a conference or seminar. While they often attend a talk or lecture within the facility, the number doing so has decreased since 2001. They are the least likely to have education and training activities funded by their employer. In contrast to the other sectors, nurses in this sector identified that the most common support given for education and training was in the form of meals. Possibly reflecting their older dependent children, they are less likely to identify family commitments as a barrier to education and training.
Aged care sector nurses are more likely to believe there is adequate support for new graduates and orientation for new staff. In particular, older nurses in this sector are more likely to believe this than younger nurses. They are also most likely to believe that nursing is a high status career and one that is valued by both the health system and the community. However, like nurses in the other sectors, half of the aged care sector nurses perceived morale to be low and over half considered morale to be deteriorating. Reflecting their low morale, they have the highest levels of reported workplace stress, believe their colleagues are unsupportive and are most dissatisfied with remuneration.
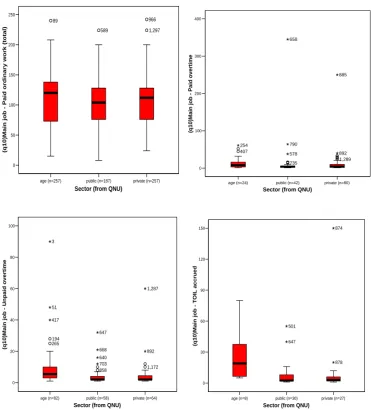
The nurses in the aged care sector, while working the shortest minimum and maximum shifts (these lengths have reduced since 2001), are more likely to be employed on a permanent part-time basis than a permanent full-time basis. They are the least likely of all nurses to work double shifts, though working double shifts has increased since 2001. Permanent part-time nurses in this sector work more paid overtime, and are most likely to indicate they wish to be permanently contracted to work more shifts. They are least likely to work continuous shifts or Monday to Friday shifts only. They are more likely to be employed on evening only shifts.
Public Sector
experienced staff has increased since 2001. Despite these views on what affects skill mix the public sector nurses in 2004 reported skill mix as adequate and more respondents were likely to say, in 2004, there were sufficient staff to meet patient needs. Nurses in this sector are more likely to state that nurses are replaced when taking leave since 2001, however, this sector was the least flexible with regard to annual leave been taken at a time suitable to the nurse. In this sector, however, it is more likely that a workplace committee/process for workload is in place. Although there has been an increase in workplace committees/process since 2001 nurses in this sector were the most likely to believe that the committee was ‘never, very seldom or seldom’ effective.
Similar to other sectors, there has been an increase in reports of workplace violence since 2001. Clients/patients are the most common source of workplace violence in this sector (this has increased since 2001). Other sources of workplace violence in this sector are: visitors/relatives (highest of the three sectors and an increase since 2001); nursing management (increase since 2001); medical practitioners (no change since 2001); and other nurses (increased since 2001). Nurses in this sector associate the level of safety in the workplace with workplace violence. Male nurses are more likely than female nurses to report experiencing workplace violence. Those nurses who reported low morale were more likely to experience workplace violence. Nurses in this sector are most likely not to know if there is a workplace violence policy in place to manage workplace violence from other staff. In this sector, there has been an increase in the percentage of nurses who are aware of a workplace policy for clients/patients/visitors/relatives since 2001.
Morale in this sector is also not high. More nurses in this sector believe that autonomy is discouraged. They are also more likely to state that their workplace is unsafe. They are least likely to believe that their work is physically demanding.
The mean age of nurses in this sector, in line with other sectors, has increased since 2001. There are more male nurses employed in this sector. Nurses in this sector are also more likely to hold endorsements such as midwifery (though this has decreased substantially since 2001), mental health, immunisation, sexual health and rural and isolated practice than nurses in the other sectors.
Nurses in the public sector are more likely to be continuous shift workers and be employed on a permanent full-time basis than nurses in the other sectors. There are also a higher proportion of nurses employed on a temporary part-time basis in this sector than other sectors. Nurses in this sector work the longest minimum shifts, and are the least likely to take accrued TOIL. There has been an increase in nurses in this sector reporting they work double shifts since 2001. Nurses in this sector are the most dissatisfied with their working hours.
RNs in this sector are more satisfied with, and have more input into rostering practices than ENs. Younger nurses in this sector are more likely to have input into their roster than older nurses.
part-time basis are more likely to report that the support they have available to care for family members is inadequate. They have the youngest dependent children. Similar to the aged care and private sectors, nurses with dependent children saw childcare support as inadequate. However, there has been some slight improvement in this perception since 2001. In this sector nurses were more likely in 2004 than in 2001 to identify this inadequacy with the non-availability of vacation care and the childcare centre being in an inconvenient location.
Public sector nurses report more access to education and training (this has increased since 2001) and are more likely to report that employers have fully or partially contributed to their education and training. Nurses in this sector are more likely to be funded for registration fees, accommodation and travel than nurses in the other sectors. Since the 2001 study, there has been an overall decrease in the percentage of nurses watching a training video, a satellite broadcast, attending talks or lectures within the health facility and attending a conference or seminar. However, in 2004, public sector nurses are more likely to attend a workshop, watch a satellite broadcast and enrol in a course/program than nurses in other sectors. Fewer nurses in 2004 than in 2001 are stating that study commitments are impacting upon working hours.
Private sector
With regard to workload and skill mix, the nurses in this sector report too many agency staff, lack of funding, too few relief/agency staff (this has increased since 2001) as impacting upon skill mix. Nurses in this sector are more likely to say that employer policy on skill mix is affecting skill mix in 2004 than they were in 2001. With the exception of leave for education and training which has decreased, nurses in this sector are more likely to be replaced when on leave in 2004. These nurses are less likely to have a workload committee/process in place than nurses in the other sectors. There has been an increase in the percentage of nurses reporting the availability of a workload committee/process, however, nurses in this sector are less likely in 2004 than they were in 2001 to believe that this committee is effective.
Similar to the other sectors, the nurses also report an increase in workplace violence since 2001. The source of the increased reports is from patients/clients, visitors/relatives and nursing management. In contrast to the other sectors, nurses in the private sector are more likely to report workplace violence from medical practitioners (although this has not increased since 2001). Both RNs and ENs in this sector report an increase in workplace violence from 2001. Nurses who are employed on a permanent part-time basis are more likely to report an increase in workplace violence from 2001. Similar to nurses in the other sectors, there is an association between perceptions of the level of safety of the workplace and workplace violence. The lower the morale of these nurses, the more likely they were to report incidences of workplace violence. Nurses in this sector are more likely to not know if there is a workplace violence policy in place for dealing with violence from other staff.
The percentage of nurses employed in this sector who have a disability has increased since 2001.
Nurses in this sector are more likely to work Monday to Friday shifts only. They work the longest maximum shifts, and length of both maximum and minimum shifts has increased since 2001. The nurses in this sector are more likely to cite family responsibilities as affecting the hours they are available for work. Those who are employed on a part-time or casual basis are more likely to report that the support they have available to care for family members is inadequate. Childcare was seen to be inadequate and for nurses in this sector the cost of childcare has become a greater issue than it was in 2001. Similarly, the absence of emergency childcare has also increased as an issue since 2001.
With regard to education and training these nurses are more likely to attend a conference or seminar. They report access to more paid leave than nurses in the other sectors. They are more likely to state they cannot afford the fee for education and training than nurses in the other sectors.
This cohort of nurses has the poorest perception of support for new graduates.
Conclusion
The results of this study suggest that recruitment and retention issues will continue to face nursing in Queensland for some considerable time in the future. The data suggests that patient workloads remain problematic. International studies provide clear evidence that the patient to nurse ratio is not only related to patient outcomes but also to the length of stay (shorter when lower) and job satisfaction.
It is apparent that there are many variables in this study which will have an adverse affect on nurses’ job satisfaction. In particular many of the nurses in this study do not believe that they have the ability to delivery quality individualised care.
The increasing levels of workplace violence would be the most significant change in the data from 2001 and 2004. Workplace violence also affects recruitment and retention within the nursing workforce.
Many factors have been found in other studies to influence a nurse’s decision to leave are also identified in this study. These are:
• family responsibilities – including pregnancy and lack of childcare
• remuneration
• workloads and staffing
• stress/frustration
• travel
• career opportunities
• lack of recognition of nursing work
• lack of authority to make decisions
As has been stated before, recruitment strategies will fail if the workforce issues that make nurses leave are not addressed. This study suggests that urgent attention is needed to areas such as workload and workplace violence.
There are also sector differences in the data that require some attention. In particular, there was a large level of concern raised by the aged care nurses about unregulated care providers being allowed to administer medications.
1.0 INTRODUCTION AND LITERATURE REVIEW
1.1 Background to the study
In 2001 the University of Southern Queensland (USQ) in conjunction with the Queensland Nurses’ Union (QNU) undertook a study of enrolled and registered nurse and assistant-in-nursing members. The study sampling was confined to nurses employed in acute hospitals, community health/domicilliary and aged care. For the purpose of the study, nurses were seen to be employed in three sectors – public (acute and community health), private (acute and domicilliary health) and aged care (public and private providers). The aim of the 2001 study was to identify the factors impacting upon nursing work and to use the results study to inform strategic planning of the QNU.
In 2004 a similar study was conducted with the same aim and with participants selected from the same sectors. The majority of questions asked in 2001 were retained for the 2004 study; however, some questions were modified and some new questions were added. The results are reported separately for the three sectors and, where appropriate, a comparison of the results of the 2004 and 2001 surveys is provided.
The 2001 and the 2004 studies received ethical approval from the Human Research and Ethics Committee of the University of Southern Queensland.
Of the 3000 participants (1000 from each sector) invited to participate in the 2004 survey, 1349 responded; representing an overall response rate of 45%. The estimated response rates and number of respondents from each sector (after adjusting for discrepancies in sector membership between the QNU database and survey responses, and after allowing for respondents who were no longer working in Queensland) were:
• 52% (n=428) aged care sector
• 45% (n=439) public sector
• 48% (n=475) private sector.
1.2 Literature review
1.2.1 Introduction
The Australian Bureau of Statistics (ABS) estimates that the Australian population will increase from 20 million in 2004 to between 24 and 28 million in 2050. While the population is increasing, so is the average age. For example, the median age of the Australian population has increased by 5.0 years during the past decade (from 30.5 years at 30 June 1984 to 36.4 years at 30 June 2004). The ABS projects that by 2050 the median age of the Australian population will increase by eight to eleven years.1
beginning of the 20th century could expect to live for 55 and 59 years respectively, with the noted exception of Indigenous Australians, those born in 2005 can expect to live for 76 and 82 years respectively.2
The increasing life expectancy and the decreasing birth rate ensure a larger number of older Australians. For example, for the year ending June 2004, the number of people aged 65 years and over in Australia increased by 58,500 (2.3%) and reached just over 2.6 million. This age group now comprises 13% of the total Australian population, an increase of 10.1% from 20 years ago. The older population is expected to continue to grow to around 6.5 million, or around one-quarter of the total population by 2050.1
These increases will result in a greater demand for the employment of health care professionals. It is unclear how the demand for health care professionals will be met, particularly in light of the current shortage.
1.2.2 The impact of registered nurse shortages on patient care
Shortages of health professionals, particularly nurses, can result in poor patient outcomes. Recent research has linked the staffing levels of registered nurses with the number of urinary tract infections, pneumonia, upper gastrointestinal bleeding and shock in medical patients, and lower rates of ‘failure to rescue’ and urinary tract infections in major surgery patients.3,4,5
Staff-to-patient ratios are used to demonstrate how understaffing and workload have an adverse affect on patient welfare.6 One recent study exemplifies the effect of staff-to-patient ratios. The authors used cross-sectional analyses of linked data from more than ten thousand registered nurses (RNs), nearly a quarter of a million surgery patients and administrative data from 168 non-federal adult general hospitals in Pennsylvania, United States of America (USA). After adjusting for patient and hospital characteristics, they calculated that for each additional patient per nurse over a 4:1 ratio there was a seven percent increase in the likelihood of death in surgical patients. Furthermore, those patients in hospitals with the highest patient-to-nurse ratio (eight patients per nurse) had a 31% greater risk of dying than those in hospitals with four patients per nurse.7
Other similar studies concur with these data. One such study reported on the New York State Public Employees Federation web site, which involved 2,190 hospitals, found that nurse staffing was a predictor of risk-adjusted mortality rates. The model showed that 10.7% of the variance in mortality is explained by nurse-staffing ratios.8
The Department for Professional Employees, AFL-CIOa, presented a fact sheet of the costs and benefits of improving staff-to-patient ratios. They note that 69% of hospital executives reported that the shortage of nurses had resulted in higher costs
a
to deliver care. Much of this was attributed to length of stay in hospital. For example, a Harvard School of Public Health study reported a 3-6% shorter length of stay for patients in hospitals with a high percentage of RNs. The Institute for Health and Socio-Economic Policy projects annual savings of about $2 billion a year for California hospitals just from the shorter patient stays that result from better RN staffing.9
Data such as this prompted the Australian government to commission The Australian Resource Centre for Hospital Innovations (ARCHI) to undertake a comprehensive review of literature on safe staffing and patient safety. Using a combination of health and non-health related literature, they presented papers that identified a range of quantifiable patient outcomes in relation to inadequate nurse-patient ratios. The reports’ authors recognised: a need to increase understanding of effective strategies that reduce fatigue and fatigue-related errors; the contributing factors that lead to poor communication in the workplace; physical and mental health of staff and their ability to provide safe patient care; and systems that prevent rule-based and skill-based errors in health care delivery.
The non-health literature reviewed by the study offers some insight for the development of these strategies, and has been incorporated into the recommendations for further research.10 Similarly, state governments are conducting their own research into the impact of nurse shortages on patient care. For example, in 2003 the New South Wales (NSW) government engaged a research team from the University of Technology in Sydney to undertake a three-year study into the responsibilities and workload of nurses, and how nursing shortages impact on health outcomes.11
1.2.3 Shortage of nurses
The international shortage of health personnel is reflected in Australian data. Recent Australian information shows that of the 14 non-information and communications technology professions on the Australian Government’s Department of Employment and Workplace Relations national skills shortage list, 12 are health professions. Current nursing shortages on the register are general nursing, midwifery, mental health and enrolled nurses.12
Recently the International Council of Nurses (ICN) commissioned a report to assess the global situation of the nursing workforce. The overall conclusion was that there is a global shortage of nurses. Although variation exists among countries, it is the developing or low income countries that are most severely affected.13
The USA estimates its nursing recruitment need as being in excess of one million registered nurses between 2004 and 201215, and the Canadian situation has been quantified as a shortfall of around 78,000 nurses by 2011.16 In the United Kingdom (UK) in 2002 the Royal College of Nursing (RCN) estimated that the number of vacancies for nurses was around 22,000 full-time equivalents.17 The college calculated that if retirement levelsand other losses remained the same, the National Health System (NHS) would need to recruit110,000 nurses by 2004.18
At first glance the situation in Australia does not seem as bad. The 2002 Nursing Labour Force Survey notes an overall increase of 7,786 employed nurses from 1995 to 2002 with a total nursing population of 275,321.19 However, the rise in absolute numbers was accompanied by an increase in the proportion of nurses working part-time (48.8% in 1995 to 53.8% in 1999), and a decrease in average hours worked per week from 32.4 hours to 30.5 hours. These figures, when combined and adjusted for population increase, yield a net result of a fall in the national supply of nurses from 1,127 full-time equivalent nurses per 100,000 population in 1995 to 1,024 in 2001.19,20 The National Review of Nurse Education and Training projected a shortfall of 40,000 nurses by 2010 and the Australian Council of Deans also predict similar trends.21,22
This shortfall is influenced in no small part by an ageing workforce and resultant retirements. At the national 1986 census, 23.3% of nurses were under 25 years of age. By 1999, however, this proportion had fallen to 4.3%.19 Corresponding yearly figures for those aged 45 and over had increased from 17.5% to 41.7%.19 From 1995 to 2001 the proportion of nurses aged less than 35 dropped over 8% and in those six years from 1995 to 2001 the average age of nurses increased from 39.3 to 42.2.19 The large increase in the 45–54 age group and a decrease in the under 34 age group suggests that the ageing of this workforce will continue for some years.19
In addition to absolute numbers, workforce distribution is a key concern. Lists based on labour market intelligence undertaken by the Department of Employment and Workplace Relations show Queensland, South Australia and Western Australia had shortages against all categories of nurse specialisations in 2004, which was not the case in 2001.22 These shortages are unequally distributed, with greater shortages in Australia’s rural and remote and other disadvantaged areas.22 A similar situation is also found in the rural and remote areas of Canada and the USA and in lower socio-economic areas in cities such as London and Dublin.13
1.2.4 Factors affecting supply
One way of overcoming the shortage of nurses available to work is to increase supply. This can be achieved by recruiting people into the profession, improving retention and encouraging nurses to return to the workforce.
1.2.4.1 Recruitment
Recruitment of nurses in some countries is being addressed successfully through active marketing of opportunities within the profession and improved conditions of service. For example, the UK Government has set a target to recruit more than 50,000 new nurses by 2008 to address the shortfall24 through the use of financial incentives, expanding roles and responsibilities and improved working conditions.17 In Canada a decade of fall in available registered nurses has been reversed by radical changes in policies including recruitment strategies.25
There is an increasing pattern for developed countries to reduce their shortfall with recruitment from elsewhere. In the UK, overseas nurses account for 40 per cent of all new registrations and this is expected to continue to rise.26 Similarly, in the Australian state of Victoria, the five main source countries since the mid 1990s have been the UK, Ireland, New Zealand, the Philippines and Canada. In 2001, overseas registrants accounted for 28% of initial registrants in this state.27 These international recruitment policies have huge implications in the home countries, especially in developing countries where shortages are at a critical level.
A report based on research funded by the World Health Organisation (WHO), ICN and RCN provides a critical overview of the international recruitment situation. The research involved Australia, Ireland, Norway, UK and USA as destination countries and the Caribbean, Ghana, South Africa and the Philippines as source countries. Unlike many countries such as UK and USA which recruit nurses from lower income countries (e.g. Philippines and Indian sub-continent), Australia to date has recruited mainly from developed countries such as the UK and Ireland.27 However, this is likely to change, with the 2001 Senate Inquiry into Nursing making the recommendation that the Australian Government should ‘streamline visa arrangements and simplify the process of recognising overseas qualifications for nurses wishing to migrate to Australia on a permanent or temporary basis’.28
Recruitment alone is insufficient, as once nurses are recruited into the workforce, they must be retained. Bonner noted that ‘… the reality is we don’t have a problem with recruiting. Last year the demand for nursing places [in the higher education sector] exceeded supply by almost 100%... [What we] do have is a problem retaining graduates and experienced nurses long term’.30
nursing profession when the health care workplace conditions are found to be so detrimental to the recruit that they are unable to be retained after graduation’.30
1.2.4.2 Retention and turnover
Studies on retention and turnover suffer from ambiguity in definition. Retention is used to describe remaining within an organisation or a sector (e.g. private or public) or the profession. Retention and turnover are often used synonymously to refer to the departure and replacement of employees from their place of work. All too often the literature does not clearly delineate the differences between turnover and retention, and retention is frequently used as an all encompassing term for any departure regardless of final destination. For the purposes of this review we have made the separation between retention (remaining in the nursing workforce) and turnover (leaving a particular organisation or sector) when able to obtain this information from the literature cited.
Compounding the problem of lack of understanding whether the literature is referring to turnover or retention in the Australian environment, details are only available from the public sector. Thus, details of the 50% of the nursing workforce employed within the private sector are generally unavailable.
a) Turnover
Research on turnover demonstrates that deciding to stay or leave is a complex process not easily captured in a brief exit interview or letter of resignation.31 Measurement of likely turnover is a useful tool. Mitchell et al. adopted the construct
job embeddedness from business management literature to compare retention
health care workers and to predict employee retention in a health care setting.32 In this study, the authors found that the ‘embeddedness’ model was far more effective in predicting turnover than a combination of other more traditionally used measures of job satisfaction, organisation commitment and perceived alternatives.32 Moreover the study also reported that the factors for retention were similar for nurses as for other healthcare workers.32
b) Cost of Turnover
Staff losses are expensive. One report from the USA states that some organisations have a turnover of up to 40%.33 The author calculates the financial implications of loss of one individual registered nurse and replacement by another from the cost of the exit interview to the training of a new staff member as US$33,000 per individual.33
calculated to be over US$21,000 per nurse. The cost for Australia: approximately US$16,000.34
In contrast, other turnover calculations estimate costs to incumbent’s salary. The cost to replace a Level 1 RN employed in the public sector at commencement would range from $20,000 to $92,115, excluding penalty rates, overtime and leave loading.35
O’Brien-Pallas demonstrates that the direct costs of recruitment, temporary replacement and hiring can be exceeded by the indirect costs of termination and separation, orientation and training, and productivity of the new employee.34 The author considers that lost productivity is the major cost driver. She notes that it has been estimated that the cost of nurse turnover is four-to-five times higher than typically accounted for by hospitals, primarily due to lost productivity in the process of ‘on boarding’ a new employee.34
c) Turnover Rates
In the USA, the Advisory Board Company estimated nurse turnover to be more than double the rates for professionals of comparable education and gender. Further, they noted that turnover rates were increasing – from 12% in 1996 to 15% in 1999.34 In contrast, it appears that turnover rates in Ireland are decreasing. For example, in 2002 there was a turnover rate of 10.7%.36 This contrasted with a turnover rate in 1999 of 17%. It is likely that factors such as improved pay and conditions of employment, more support for training and personal development opportunities, and the introduction of more flexible working opportunities, have had a positive influence.37
In England and Scotland nurses who resigned in a 12 month period in 2002 demonstrated a higher turnover rate in both health visitors (16.1%) and district nurses (14.5%) than that for all registered nurses (13.1%).38 The Office of Workforce Economics also compared the data to the previous year for a sub-set of the National Health Trusts (representing about 25% of English Trusts). Data from this report revealed that some Trusts had a turnover rate for both district nurses and health visitors of 26%.38
Struber cites figures for Australia of turnover rates in the public sector of 42% within two years and annual rural exit rates of almost 29% compared to metropolitan rates of 19%.39 Similarly, the Queensland Health Ministerial Taskforce on Nursing Recruitment and Retention (1999) reported that of the 21 Health Service Districts that had turnover higher than the state average of 20.2%, 18 were rural.40 Seven Health Service Districts experienced a nursing turnover rate of 28% or higher.40 The taskforce recommended that research be undertaken to establish the reasons for high turnover in rural districts. They also noted that low recruitment of nurses to rural areas was attributed to inadequate reimbursement of relocation expenses.
(1999) that included establishment of a nursing career advisory service, education programs, transition support, and new rostering practices.40
Caution should be used, however, when examining turnover rate differences. Hegney argues that rates are lower in some rural areas than in remote or urban areas.41 The differences in rates she attributes to employment characteristics of rural nurses, where the partner’s occupation may be the reason for the nurse’s geographical location choice. She noted that the rate was highly variable from area to area, with the highest turnover of nurses in rural non-base hospitals.41
Benchmarking research by Best Practice Australia (BPA) has looked into retention and turnover of nurses in Australia.42 The results reported to date are from the analysis of responses from more than 17,000 nurses employed in a combination of 110 public and private sector health care organisations throughout Australia and New Zealand.42 Their results suggest that 48% of nurses are at risk of leaving nursing and 41% of leaving their organisation. The combined at risk figure is 56%. Figures varied by state/territory (37% of nurses in Victoria were at risk of leaving the profession as compared to 53% in New South Wales, Australian Capital Territory and Queensland), location (10% more metropolitan employees were at risk of leaving the profession than those in the regional areas) and speciality (combined risk for orthopaedic nurses 71%, as compared to 50% in community health).42
Although statistical analyses are not presented, there are some very clear trends from the data set. For example, the percentage of at-risk nurses in both categories falls with age 25 to >50. The highest at risk category is nurses aged 26 to 30. BPA places a conservative estimate of a cost of $20,000 to replace each nurse.42 Thirty one percent of nurses indicated that location of the organisation was the reason for their attraction to work there. This was followed by type of position (22%), development and experience (15%) and reputation (10%). Remuneration was only selected by seven percent.42
Nurses were then asked to select from the reasons that they would consider leaving their organisation. Top reasons nurse gave were workload and staffing (33%), management (23%), shiftwork/hours (21%) and career/growth opportunities (16%).42 ‘The people I work with’ was given by 51% of nurses as the reason for staying in their organisation, followed by convenience (28%) and work enjoyment (24%).42
d) Retention within nursing
At the Australian population census in 1996, 19.8% of persons aged 15-64 years with their highest qualification in nursing were not in the labour force. A study undertaken in New South Wales in 2000 surveyed the state’s nurses who were not working in nursing in New South Wales at the time of their registration renewal in 1998.43 In the two years from 1998 to 2000, 11% of the 10,000 respondents to the study had moved into non-nursing careers, five percent had retired and a further 12% had moved overseas or interstate. From the results it was estimated that 16,000 of the state’s 100,000 registered nurses were not in the nursing labour force and of these 27% had been completely lost to nursing, having retired or never intending to return to the profession.43
Retention issues start within the tertiary education process, where between 10% and 25% of students fail to complete their program.44 The figure is lower than for all of tertiary education. Clare et al. in their study for the Australian Universities Teaching Committee cite the reasons for departure range from academic to lack of clinical exposure early in the program.44
e) Factors affecting retention and turnover
In the UK the reasons for retention problems in the NHS have been grouped under four broad headings: pay and the cost of living; the changing nature of the job; perceptions of being ‘valued’; and other employment opportunities. Other reasons for leaving the NHS include career breaks, retirement, maternity leave, nurse education, non-nursing work, and travel.18
Certain groups of nurses have been repeatedly identified as more likely to leave the workforce (e.g. those in the youngest age groups and those in the lower paid groups). The research evidence demonstrates that there is a complex interplay between job satisfaction, career prospects, pay and household commitments. These factors are imperfectly understood for nurses in different types of labour markets. Key variables for retaining nurses are the perceived opportunities to care for people, to develop professionally, to gain autonomy and to participate in decision-making, while being fairly rewarded.45
In the NSW Health study of nurses who were no longer working, the two main reasons respondents cited for leaving nursing were family responsibilities (28%) and to move into a role that was more suited to their lifestyle and responsibilities (10%).43 Common themes expressed were dissatisfaction with management, inflexibility of hours, low pay and lack of authority to make decisions.43
When asked why they would consider staying in the profession, the nurses identified the following as the main influencers: the work (49%), money (28%), ‘the people I work with’ (26%), hours and shifts (19%), and current position/type of work (18%).42
These data do not provide the reason why people have left (that is, they are not retrospective) however, they do provide a clear insight into the important issues pertaining to the profession.
So many factors have to be considered in the retention/turnover analysis. A major consideration would be the changes to nursing work in recent years – in particular, the impact of technology and health care restructures. It is therefore difficult to differentiate between factors that would result in turnover versus those that would primarily affect retention. Both will be dependent on the balance between factors for remaining and those for leaving. Alternative opportunities both within and outside of the profession will be key factors.
Factors that may influence the decision for change are usually broken down into categories such as personal, professional, educational, financial or workplace. It should be noted, however, that a recent paper by Morrell questioned many of the data collected to evaluate retention and turnover.46 He evaluated the reasons for nurses leaving based on his concept of exposure to shock, which he defined as a single, particular event that caused a nurse to think about leaving.46 One hundred and fifty-two nurses (out of 352 participants) from eight large NHS hospitals identified shock as a reason for leaving. He identified three broad clusters of nursing turnover. The first cluster was comprised of nurses whose decision to leave was precipitated by a work-related shock (e.g. a violent occurrence). In the second cluster were nurses whose decision to leave was precipitated by a personal shock (e.g. a spouse being relocated). Finally, there was a third cluster, which followed the conventional picture of how turnover occurs. This conventional picture follows a causal chain, in which dissatisfaction leads to an employee searching for another job, thus generating alternatives to their current job. The alternatives are then weighed against the current position and a decision taken.46
Morrell noted that many analyses that are based on intent rather than action would not necessarily take into account the first two clusters and therefore have to be viewed with some caution.46 He concludes that it is important for management to be aware of different categories in turnover in order that plans may be put in place to minimise the occurrence or effect of shock.46
f) Remuneration
In the Best Practice Australia study, for example, 50% of the nurses who were still in the workforce stated that remuneration was a reason to leave to profession.42 This contrasts with the NSW Health study, which surveyed those nurses who had left the profession, and who did not rate remuneration as a major reason for leaving. 43 The difference in perceptions of the importance of remuneration of nurses who are still in the workforce and those who have left the workforce is confirmed by Summer and Townsend-Rocchiccioli, who stated ‘the tangible reward of salary is less of an issue to those who leave’.47
Clare et al. citing a 1978 South Australian study investigating why graduate nurses were leaving, reported that not one respondent stated they were leaving due to salary issues, or because they did not like nursing.44 The key reasons given were pregnancy and childcare, travel, study, illness, work conditions, job transfers, or the unsuitability of shift work. However, in their recent study, they found the major reasons that nurses gave for leaving nursing included the lack of a career path, long working hours, poor work conditions and remuneration.44
The perceived view that remuneration is the driving force to recruit and retain nurses is also questioned by Cowin and Jacobsson, who state there is ample evidence that the nursing profession has not responded to the usual strategies of wage adjustment.48 They believe that remuneration is not highly related to job satisfaction; however, when linked to organisational structure and career opportunities, it does become a significant factor.48 They note it is highly probable that a nurse will look towards the work climate and the amount of job related stress and trade off remuneration in lieu of a good working environment.48 Day’s research into morale in registered nurses in Queensland confirms Cowin and Jacobsson’s findings. He states that ‘while research has shown that non-monetary awards are more important, remuneration provides a tangible basis to rank [nursing] … against … [other professionals] in terms of societal worth or value.49
There may be particular times and circumstances when the financial rewards become an important consideration for retention. For example, it was found that for new graduates the issue of remuneration became a significant area of dissatisfaction in the transition from student to registered nurse.50 Another study undertaken in Queensland in 2001 also found that within the category of extrinsic work values, newly employed nurses in the public sector in Queensland were more dissatisfied with their remuneration than the longer serving nurses.51
g) Geographical factors
Retention rates differ across geographical regions; however, in general, rural and remote areas have a lower retention and higher turnover, with the more remote the community, the higher the turnover. A recent study by the Australian Nursing Federation (ANF) in Western Australia found that 50% of nurses in rural nurses planned to leave their employment in the next five years.52
demonstrated to affect the retention of nurses in rural and remote areas of the USA, were likely to be similar in Australia.54 Often it is the rural environment alone which can impact upon a nurse’s decision to work in a rural and remote area. For those nurses who have partners, the lack of employment opportunities for their employment can influence the decision to work in a rural or remote area.55
As noted previously, Queensland Health was experiencing a higher than state average turnover of staff in many of their rural and remote area health service districts.40 Subsequent research was carried out by surveying nurses who had resigned from Queensland Health to determine their reasons for doing so.54,55,56 Although the subject group was limited, it provides one of the few data sets examining why nurses working in rural and remote areas have actually left their place of work. These results provide important insights that may be extrapolated to other states, national or even international situations.
Of the 146 nurses who participated in the study, 77% indicated that they expected to return to nursing, i.e. would be retained in the profession. This was in agreement with previous data collected by the same authors, but was in sharp contrast to the results from a NSW Health Taskforce study for all geographical areas, in which only 36% of the nurses who were not working said they would return.43,54,55,56
The reasons given for leaving remote and rural areas in Queensland were varied; however, the most significant were related to management practices, emotional and physical demands of work, family responsibilities, workplace support and job satisfaction. The authors noted that inflexible rostering, excess administrative work, lack of education opportunities and limited progression due to lower turnover of high level staff, were contributory factors to the lower retention of staff in remote areas.54,55,56
Results from this Queensland study agreed with previous studies that retention of nurses is closely allied to job satisfaction. However, in the rural environment it appears that this is related less to the tangible factors such as financial incentives and conditions and more to the intangibles such as quality of interactions, workplace morale, role diversity, sense of relationship with the community and the ability to offer holistic care.54,55,56 Nurses more often than not chose to work in a rural and remote area for the lifestyle and had previous association with that environment, e.g. having grown up there.54,55,56
h) Job satisfaction
Job satisfaction is clearly a primary key factor influencing retention. Similar to other terminology surrounding recruitment and retention, job satisfaction has many definitions; however, a simple interpretation of all of these definitions is that job satisfaction equates with a general perception of liking and enjoying one’s job. Predictors for job satisfaction are affected by personal characteristics (e.g. age, degree, tenure), work characteristics (e.g. teams, collaboration, relations, quality of care, workload, respect) and administrative characteristics (e.g. pay, responsibilities, leadership).
A North American study of paediatric intensive care units, where shortages and turnover were both high, found that job satisfaction was most highly correlated with the work characteristics of quality of care, staffing and team respect.57 The study found no significant relationships between job satisfaction and the personal characteristic variables of age, type of degree, and tenure in nursing. However, the organisational characteristics of leadership, recognition and confidence were of some importance. Detailed analysis revealed that the single most important factor in job satisfaction was the perception by the nurses of their ability to deliver quality individualised care.57
Hegney and colleagues evaluated the effect of intrinsic and extrinsic work values on job satisfaction as perceived by the members of the Queensland Nurses’ Union (QNU).58 Results demonstrated differences among the nurses according to employment sector, job level and designation in their views on both intrinsic (e.g. emotional challenge, physical demands) and extrinsic factors (e.g. rate of pay, rewards for skills and experience). The findings of this study illustrate that the causal factors to job (dis)satisfaction differ within the profession and that any strategy to increase satisfaction and influence retention/turnover must recognise this. Furthermore, the results give further support to other studies that suggest that less experienced nurses are more at risk of leaving the profession.58
i) Role and responsibilities