UNIVERSITY OF SOUTHERN QUEENSLAND
FACULTY OF ENGINEERING AND SURVEYING
THE MECHATRONIC BAKERY
A Thesis submitted by
Bradley J Schultz, BEng (Hons)
For the award of Master of Engineering
Abstract
Large-scale bread bakeries generally exist as ‘Islands of Control’ – a long line of processes interrelated, but not interconnected in terms of their control systems. To successfully implement a control system that encompasses the entire bakery, much information must be gathered and processed in such a form that process and control engineers can deduce control algorithms.
CERTIFICATION OF THESIS
I certify that the ideas, experimental work, results, analyses, software and conclusions reported in this thesis are entirely my own effort, except where otherwise acknowledged. I also certify that the work is original and has not been previously submitted for any other award, except where otherwise acknowledged.
_____________________ _________________ SIGNATURE OF CANDIDATE DATE
ENDORSEMENT
_____________________ _________________ SIGNATURE OF SUPERVISOR/S DATE
Acknowledgements
John Billingsley, who has been the official supervisor of this project. Who would have thought one person could have so many whacky, yet brilliant ideas.
Thomas Adamczak introduced me to the wonderful world of bakeries and guided me and provided much of the material (both hardware and intellectual) with which to pursue this project.
BRI Australia Ltd for providing the equipment, monetary support and contacts required for this project
When I started this Masters she was my girlfriend, and she is now my wife of three years. I thank Di for her support.
My current employer, Vigil Systems, for encouraging me and allowing me the time to finish this project. I especially acknowledge the support of Bob Gibson and Ian Haynes at Vigil.
Stuart McCarthy, friend and fellow student and now workmate for inspiring me to finish this project by demonstrating the commitment needed in such a pursuit.
Table of Contents
ABSTRACT... II CERTIFICATION OF THESIS ... III ACKNOWLEDGEMENTS...IV TABLE OF CONTENTS... V
CHAPTER 1 – INTRODUCTION ... 1
1.1ACHIEVEMENTS OF THIS PROJECT... 2
1.2BAKING BREAD... 2
1.3PROBLEMS FACED BY BAKERIES... 3
1.3.1 Loaf Weights ... 3
1.3.2 Consistent Loaf Quality ... 4
1.4IMPROVEMENTS POSSIBLE USING A COMPLETE CONTROL SOLUTION... 4
1.4.1 Production Schedule Optimisation ... 5
1.4.2 Ingredients and Mixing ... 6
1.4.3 Dividing and Rounding ... 6
1.4.4 Intermediate Proof ... 7
1.4.5 Moulding and Panning... 7
1.4.6 Proofing ... 8
1.4.7 Baking ... 8
1.4.8 De-Panning and Cooling ... 9
1.4.9 Slicing and Packaging ... 9
1.4.10 Maintenance... 9
1.5CDROMCONTENTS... 10
CHAPTER 2 – BACKGROUND OF BAKING AND MEASURING LOAF QUALITY ... 11
2.1CONTROLLING THE BAKING PROCESS... 11
2.2BAKERS SCORE... 11
2.3CRUST COLOUR... 12
2.3.1 How to Quantify Colour... 13
2.4COLOUR RATIO... 14
2.5LOAF FIRMNESS/SOFTNESS/SPONGINESS... 15
2.6WEIGHT LOSS... 16
2.7LOAF HEIGHT,SHAPE AND VOLUME... 16
2.8SLICE TEXTURE,CELL ATTRIBUTES... 17
2.9FLAVOUR... 19
2.10SUMMARY... 19
CHAPTER 3 - DATA COLLECTION AND PROCESSING... 20
3.1OVERVIEW OF PRODUCT PERFORMANCE INDICATOR SETUP... 20
3.1.1 Factory Automation Software and PLCs ... 20
3.1.2 Scan Based System ... 21
3.2MICROSOFT VISUAL BASIC... 22
3.3LOAF WEIGHTS... 23
3.4LOAF HEIGHTS... 24
3.5TEMPERATURE AND RELATIVE HUMIDITY... 28
3.5.2 The Oven ... 29
3.6PROXIMITY SENSORS/DIGITAL INPUTS... 30
3.6.1 The Divider ... 30
3.6.2 Intermediate Prover Operation... 31
3.6.3 Into Tins ... 33
3.6.4 The Prover... 33
3.6.5 The Oven ... 33
3.6.6 The De-Panner... 34
3.6.7 The Cooler... 35
3.6.8 Conveyor Split... 35
3.7OVEN AND PROVER LOADING... 37
3.7.1 Calculating Prover Load... 37
3.7.2 Calculating Oven Load ... 37
3.7.3 Predicted Oven Load ... 39
3.7.4 Calculation of Thermal Load... 39
3.8COOLER SHELF WEIGHT... 40
3.9IMAGE/VIDEO CAPTURE... 42
3.10STOPPAGE DETECTION AT ALL POINTS... 43
3.11PRODUCT REPORTING... 44
3.11.1 Startup... 44
3.11.2 Updating Product Data... 44
3.11.3 New Product... 44
3.11.4 Future Developments ... 44
3.12SUMMARY... 45
CHAPTER 4 - WEIGHT LOSS ... 46
4.1SIGNIFICANCE OF WEIGHT LOSS... 46
4.1.1 Legal Requirements and Product Giveaway... 46
4.1.2 Relation to Loaf Quality... 48
4.2ESTIMATION OF WEIGHT LOSS USING ONLY WEIGHT FILES... 48
4.2.1 Alignment by Beginning/End/Middle ... 49
4.2.2 Alignment by Extending Final Weights... 51
4.2.3 Description of Weight Loss Calculations Macro... 53
4.3LOAF BY LOAF CALCULATION OF WEIGHT LOSS... 54
4.4WEIGHT VARIATION AT DIVIDER... 55
4.5WEIGHT VARIATION THROUGH OVEN... 58
4.5.1 Weight Loss Across Oven Shelf... 59
4.5.2 Accurately Determining Weight Loss Variation Across the Oven Shelf... 60
4.5.3 Weight Loss During Single Product... 61
4.5.4 Weight Loss Variations from Day to Day ... 62
4.6SUMMARY... 63
CHAPTER 5 - THE OVEN... 64
5.1WHAT HAPPENS TO BREAD DURING BAKING... 64
5.2OVEN OPERATION... 64
5.2.1 Shortcomings of Current Oven Design and Control Strategy ... 67
5.3FACTORS THAT INFLUENCE OVEN TEMPERATURE... 68
5.4OVEN TEMPERATURE THEORY... 69
5.4.1 Oven Temperature Profile Customising ... 70
5.5RELATING OVEN TEMPERATURE TO LOAF TEMPERATURES... 73
5.5.1 More Temperature Sensors... 75
5.5.2 Bakelog Matching by Geometrical Calculation... 78
5.5.3 Using Multiple Regression... 82
5.5.4 Low Pass Filtering ... 83
5.5.5 Summarising Data and Conducting Regression ... 84
5.5.6 Applying the Equations ... 86
5.5.7 Discussion of Results ... 87
5.6MATCHING LOAF TEMPERATURES TO WEIGHT LOSS... 88
5.6.1 Possible Causes of Errors... 92
5.7OVEN THERMAL LOAD... 93
5.8THERMAL LOAD FROM TINS... 94
5.9THERMAL LOAD FROM THE DOUGH... 95
5.10SIMPLE APPROACH USING EFFECTIVE PROPERTIES... 95
5.11MODELLING OVEN TEMPERATURES (PROPOSED METHOD)... 95
5.12CONCLUSION... 97
CHAPTER 6 - PRODUCT FOLLOWING AND REPORTING... 99
6.1WHY FOLLOW PRODUCTS AND LOAVES? ... 99
6.2PRODUCT FOLLOWING SOFTWARE... 99
6.3POST PRODUCTION ESTIMATION EXCLUSIVELY USING WEIGHT DATA... 100
6.3.1 Product Reporting Macro File - ‘Produce Report Generator 1.xls’ ... 101
6.3.2 Matching Initial and Final Weight Product Numbers ... 102
6.3.3 Other Data ... 103
6.3.4 Data to be entered: ... 103
6.3.5 Manually Running the Macro ... 103
6.3.6 Running the Macro from the PPI Software... 104
6.3.7 Resulting Product Report... 104
6.4CORRELATION OF GAPS... 105
6.4.1 Description of Gap Correlation Approach ... 106
6.4.2 Other Correlation Issues... 110
6.5POST-PRODUCTION LOGICAL PROCESSING... 110
6.5.1 Deterministic and Non-Deterministic Events... 111
6.6DETAILED DESCRIPTION OF TECHNIQUE... 111
6.6.1 Node A: Initial Weights... 113
6.6.2 Node B: Intermediate Prover... 113
6.6.3 Extra 1: Intermediate Prover Shelf Data... 114
6.6.4 Node C: Into Tin ... 114
6.6.5 Node D: Prover Loading... 115
6.6.6 Extra 2: Prover Shelf Data ... 116
6.6.7 Node E: Oven Loading... 117
6.6.8 Extra 3: Oven Shelf Data ... 118
6.6.9 Node F: Depanner ... 118
6.6.10 Extra 4: Cooler Shelf Data ... 119
6.6.11 Node G: Cooler Exit ... 119
6.6.12 Node H/I: Split Sensors 1 and 2... 120
6.6.13 Node J/K: Final Weights 1 and 2... 120
6.6.14 Further Discussion... 120
6.6.15 Results ... 121
6.6.17 Future Possibilities ... 124
6.7REAL TIME LOGICAL PROCESSING... 124
6.8USING PSEUDO-RANDOM SEQUENCES TO ACCURATELY LINE UP LOAVES... 125
6.8.1 Loaf Losses and Order Changes... 125
6.8.2 Re-ordering Loaves After Conveyor Split... 126
6.8.3 Effect of Unequal Weight Losses Across Oven Shelf ... 126
6.9CONCLUSIONS... 127
CHAPTER 7 - CONCLUSIONS AND RECOMMENDATIONS... 128
7.1FUTURE PROJECTS... 129
7.1.1 Weight Processing Software ... 129
7.1.2 Product Following ... 129
7.1.3 Bakery Operator Early Warning System... 130
7.1.4 Oven Modelling and Temperature Control... 130
7.1.5 Oven Redesign... 131
7.1.6 Determining Optimum Baking Conditions... 131
7.2ANOTHER APPROACH –DETERMINING CUSTOMER SATISFACTION... 132
7.2.1 Quality Variation ... 133
BIBLIOGRAPHY... 134
APPENDIX A: GENERAL LOGGING DETAILS FOR THE PRODUCT PERFORMANCE INDICATOR SOFTWARE PACKAGE... 136
APPENDIX B: BAKERY PROCESS PHOTOS... 141
List of Figures
FIGURE 1.1:RAPID DOUGH METHOD OF BAKING BREAD... 3
FIGURE 1.2:SAMPLE SLICE OF BREAD... 4
FIGURE 2.1:THE HUNTERLAB COLORTRENDTMHT(FROM THE HUNTERLAB WEBSITE, HTTP://WWW.HUNTERLAB.COM)... 12
FIGURE 2.2:COLOUR SOLID FOR L* A * B COLOUR SPACE... 14
FIGURE 2.3:AN EXAMPLE OF AN INSTRON UNIVERSAL TESTING MACHINE (FROM THE INSTRON WEBSITE, HTTP://WWW.INSTRON.COM)... 15
FIGURE 2.4:A DIAGRAM OF SIDE WALL CAVING... 17
FIGURE 2.5:A PHOTOGRAPH OF THE CRUMB GRAIN OF A LOAF... 18
FIGURE 2.6:A DIAGRAM OF HOW IMAGE ANALYSIS MAY BE USED ON-LINE IN A BAKERY ... 19
FIGURE 3.1:DEMONSTRATION OF LIMITATIONS OF A SCAN BASED SYSTEM... 22
FIGURE 3.2:FIRST CHECKWEIGHER - AFTER LOAVES ARE DIVIDED AND ROUNDED... 23
FIGURE 3.3:PHOTO OF HEIGHT SENSOR POSITIONING (SENSOR IS CIRCLED AND SENSING DIRECTION IS SHOWN WITH AN ARROW... 25
FIGURE 3.4:DEMONSTRATION OF TIN INTERFERING WITH LOAF HEIGHT MEASUREMENTS... 26
FIGURE 3.5:FOAM PATTERN USED TO CONFIGURE HEIGHT MEASUREMENT... 27
FIGURE 3.6:EXAMPLE OF AVERAGING INSTANTANEOUS HEIGHT READINGS... 28
FIGURE 3.7:FRONT DISPLAY OF THE CAL9400TEMPERATURE CONTROLLER (FROM THE CAL WEBSITE, HTTP://WWW.CAL-CONTROLS.COM/) ... 29
FIGURE 3.8:PROXIMITY SENSORS AT INITIAL CHECKWEIGHER (AFTER DIVIDER). SENSORS ARE CIRCLED... 31
FIGURE 3.9:INTERMEDIATE PROVER OPERATION... 32
FIGURE 3.10:DIAGRAM OF POCKET MOVEMENT IN INTERMEDIATE PROVER... 32
FIGURE 3.11:OVEN STRAP SENSOR LOCATION... 34
FIGURE 3.12:PROXIMITY SENSOR AFTER DEPANNER... 35
FIGURE 3.13:LOCATIONS OF SENSORS AROUND CONVEYOR SPLIT. (INCLUDING COOLER EXIT SENSOR) ... 36
FIGURE 3.14:PHOTO OF ONE OF THE OVERHEAD LOAF SENSORS AT THE CONVEYOR SPLIT... 36
FIGURE 3.15:EXAMPLE OF OVEN LOAD AND BAKING TIME DATA... 39
FIGURE 3.16:PHOTO OF TWO OF THE FOUR LOAD CELLS ON THE COOLER ENTRY SHELF ... 41
FIGURE 3.17:DIAGRAM OF HOW THE LOAD CELLS ARE PLACED AT THE COOLER LOADING SHELF... 41
FIGURE 3.18:PLOT OF LOAD CELL READINGS, SENSOR READINGS AND LOGGED SHELF WEIGHT... 42
FIGURE 3.19:CAPTURED IMAGE OF LOAF FOR ARCHIVING... 43
FIGURE 4.1:EXAMPLE OF WEIGHT LOSS VARIATION (SCHULTZ,BILLINGSLEY ET AL. 2000) ... 47
FIGURE 4.2:RELATIONSHIP BETWEEN COLOUR, FIRMNESS AND WEIGHT LOSS... 48
FIGURE 4.3:ALIGNMENT OF WEIGHTS BY BEGINNING. ... 50
FIGURE 4.4:ALIGNMENT OF WEIGHTS BY END... 51
FIGURE 4.5:EXPLANATION OF HOW LINEAR INTERPOLATION APPROACH WORKS. THE INTERPOLATED VALUES ARE SIMPLY PLACED ON THE STRAIGHT LINE JOINING TWO FINAL WEIGHTS OF AN EXTENDED FINAL WEIGHT SERIES... 52
FIGURE 4.7:AN EXAMPLE OF THE VARIATION IN DIVIDED WEIGHTS WITHIN A SINGLE VARIETY... 55
FIGURE 4.8:THE DEVIATION OF WEIGHTS FROM THE MOVING AVERAGE WITH THE STANDARD DEVIATION SHOWN... 56
FIGURE 4.9:THE DEVIATION OF WEIGHTS FROM THE MOVING AVERAGE WITH THE STANDARD DEVIATION SHOWN... 57
FIGURE 4.10:THE DEVIATION OF GROUPED WEIGHTS FROM THE MOVING AVERAGE WITH THE STANDARD DEVIATION SHOWN... 58
FIGURE 4.11:OVEN SHELF WEIGHT LOSS PROFILE DETERMINED MANUALLY... 59
FIGURE 4.12:EMBOSSED PATTERN ON LOAF FOR RECOGNITION BY IMAGE ANALYSIS. 61
FIGURE 4.13:PLOT DEMONSTRATING VARIATIONS IN WEIGHT LOSS FROM DAY TO DAY
... 62 FIGURE 4.14:PLOT DEMONSTRATING VARIATIONS IN FINAL WEIGHTS FROM DAY TO
DAY... 63
FIGURE 5.1:DIAGRAM OF OPERATION OF A SINGLE OVEN ZONE... 65
FIGURE 5.2:DIAGRAM OF OVEN OPERATION... 66
FIGURE 5.3:PLOT OF MEASURED OVEN TEMPERATURE, SET-POINT AND BURNER
OPERATION IN BOTH ZONES... 68
FIGURE 5.4:SET-POINTS EXPERIENCED BY A LOAF OF PRODUCT ‘A’ ENTERING AT 26 MINUTES COMPARED TO THE RECOMMENDED SET-POINTS... 72
FIGURE 5.5:THE BAKELOG IN USE. ... 73
FIGURE 5.6:PLOT COMPARING THE MEASURED TEMPERATURE IN THE OVEN TO THE ACTUAL TEMPERATURE EXPERIENCED BY THE LOAF... 74
FIGURE 5.7:ANOTHER PLOT COMPARING THE MEASURED TEMPERATURE IN THE OVEN TO THE ACTUAL TEMPERATURE EXPERIENCED BY THE LOAF. ... 75
FIGURE 5.8:DIAGRAM OF THERMOCOUPLE SENSOR PLACEMENT IN THE OVEN... 76
FIGURE 5.9:SHELF POSITIONS... 79
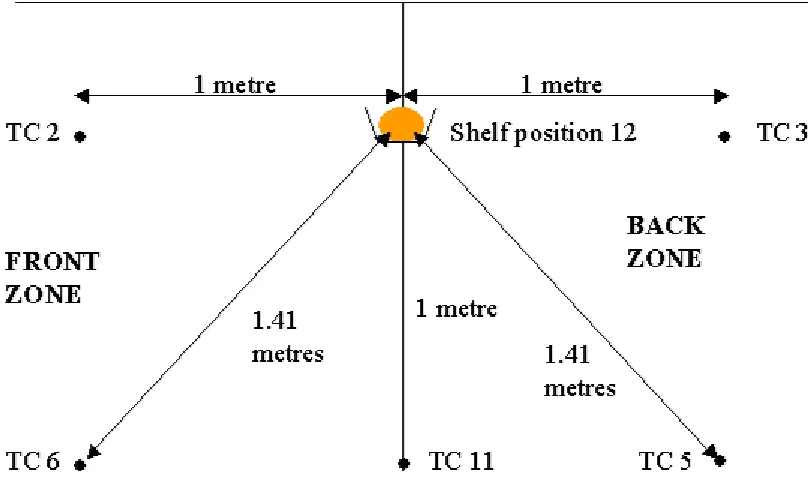
FIGURE 5.10:DIAGRAM OF THERMOCOUPLE SENSOR PLACEMENT AROUND SHELF POSITION 12. ... 80
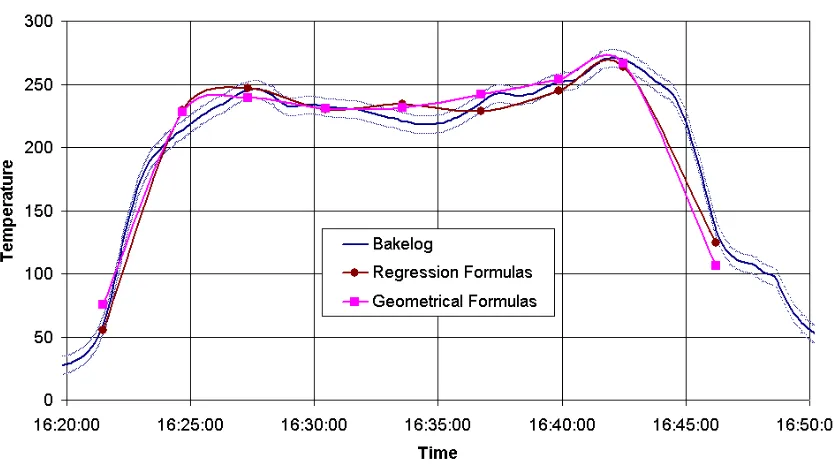
FIGURE 5.11:BAKELOG VALUES COMPARED TO ESTIMATED LOAF-PERCEIVED
TEMPERATURES –TEST 1. (THE LIGHT BLUE LINES ARE ARBITRARY AND ASSIST WITH ESTIMATING CLOSENESS OF THE TWO ESTIMATED VALUES)... 87
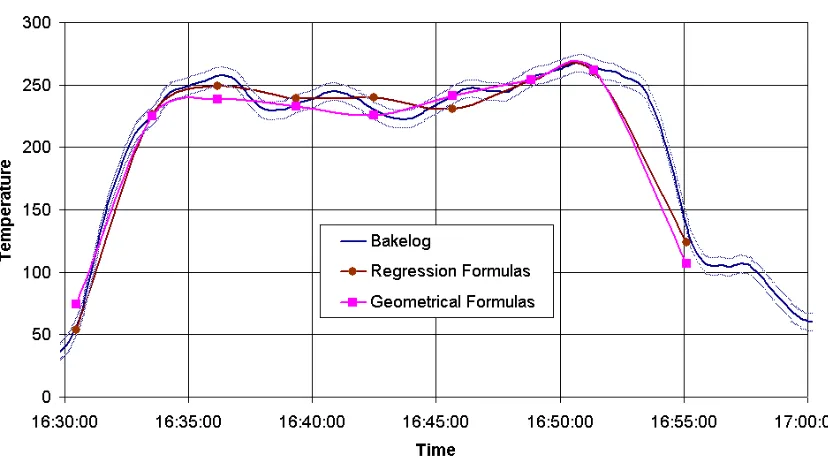
FIGURE 5.12:BAKELOG VALUES COMPARED TO ESTIMATED LOAF-PERCEIVED
TEMPERATURES –TEST 2. (THE LIGHT BLUE LINES ARE ARBITRARY AND ASSIST WITH ESTIMATING CLOSENESS OF THE TWO ESTIMATED VALUES)... 88
FIGURE 5.13:WEIGHT LOSS FOR THE FIRST ONE THOUSAND LOAVES OF PRODUCT 1,
03/10/2000. THE NUMBERS ON THE WT LOSS SERIES REFER TO THE SHELF
NUMBER. ... 89
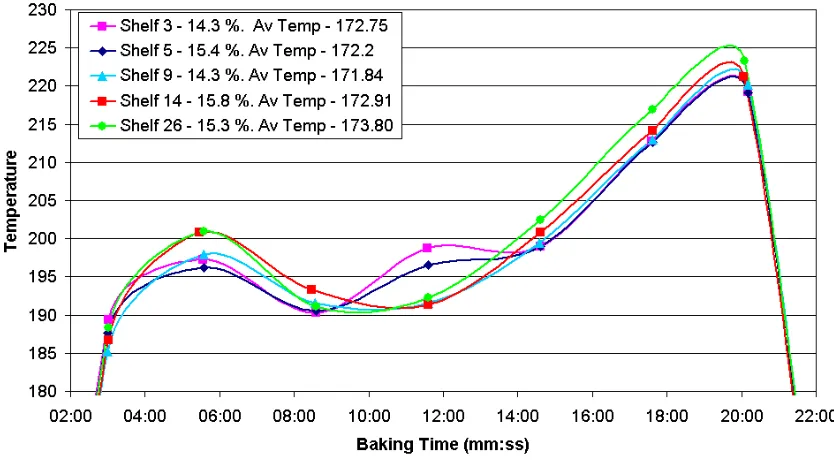
FIGURE 5.14:WEIGHT LOSS COMPARED TO LOAF-PERCEIVED OVEN TEMPERATURE FOR SEVERAL SHELVES... 90
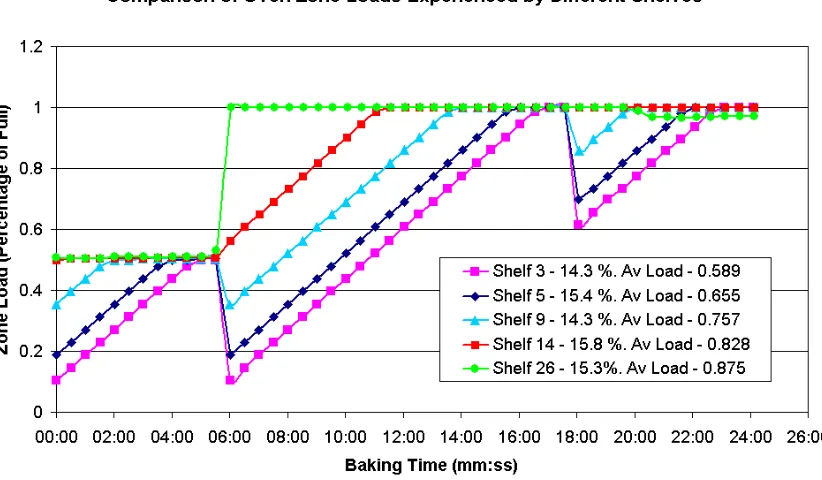
FIGURE 5.15:WEIGHT LOSS COMPARED TO OVEN ZONE LOAD FOR SEVERAL SHELVES91
FIGURE 5.16:SYSTEM DIAGRAM OF TYPICAL BAKERY OVEN... 96
FIGURE 6.1:PART OF SHEET ‘PRODUCTS0’ IN ‘PRODUCT REPORT GENERATOR 1’.XLS
... 102 FIGURE 6.2:OTHER DATA TO BE ENTERED IN SHEET ‘PRODUCTS0’ IN ‘PRODUCT
REPORT GENERATOR 1’.XLS... 103
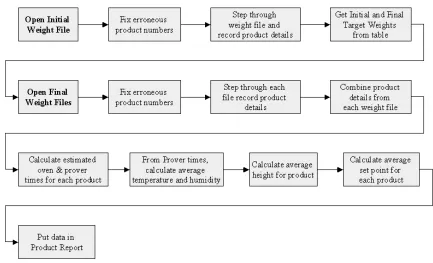
FIGURE 6.3:FLOW CHART OF DATA PROCESSING ALGORITHM TO PRODUCE PRODUCTION REPORT... 104
FIGURE 6.4:EXAMPLE OF PRODUCT REPORT PRODUCED BY MACRO IN ‘PRODUCT
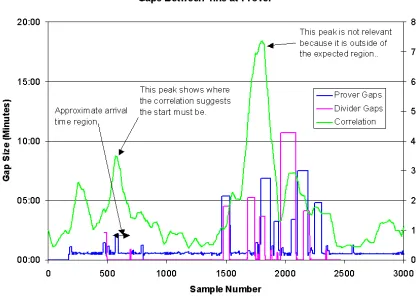
FIGURE 6.5:PLOTS SHOWING GAPS BETWEEN LOAVES/TINS AT THE DIVIDER/PROVER.
... 106
FIGURE 6.6:PLOT SHOWING HOW CORRELATION CAN SHOW WHERE THE PRODUCT CHANGE GAPS OCCUR... 109
FIGURE 6.7:NODE DIAGRAM OF THE BAKERY... 112
FIGURE 6.8:MIXING UP OF PRODUCTS AT PROVER ENTRANCE... 116
FIGURE 6.9:PRODUCT COUNTS AT VARIOUS POINTS RESULTING FROM PRODUCT TRACKING... 122
FIGURE 6.10:CHART OF PRODUCT COUNTS AT VARIOUS POINTS RESULTING FROM PRODUCT TRACKING... 123
FIGURE B.1:CHECKWEIGHER AFTER MIXER,DIVIDER AND ROUNDER... 141
FIGURE B.2:DIVIDER CHECKWEIGHER FROM BEHIND, SHOWING DOUGH ENTERING CONVEYOR FROM ROLLER. ... 141
FIGURE B.3:THE INTERMEDIATE PROVER... 142
FIGURE B.4:DOUGH ROLLING AND SHAPING SECTION... 142
FIGURE B.5:ROLLED DOUGH IS ‘TWISTED’ ... 143
FIGURE B.6:INTO TINS... 143
FIGURE B.7:CONVEYOR TOWARDS PROVER... 144
FIGURE B.8:TINS ENTERING PROVER LOADING SECTION... 144
FIGURE B.9:PROVER/OVEN CONTROL PANEL WITH PROVER IN BACKGROUND... 145
FIGURE B.10:TINS EXITING PROVER... 145
FIGURE B.11:OVEN ENTRY AND EXIT SECTION... 146
FIGURE B.12:TINS EXITING OVEN... 146
FIGURE B.13:TINS EXITING OVEN AND MOVING ONTO CONVEYOR... 147
FIGURE B.14:TINS APPROACHING DEPANNER... 147
FIGURE B.15:LOAVES EXITING DEPANNER (TINS ARE ON CONVEYOR BELOW... 148
FIGURE B.16:COOLER LOADING ARM IN OPERATION... 148
FIGURE B.17:VIEW OF SHELVES INSIDE COOLER... 149
FIGURE B.18:CONVEYOR SPLIT... 149
FIGURE B.19:LOAVES CORNERING AFTER CONVEYOR SPLIT... 150
FIGURE B.20:SLICER ENTRANCE... 150
FIGURE B.21:FINAL CHECKWEIGHER... 151
FIGURE C.22:“BAKERY AT A GLANCE” SCREEN... 152
FIGURE C.23:OVEN TEMPERATURE CONTROLLERS... 153
FIGURE C.24:DIGITAL SENSORS... 154
FIGURE C.25:LOADING... 155
FIGURE C.26:LOAF HEIGHT... 156
FIGURE C.27:PLCVIEW... 157
FIGURE C.28:TEMPERATURE AND HUMIDITY... 158
FIGURE C.29:WEIGHTS... 159
FIGURE C.30:BAKERY FLOW WARNINGS... 160
FIGURE C.31:HEIGHT... 161
FIGURE C.32:TEMPERATURE... 162
Chapter 1 – Introduction
A bakery is not the most obvious example of a Mechatronic system. In its usual form a bread bakery is simply a series of processes that are unrelated in terms of control. Bakery operators oversee their section of production and use predetermined empirical settings for the process. Adding instrumentation to each process and deducing advanced control algorithms will improve operation. However each process still operates on its own, with no information from other parts of the bakery.
If information from every process is combined into one main computing centre, a step towards a mechatronic system is achieved. The information must then be processed in an intelligent way that integrates effects from all baking processes. Once control strategies are implemented using the processed data, all the
requirements to create a mechatronic system are satisfied.
Using information gathered from all parts of the bakery, this project aimed to produce information of use to bakery operators that cannot currently be obtained. This included calculating weight loss information, developing product following techniques and producing summary reports showing general production information for the production managers.
1.1 Achievements of this Project
The architecture for a complete bakery control system has been developed and implemented. This system gathers data from all parts of the bakery and combines it in one central computer.
Several methods of product following were developed and tested. These methods enable the production staff to know where different product types are in the system. Additionally, this allows various bakery process values to be set in preparation for an imminent product change.
Techniques to calculate the weight loss of loaves were developed. These used the product following methods as well as additional mathematical techniques. During this process some shortcomings in the bakery processes were identified.
A major achievement was to determine the actual temperature experienced by loaves passing through the oven. This was achieved by using sensors placed throughout the oven and correlating these with temperatures experienced by a sensor travelling through the oven like a loaf of bread.
Further work aimed to correlate loaf temperature history to weight loss. This was approximately achieved in certain cases.
Using the complete bakery data acquisition system, as well as the techniques developed above, the creation of daily production reports was achieved. These give the production managers access to baking process data that had not been available before.
1.2 Baking Bread
Large bakeries generally use the Rapid Dough method of baking bread. This method is shown in Figure 1.1. There are thirteen separate processes that the bread must pass through. Bread baking involves manipulating a living organism - the yeast in the dough. If the cultures are treated incorrectly in any of these processes, there may be adverse effects on the resulting product.
Figure 1.1: Rapid Dough Method of Baking Bread
Producing bread in large-scale bakeries using the Rapid Dough Method is not a simple, straightforward task. Assuming the dough has been mixed properly and suitable ingredients have been used, there is still a multitude of other problems that may occur.
Control systems found in large bakeries generally involve simple direct control of processes. Set-points for products are not necessarily optimised and few other factors are taken into account.
1.3 Problems Faced by Bakeries
1.3.1 Loaf Weights
1.3.2 Consistent Loaf Quality
Another major issue for bakeries is maintaining product quality. There is significant variation in the quality of loaves. This could be due to a plethora of different factors, and these must be isolated to determine the cause.
A loaf’s quality is determined by observing several factors including the colour of the crust, the texture of the crumb, the shape, size and of course, flavour. These are discussed more thoroughly in 0.
A picture of a slice of bread with the crust and crumb labelled is shown in Figure 1.2.
Figure 1.2: Sample slice of bread
1.4 Improvements Possible using a Complete Control
Solution
1.4.1 Production Schedule Optimisation
At the bakery, the orders would be received and an optimal production schedule determined. This production schedule would have to take into account several factors.
Strap type would have to be considered. Straps are the containers that the bread is baked in. There are generally either 2, 3 or 4 tins per strap. Larger loaves will require larger tins for baking and consequently less loaves fit in a strap. If a product requires a different strap type, operators must manually remove all old straps and place the new ones on the production line. (This process may be automated in the future.)
Replacing straps is a time consuming, manually intensive operation and is preferably performed a minimal of times during the day. The production schedule must take this into account.
Another factor to be considered when optimising the production schedule is the oven temperatures required by each product. A product requiring an oven temperature of 230°C should not be preceded by a product requiring an oven temperature of 190°C since it would take up to half an hour to increase the temperature of the oven by the required amount. Determining and maintaining the correct oven temperature is quite an involved subject and is investigated in Chapter 5.
When the product is required is an important factor as well. If 8000 loaves of a certain variety are required to be made one day, it may not be the best option to bake them all first thing in the morning. A better option may be to bake 4000 early in the morning and deliver them, then bake the rest later in the day so they may be
delivered fresh later on. This would also depend on when the bread retailers actually want the bread.
1.4.2 Ingredients and Mixing
Recipes may be stored on a central computer. According to the production schedule, this computer automatically accesses the mixer. Ingredients are automatically measured out and mixed. According to the variety, other factors such as length of time the bread is mixed and speed of mixing are altered.
Automatically measuring ingredients out gives the added advantage that the accuracy of measurements are known. It eliminates human error from this part of the baking process.
If an ingredient is running low, a new order may be electronically sent to the distributor/manufacturer of that ingredient.
An advanced addition to the control of the mixing process involves the automatic altering of critical ingredients such as yeast levels. The levels of these ingredients may be altered depending on such factors as the ambient temperature and humidity levels on that particular day. Algorithms within the control software may also
optimise these values by altering them slightly each day and monitoring the results in the product.
1.4.3 Dividing and Rounding
This section involves dividing the dough into the correct size portions and rolling them into shape. The divider is a crucial element in the baking process because any variation experienced in the initial weight of dough placed into the process cannot be subsequently reduced.
An optimum divided weight will be one that produces loaves of bread at the end of the process that correspond exactly with the marked weight of the loaves. This is one of the major challenges one is faced with when attempting to optimise the baking process. Implications of having weights that are not within specification are
The divided weights for each product may be stored in the central computer. These may then be fine tuned automatically as data is gathered about each product and optimal baking conditions are developed.
Variation in weights at the divider is experienced due to the mechanical operation of the machine. Ideally the divider would produce loaves that are all of equal weight, however due to the physical characteristics of the dough, it is quite difficult to achieve.
An advanced option may be to alter the divided weights depending on factors such as gaps in production. The loaves immediately after a gap may be divided at a greater weight. This would allow for the extra baking they would receive in the oven due to the lower thermal load during the gap. Ideally intelligent oven control would solve the problem, eliminating the need for dealing with the problem of unevenly divided loaves.
1.4.4 Intermediate Proof
Intermediate proving is used as an initial rise period for the dough. Currently the humidity, temperature and time of proving are not accurately controlled. The end effect of this on the bread is not yet fully understood.
1.4.5 Moulding and Panning
1.4.6 Proofing
Proofing allows the dough to rise via the yeast activation process. It is here that the volume and cell structure of the dough is developed for baking. Optimum proofing conditions are thought to consist of a temperature of approximately 40°C and a relative humidity of approximately 85%.
A cause of variation in the proofed height of bread is the temperature of the tins in the prover. The tins that doughs are placed in may be either hot or cold - the hot ones having recently been used in the oven. Sometimes the tins are all hot or all cold. For example, when a change of tins from 3-strap to 4-strap is done, all the new tins will be cold. Sometimes there are only a few cold tins. This happens when there is a lack of tins ready for dough to go into and an operator must place some new tins on the assembly line.
This is a difficult occurrence to deal with. The best response may be to simply have some method of ensuring the tins are all the same temperature and the yeast levels in the mix should be set to deal with that.
1.4.7 Baking
The oven, where the bread is baked is the most important process apart from the mixing of ingredients. Many avenues for control and optimisation are possible in this section of the bakery.
The oven is specifically covered in more depth in Chapter 5, but a control summary will be presented here.
Ideally, the oven would be divided into 4 to 8 separately controllable zones. Oven temperature would be controlled according factors such as loaf variety, oven thermal load and ambient conditions. The temperature histories of loaves passing through the oven could be customised according to an ideal setting for that variety and
1.4.8 De-Panning and Cooling
After the loaves are removed from their tins (de-panning), they enter a cooler where they remain for around an hour. This procedure is necessary because after the loaves have left the oven, they are still losing moisture to the atmosphere. If they are placed in bags straight away, condensation will collect inside the package. This then has adverse effects on the bread. Also, there are problems with slicing of loaves if the bread is too hot.
1.4.9 Slicing and Packaging
This is the final section in the bread production process. It has much significance in the overall control system.
Final weights are taken here. These weights are fed back to the main computer and analysed to calculate new improved set-points and ingredient levels for the next day’s production. With the ability to track particular products through the bakery, bags for each variety may be automatically changed, or alternatively operators may be warned, as a variety change is about to occur.
The slicer provides an opportunity for image analysis to be used on the loaf grain.
1.4.10 Maintenance
Although completely beyond the scope of this project, an added aspect that may be pursued when developing an advanced bakery control system is automated
maintenance warnings. Maintenance at a bakery, as at any manufacturing plant, is extremely important. Any loss in production time due to breakdowns is costly and possibly dangerous.
In addition since the communications infrastructure is already set up in the bakery, it should be easier to add other sensors. These may sense values such as vibration in motors and set an alarm state when a critical level is passed.
1.5 CDROM Contents
Included, as an appendix to this dissertation is a CDROM. This contains the entire text of the dissertation in several different formats. It also contains much extra information directly related to the project. This includes colour photos of bakery processes as well as screen shots of the Product Performance Indicator (PPI)
Chapter 2 – Background of Baking and Measuring
Loaf Quality
Control of the baking process depends on the ability to measure the quality of a loaf of bread. There are a variety of factors that can give an indication of loaf quality.
Some of the measurements that have been taken in the past include “Baker’s Score”, Crust colour, Colour ratio, Loaf softness/sponginess, Side wall caving, Weight Loss, Loaf Height, Loaf Shape, Volume, Bubble Size/Texture and Flavour.
Each of these will be discussed here. It is important to note that these qualities are dependent on a complex combination of factors including dough composition, oven conditions (temperature, air velocity, humidity), proving conditions, and cooling conditions.
2.1 Controlling the Baking Process
Little literature on overall control systems for large-scale bakeries is available. This is due to the fact that up until this point, all studies found have concentrated on control of separate processes – usually the oven. Practical work in bakeries has also focussed on individual processes rather than the system as a whole.
An interesting introduction to the world of automating complex processes that are ordinarily controlled by experienced human operators, using the specific example of a bread bakery, is “The Knowledge Based Sensor System – A Novel Measurement Approach”, (Wide, 1995).
There are many studies that investigate the processes that occur inside the oven and explore possibilities for control. Related papers are discussed in Section 5.1.
2.2 Bakers Score
values to specific loaf attributes (Pyler 1988). Since bakers score is such a subjective method, qualities such as loaf colour, crumb cell size/uniformity/shape, loaf shape and various others may not be reliably and consistently measured.
Until recently, bakeries have been obliged to use bakers’ score since it was the only realistically available method of determining loaf quality. There are several methods of more objectively determining loaf quality, especially with the advent of image analysis techniques. Ideally, baker’s score would be completely replaced with more objective techniques.
2.3 Crust Colour
Crust colour is one of the most obvious indicators of loaf quality to the naked eye. It has direct consequences with regard to the flavour of the loaf as well.
Colour may be measured in several ways. There are commercially available ‘colour meters’ such as the Hunterlab ColorTrendTM HT that has been used by BRI
Australia Ltd in several projects (Varma 1998). This is shown in Figure 2.1.
Image analysis provides a more adaptive method of measuring colour in that more detailed analysis of separate loaves may be performed. In its simplest form, the loaf may be isolated from a captured image and an averaged ‘brightness’ value may be calculated. The ambient lighting must be taken into account here as well - if the lighting level changes, a different brightness will be measured.
In Kim and Chun (1997), a loaf is monitored during baking via a CCD camera. Using red, green and blue colour histograms, the bread colour development was observed. If an ideal ‘colour development’ is defined for a particular product, conditions may be controlled to produce this result.
In the long term, measuring the colour of loaves while they are in the oven is not necessarily the best approach. It is more of a research exercise to study what is actually happening within the oven. Once the loaf is in the oven, the large time constant of the oven dictates that it is too late to change the oven temperature to accommodate that particular loaf. Instead enough needs to be known about the bread and the conditions it is experiencing to have the oven set suitably before the loaf enters.
2.3.1 How to Quantify Colour
Quantifying colour may be done in several ways. A widely used method is the L * a * b colour space devised in 1976 by the CIE (Commission Internationale de
Figure 2.2: Colour solid for L * a * b colour space
If using this method for bread, only the ‘L’ value really needs to be used since
brightness is the main indicator. However, if a measure of how constant the colour is over the loaf surface is required, image analysis is probably the best option.
2.4 Colour Ratio
This is a value proposed in Adamczak and Kallitsis, (1997). It was proposed as a result of the problem identified in industry of variation in colour between the top/bottom and sides of the loaf. The colour ratio (CR) is a ratio of the sidewall colour to the average loaf colour.
2.5 Loaf Firmness/Softness/Sponginess
Since a customer will often test the ‘freshness’ of a loaf by squeezing it, it follows that this could be done after baking to test the quality of the loaf.
An ‘Instron Universal Testing Machine’ has previously been used (Adamczak and Kallitsis, 1997) to determine the compressibility of a whole loaf. An example of such a machine is shown in Figure 2.3. In (Adamczak and Kallitsis, 1997), this compression was found to depend on the moisture content and crust properties of the loaf. This testing was performed 24 hours after baking, so results may not be exactly applicable to loaves during the baking process. Testing was done both on whole loaves and on separate slices to test the firmness and recovery of the crumb.
Figure 2.3: An example of an Instron Universal Testing Machine (from the Instron website, http://www.Instron.com)
Testing the firmness during production would require a slightly different approach. The firmness, when related to loaf quality may be fed back to bakery operators (or an adaptive control system) to monitor production. A drawback may be the fact that a firmness test might damage the loaf. This would have to be considered with any testing method.
2.6 Weight Loss
Weight loss is not one of the qualities a consumer would look at when determining loaf quality, however it has much value for use in a bakery. These uses are discussed more thoroughly in Chapter 4, “Weight Loss”, but will be quickly listed here.
Legal reasons are important. The connection between initial weight and final weights is useful because legal requirements must be met when labelling and selling loaves.
It has been found that the weight loss of a loaf has a linear relationship with other factors such as loaf colour and firmness (Adamczak and Kallitsis, 1997). If a bakery can minimise weight loss while maintaining loaf quality, great savings in ingredients may be made.
Complications in accurately determining weight loss during production have limited the study of its use in a bakery in the past. Chapter 4, “Weight Loss” looks at this in more detail.
2.7 Loaf Height, Shape and Volume
Loaf height, measured after proving is a function of ingredient levels (particularly yeast) and prover conditions. These values may be monitored from here.
The shape of a loaf of bread after baking is very important from a consumers point of view. A common problem in industry is the caving of the bread sidewalls and also caving of the top and bottom of the loaf. This was studied in Adamczak and Kallitsis (1997). It was found that caving is related to the firmness of the loaf as well. A less firm loaf will be judged as ‘fresher’, but is more likely to experience side wall caving.
Figure 2.4: A diagram of side wall caving
Measurement of sidewall caving during production may not be effective since caving usually occurs during or after slicing/bagging or during transport and handling. It is desirable however, to produce loaves that are not prone to caving. This quality may be linked with the colour ratio as discussed in Section 2.4 above. A low colour ratio indicates less baking on the sides of the loaf that may make the loaf more susceptible to caving. This would have to be verified.
2.8 Slice Texture, Cell Attributes
Figure 2.5: A photograph of the crumb grain of a loaf
The main considerations used when human experts assess crumb texture are cell size, uniformity of cell size and thickness of cell walls (Wang and Coles, 1997). Usually this is done by comparing slices with a photograph of agreed standards. This is a very subjective method since one photograph is not enough to represent a wide range of textures that may all be acceptable. It is also repetitive and time consuming.
A commercial ‘Bread Quality Imaging System’ (BQIS) was developed in (Wang and Coles, 1997). This uses edge-detecting algorithms to produce information about the cells.
Although useful, the BQIS has limited application on-line in a bakery because it requires special attention by an operator and needs separate slices from the loaves. A better method would be to measure the crumb texture during production. The
Figure 2.6: A diagram of how image analysis may be used on-line in a bakery
2.9 Flavour
Flavour is a very subjective measure of loaf quality that cannot easily be measured at the bakery. A better solution is to somehow relate the general consumer’s opinion of flavour with other indicators of loaf quality discussed here.
Ingredients and the particular variety of loaf have much do with the measured flavour. These need to be taken into account separately from other factors. That is, assuming the same variety and basic ingredients, how do changes in baking
conditions affect the flavour of a loaf of bread. At some stage, ingredients do have to be taken into account, but this is more of an issue for the product development
scientists, not for a bakery control engineer.
2.10 Summary
Chapter 3 - Data Collection and Processing
To begin assessing methods of improving control and optimising a bakery’s processes, a data collection system had to be set up. Initially, several small short term field trips were completed. These generally involved placing a minimal number of proximity sensors and the logging of weight files from the scales at a bakery.
These trips allowed product following techniques using gaps between loaves and loaf counts to be assessed. They also allowed factors such as product loss and basic weight losses to be determined.
It was quickly realised that a larger, more permanent data acquisition system was required. The hardware and software used in this larger system will be discussed here, along with how it interfaces with bakery operations.
3.1 Overview of Product Performance Indicator Setup
The combination of software and hardware used to collect, process and display data for this project was named the ‘Product Performance Indicator’, or ‘PPI’. The main aims of the PPI were as follows:
- To determine, by experimentation, what data would need to be recorded from a bakery in a commercial control system.
- To develop methods of processing and displaying data from the bakery by post-processing and real-time processing in a way that gives bakery personnel information they have not previously had access to.
- To build up an archive of data from the bakery that may be used to determine long-term trends.
3.1.1 Factory Automation Software and PLCs
operating as a ‘Programmable Logic Controller’ because the PC controls all operations through a base controller module.
Software was originally written in ‘Think & Do’, a graphical programming language by AutomationDirect for the DL series of PLCs. The software simply logged data as it was coming in. The PPI still uses Think & Do to communicate with the PLC bases, but uses Visual Basic 6.0 for the Graphical User Interface.
3.1.2 Scan Based System
The central PC collects data from the PLCs usng a scan-based system. This means that every specified period (x ms), all the I/O points are scanned. In order to sense individual loaves passing by, the scan period must be small enough to guarantee sensing of the gaps. It was found that this was not practical however, because at some points (most notably, after de-panning), the loaves were extremely close together, even to the point of touching each other.
Figure 3.1: Demonstration of limitations of a scan based system
The simple solution is to decrease the scan period to a very low value such as 5 ms. However, very small scan periods cause problems with other program operations performed by Visual Basic such as serial communications with the oven temperature controllers. Therefore the scan period needed to be increased to about 40ms. It may have been preferable to use Think & Do for all serial communications, but most code had already been written in VB before the problem was discovered. Additionally, VB was the preferred language due to its versatility.
3.2 Microsoft Visual Basic
3.3 Loaf Weights
One of the most important values that is logged by the PPI is the weights of loaves. There were already three sets of scales in place at the bakery - one at the beginning of production and two (one on each branch of the conveyor) at the end of production. The scales used are Ramsey-RCCI Checkweighers, Model WDD - Version 5. A photo of the checkweigher at the beginning of production is shown in Figure 3.2.
Figure 3.2: First checkweigher - after loaves are divided and rounded
Data is acquired from the checkweighers via separate RS-422 serial communications lines. Every time a checkweigher senses a loaf, ASCII data is automatically sent along the serial line. Serial communications were programmed directly in the Visual Basic module of the PPI.
All the checkweighers have product details stored inside them. The bakery operator selects the appropriate product when required. The initial checkweigher rejects underweight loaves, but overweight loaves are allowed to pass. There is a system in place that feeds back a control signal to the divider to automatically set the weights of loaves. Due to unsatisfactory operation of the current weight control, bakery operators usually adjust the divider manually.
As well as rejecting underweight loaves, the final checkweighers also incorporate a metal detector that rejects any loaves with metal in them.
The data that is resolved by the PPI includes (for each loaf), the product number, the weight and whether it was overweight, underweight or passable. If the loaf was rejected due to a metal detection, that is logged as well.
Product names are stored in the checkweigher but are not transmitted with the data from the checkweighers. The PPI has a list of product numbers and names that is updated from the checkweigher every time a product changes. In this way, the product name may be displayed on the PPI screen.
3.4 Loaf Heights
An ultrasonic proximity sensor measures the height of loaves as they exit the prover.
Figure 3.3: Photo of height sensor positioning (sensor is circled and sensing direction is shown with an arrow.
To calculate the height of a loaf, the average of all the readings taken across that loaf is calculated. It is assumed here that the PLC scan period is 40ms (25 readings per second), the conveyor speed is approximately 0.3 m/s and the tins are about 30cm long.
Figure 3.4: Demonstration of tin interfering with loaf height measurements
Placement of the sensor must be done carefully so as to ensure that all types of strap (2,3 and 4 tins) are sensed properly. This means that the sensor will not sense every type of loaf along the centre line. This is not a problem - as long as it is known what the recommended heights of loaves should be along the particular section being measured. If an accurate measure of the height is required, a different approach must be taken.
Figure 3.5: Foam pattern used to configure height measurement
Firstly, static measurements were taken on both the 60mm and 100mm sections to check that the sensor was configured. Once this was done, moving checks could be performed. It was found that the height sensor would measure accurately to about 2mm.
Figure 3.6: Example of averaging instantaneous height readings
3.5 Temperature and Relative Humidity
The temperatures and relative humidities of several processes are measured. Logging frequency is configurable upwards from a minimum of once every 2 sec.
3.5.1 The Intermediate Prover, Prover and Cooler
Temperature and relative humidity are measured in the intermediate prover, the prover and the cooler. There is one temperature and RH sensor in the intermediate prover and two of each sensor in the prover and the cooler. In the prover there is one on the left and one on the right side, giving a balanced measure of the values. In the cooler, there is one inside and one in the inlet air duct. This allows the effect of the temperature of the air entering the cooler on the cooler temperature to be determined. The humidity sensors used are capacitance type sensors made by Vaisala.
3.5.2 The Oven
Oven temperature measurement is analysed in greater detail in Section 5.5. All sensors in the oven are thermocouples connected to the main PC via either a thermocouple module in the PLC (4 Inputs) or a ‘SmartReader Plus 7-Channel Temperature Logger’ by ACR Systems Inc (7 channels + ambient). This is connected to the main system by an RS-485 connection.
Thermocouples are type ‘K’ thermocouples and are exposed to the oven air with no thermal shielding.
There are two temperature controllers for the oven, each controlling a separate burner. These controllers are ‘CAL 9400 Dual Display Autotune Temperature Controller. Each is connected to a single thermocouple that has thermal shielding around it, slowing down response time to temperature changes. This reduction in response time is necessary due to physical constraints of the burners. The burners should not be allowed to switch on/off too quickly or the flame is in danger of extinguishing. This constraint on the oven is one reason why accurate temperature control is so difficult.
Figure 3.7: Front display of the CAL 9400 Temperature Controller (from the CAL website, http://www.cal-controls.com/)
Data is acquired from the temperature controllers via an RS-485 serial line using the MODBUS RTU protocol. This protocol is designed as a standard that allows many different types of device communicate over one serial cable. These serial
has its own ID address and returns data when it is requested by the PPI. Data that is returned includes the measured temperature, the oven set-point, the output state (Normal output On/Off and Alarm output On/Off). The alarm output is always set about 4 degrees below the set-point. If the temperature reaches this low, the burner is set on ‘High’. During normal output the burner is set on ‘Low’.
3.6 Proximity Sensors/Digital Inputs
Each PLC has a digital input card. These inputs are used to connect to proximity sensors and to relays that respond to the movement of processes. Optical proximity sensors are located at various points to sense the passage of loaves. Also, digital inputs are taken from other processes to indicate their movements.
A final configuration for the placement of sensors has not been reached. Current sensor placements and future suggestions are discussed here.
3.6.1 The Divider
The first proximity sensor is located just before the checkweigher, after the dough is divided and rolled. This sensor is quite reliable although the operator’s hands may interfere with it sometimes.
The second sensor is located directly after the section where underweight loaves are rejected. This loaf count from this sensor is not completely reliable because the dough rejection system is not completely reliable. Sometimes the rejection system attempts to reject a piece of dough, but does not succeed. The sensor will not sense this piece of dough, yet it is in the intermediate prover.
calculation of weight loss is to be pursued, reliability will need to be increased here (See Chapter 6).
Figure 3.8: Proximity sensors at initial checkweigher (after divider). Sensors are circled.
3.6.2 Intermediate Prover Operation
Figure 3.9: Intermediate prover operation
Additionally, a digital input that senses the forward movement of the pockets as they enter the prover may be useful to allow precise tracking of loaves through the
intermediate prover. The operation of the prover loading is shown in Figure 3.10.
3.6.3 Into Tins
After being rolled, the pieces of dough are put into tins. A digital input is taken from here. It reliably goes ‘On’ when a piece of dough enters a tin.
3.6.4 The Prover
A digital input is connected to a relay that operates when the loading arm at the prover operates. This loading arm will only load the prover with tins when there are 12 tins ready to load, or when the operator manually activates it (More about this in Chapter 6. The relay goes ‘On’ when the arm is in operation.
A digital input is also connected to a relay that operates when the shelves in the prover move. This relay goes ‘On’ while the shelves are moving.
3.6.5 The Oven
There is a proximity sensor located between the prover exit and oven entry. It senses individual straps as shown in Figure 3.11. This sensor originally had some problems with being obstructed by dust since it was located close to where ‘toppings’ are put on the bread (eg flour or sesame seeds). It had to be cleaned regularly. A new position was found closer to the oven entry as shown. Cleanliness of the sensor has been improved but it still has to be wiped every few days to ensure reliable
operation.
Figure 3.11: Oven strap sensor location
As with the prover, a digital input is connected to a relay that goes ‘On’ when the oven shelves are moving.
3.6.6 The De-Panner
A digital input is taken from a sensor that is part of the de-panner. This sensor turns ‘On’ as each loaf is removed from its tin. However currently the counts being recorded are not accurate. This is because at the point the sensor is located, the loaves are extremely close together. The gap is too small to be sensed with the current scan times being used.
Figure 3.12: Proximity sensor after depanner
3.6.7 The Cooler
There are three digital inputs from the cooler section of production. The first goes ‘On’ when the cooler shelves are moving. The second is connected to the cooler loading arm and goes ‘On’ when the loading arm is in operation. This sensor is used to decide when to log cooler shelf weight.
The third sensor is a proximity sensor placed after the cooler exit, before the
conveyor split. It senses individual loaves, but the count is not accurate since many of the loaves are very close together.
3.6.8 Conveyor Split
Sensors in this region are needed to be able to re-calculate the order of loaves entering the slicers. Before each slicer is a buffer where the loaves queue. This means that the order in which the loaves leave the cooler are not necessarily the order they are sliced (and weighed) in.
Figure 3.13: Locations of sensors around conveyor split. (Including cooler exit sensor)
3.7 Oven and Prover Loading
Calculating the thermal load in the oven and prover was a major objective of the project. However, many difficulties have been encountered that make accurate calculation very difficult.
Currently, the approach taken involves expressing the oven load in terms of a percentage of the maximum number of straps the oven or prover can hold.
3.7.1 Calculating Prover Load
Prover load is calculated by using the input from the prover loading digital input and the prover shelf movement digital input.
When the prover loading arm operates, it is assumed that a full shelf of loaves has entered the prover. It is known that the prover has 147 shelves. Two of these shelves are always outside the prover (at the entry and exit), so the maximum load is the number of shelves inside the oven, multiplied by the maximum number of straps on each shelf. For the prover here, the maximum load is 1740 straps.
The number of straps on each shelf are stored in an array in the PPI. Each time the prover moves forward one shelf, the new load is calculated and expressed as a percentage of the maximum load.
Ideally, the exact number of straps on each shelf would be known. This may be achieved by placing a proximity sensor at the prover entrance (as is done with the oven). This may be done in the future.
3.7.2 Calculating Oven Load
The oven has fifty shelves, two of them being outside (the entry and exit). Each shelf can hold a maximum of twelve straps, so the maximum load is 576 straps.
Unlike the prover load calculations, the precise number of straps on each shelf is counted by the proximity sensor. The number of straps on each shelf is stored in an array in the PPI. Each time the oven moves forward one shelf, the new shelf is added to the load and the old shelf is taken away.
As well as total oven load, the load in each of the zones inside the oven is calculated. The particular zone that a shelf is in is known because all shelf movements are tracked and the first twelve shelves are in the front zone, the next 24 are in the back zone and the final twelve are in the front zone. The nature of this design means it would be quite difficult to optimise the temperatures experienced by the loaves as they pass through.
Additionally, the front zone (Zone 1) is divided into two separate zones (‘a’ and ‘b’). Zone 1a is the first twelve shelves and zone 1b is the last twelve shelves
In addition to load, the baking time is also logged. This is calculated by subtracting the entry time stored for this shelf from the exit time.
Figure 3.15: Example of oven load and baking time data
3.7.3 Predicted Oven Load
Since the load in the prover is known, it follows that the load in the oven should be able to be predicted in advance. Theoretically, the load is able to be predicted 147 shelves in advance. This translates to over one hour, which should be ample time to prepare the oven for any thermal load change.
Predicted load is still in its development phase, but would be an important part of a final control system.
3.7.4 Calculation of Thermal Load
One addition that may help estimate thermal load more accurately is to be able to sense what sort of straps are entering the oven. There are three type of straps - those that hold four loaves, those that hold three normal loaves and those that hold three extra-long loaves. The weights of loaves in each type of tin are similar (to within approximately 50 grams). So if each type of tin could be sensed, an approximation of the weight of loaves in them could be performed.
It should be possible to determine the difference between normal length 3 and 4 loaf straps and the extra long 3 loaf strap. This could be achieved by measuring the length of time either the height sensor or the oven entry sensor is on.
3.8 Cooler Shelf Weight
Load cells were placed on the cooler entry shelf to measure the weight of loaves on that shelf. This is the shelf that loaves are conveyed onto before entering the prover. Taking the weight of loaves here is useful because it will allow calculation of the relative amounts of weight loss in the oven and in the cooler. Although most weight loss occurs in the oven, moisture is still being lost to the atmosphere as the loaves cool. Cooling time and conditions affect this amount of weight loss.
Figure 3.16: Photo of two of the four load cells on the cooler entry shelf
Figure 3.17: Diagram of how the load cells are placed at the cooler loading shelf
reading prior to the shelf loading is taken as the correct weight of the shelf. A diagram of how this works is shown in Figure 3.18.
Figure 3.18: Plot of load cell readings, sensor readings and logged shelf weight
No verification was done on the accuracy of the load cells when measuring the shelf weight. The purpose of their inclusion in the PPI was primarily with a view to use the data to determine weight loss in the cooler at some point in the future.
3.9 Image/Video Capture
Image capture has been added to the PPI currently as an archiving tool. Images can be captured to file either every x minutes during the day or manually by clicking on a button in the PPI. There is also the possibility of triggering the image capture as a result of some other event occurring such as an extra high/low group of loaves or after exceptionally high/low oven temperatures.
An example of a captured image is shown in Figure 3.19. The quality of these images were kept low to save disk space.
Figure 3.19: Captured image of loaf for archiving
3.10 Stoppage Detection at All Points
An added feature of the PPI that has been partially implemented is stoppage detection. It is useful for the production manager and maintenance staff to have a view on the computer monitor of when there is a stoppage in production. This feature has been implemented to display a stoppage when it occurs at any of the following points:
- Initial checkweigher - Into tins
- Prover loading - Oven loading - Depanner sensor - Cooler exit
- Both final checkweighers
With extra inputs from various relays and other sensors around the bakery, this feature could become an extremely valuable part of the PPI. It could alert production managers of any out-of-place events in the bakery. Also, technical personal could have a record of operations of different machines and a maintenance schedule could be accurately adhered to.
3.11 Product Reporting
The Product Performance Indicator software has the ability to access a report generation macro written in Microsoft Excel. A brief description of how this is achieved is included here.
3.11.1 Startup
When the PPI starts up, Microsoft Excel is started. A file is opened in excel that contains the report generation macro. The user selects a day to produce a report for and the PPI issues commands to Excel. After setting several values in Excel cells, the macro ‘DATAPROCESSBYWEIGHTS’ is run. If an error occurred during the running, a message box is displayed that shows the cause of the error.
3.11.2 Updating Product Data
Whenever product data is updated at the checkweighers, this updated data is sent along the serial line. The PPI captures this data then enters the new data into the appropriate place in the Excel data file.
3.11.3 New Product
When a new product starts at any of the checkweighers, the product name is retrieved from Excel and displayed on the screen. Additionally, when a new product arrives, the PPI automatically requests the product data (name, over-weight, under-weight and pass-weight) for that product from the checkweigher. The data is updated in Excel as discussed above in ‘Updating Product Data’.
3.11.4 Future Developments
This may be solved by running excel in ‘Invisible’ mode, but it needs to be visible when the Product Report is shown. An alternative approach is to open a separate version of Excel, or the product report could be sent to the printer and not displayed on the screen.
Another issue with using Excel is that transferring the data processing to another program seems unnecessary. Visual Basic has all the abilities to process the data, so in the future a data base may be used in Visual Basic to log bakery data. All the data processing would then be done in Visual Basic. Alternatively, an Access database may be accessed from within Visual Basic.
3.12 Summary
Chapter 4 - Weight Loss
The importance of weight loss was introduced in Section 2.6. Its significance will be discussed more thoroughly in this chapter. Methods of determining the weight loss of loaves will also be presented.
4.1 Significance of Weight Loss
4.1.1 Legal Requirements and Product Giveaway
One of the major reasons for the importance of weight loss is the unwillingness of the bakery to produce under or overweight loaves. Underweight loaves are illegal to sell and the bakery must satisfy the following requirements from the Trade
Measurements (Pre-packed Articles) Regulation 1997 under the Trade Measurements Act 1989:
- No loaf may be less the 5 % below nominal weight.
- The average weight of any 12 loaves picked at random may not be below nominal weight.
Figure 4.1: Example of Weight Loss Variation (Schultz, Billingsley et al. 2000)
To enable the final weight of loaves to be accurately controlled, it is necessary to establish a relationship between the initial weights and the final weights in terms of the ingredients and the conditions the loaves encounter.
One of the difficulties with decreasing product giveaway is that currently there is a large spread of loaf weights at the end of production. In Figure 4.1, the initial
standard deviation is already 4 grams. By the end of production, this has increased to over 8 grams. To decrease the average final weight to a value close to the nominal weight means that many loaves will be under weight, increasing the chance of contravening the legal requirements stated above. This is why bakeries currently operate at such high product giveaway levels.
4.1.2 Relation to Loaf Quality
In (Adamczak and Kallitsis 1997), a report compiled at BRI Australia Ltd, several relationships between weight loss and other indicators of loaf quality were
established through experiments in controlled circumstances. Figure 4.2 shows a linear link between colour, firmness and weight loss.
Figure 4.2: Relationship between colour, firmness and weight loss
If the link between weight loss and loaf quality can be verified in practice at a bakery, and a reliable method of calculating weight loss during production
developed, new avenues for bakery control will be opened. Relating weight loss to oven conditions is discussed more thoroughly in Chapter 5.
4.2 Estimation of Weight Loss Using Only Weight Files
resulting values is then taken as the approximate weight loss. This is the simplest way to calculate weight loss since it does not involve exact product following.
There are several problems with this method however. Firstly, the final product numbers are not always accurate since the bakery operator does not always know exactly what product is passing through. Before calculating weight loss it is
recommended that a simple mathematical check be done that confirms that the final weight file starts at approximately x minutes after the initial weight file, where x is the average total production time for that product. A similar check may be
performed to confirm that the ends of the weight files are legitimate.
Also, to produce the ‘final weight’ file, the separate files from each final set of scales must be combined. This was generally done according to the time loaves were weighed. Although this would not result in the exact order loaves were baked, it is accurate enough for these calculations.
Another problem is that loaves are lost during production. This means that there are less final weights logged than initial weights. A method of ‘lining up’ the loaves must be decided upon. Two methods were investigated.
4.2.1 Alignment by Beginning/End/Middle
Figure 4.3: Alignment of weights by beginning.
There are 137 more initial weights than final weights recorded for this product, so by the end of the process, the accuracy of the weight loss would only be within
approximately 250 loaves when the inaccuracies in final weight alignment are included. The data line shown is based on a moving average of 25 loaves. This is less than the accuracy of the loaf-alignment, so the small fluctuations in weight loss in the figure are probably not accurate.
Figure 4.4: Alignment of weights by end
It can be seen from Figure 4.3 and Figure 4.4 that changing weights from being lined up at the beginning to being lined up at the end completely changes the resulting weight loss plot. Similarly, when weights were centrally aligned, the weight loss plot changed again. The changes to the weight loss plot indicate that this alignment method is not satisfactory.
4.2.2 Alignment by Extending Final Weights
Another method proposed to align initial and final weights is to extend the final weight data series so that there are the same number of entries in it as the initial weight series. If this is done, then a loaf-by-loaf calculation of weight loss may be performed. It may not be entirely accurate, but should show a marked improvement over alignment by the beginning or end.
There are then only two series to work with - the initial weights for the product and the final weights. It is assumed that these can be resolved from the entire weight series logged from production.
A Microsoft Excel macro “ExtendFinalWeights” has been written that uses linear interpolation to match the final weight series with the initial weight series. Figure 4.5 gives some idea of what this macro does. A plot showing the resulting weight loss is shown in Figure 4.6.
Figure 4.5: Explanation of how linear interpolation approach works. The interpolated values are simply placed on the straight line joining two final weights of an extended final weight
Figure 4.6: Alignment of weights by Linear Interpolation.
The linear interpolation method of lining up weights is the best approach to take without additionally taking into account time. It can give some idea of the variations in weight loss over a product run or from day to day. Fluctuations in the weight loss that only occur for a short period cannot be depended on as being accurate though since there is still an inaccuracy of up to a few hundred loaves in the calculations.
4.2.3 Description of Weight Loss Calculations Macro
Using Visual Basic in Microsoft Excel, a data processing macro was written that calculates weight loss by either beginning alignment or extending the final weights. Its main purpose is for obtaining a quick idea of weight variation within a product run. The file containing the macro is called ‘ProcessWeights.xls’ and is included in the accompanying CD.
The basic concept is that the macro accesses the weight log files and moves them into a new weight summary file. It then searches the data to find the required product, and begins a new file that contains only the information for this product. Here it plots the weights and weight loss. Before running the macro, the user must enter various pieces of information such as the production date, initial and final product numbers and the location of the log files. Operation instructions are included in the macro.
In the future, an adapted version of this macro could be included within the Product Performance Indicator software package to allow operators to quickly and easily view plots of weight loss for various products.
4.3 Loaf By Loaf Calculation of Weight Loss
The ideal method of expressing weight loss would be by calculating it for every separate loaf. In practice, this is very difficult to achieve since it would require the lining up beginning and ending weights exactly. To do this, extremely accurate product following is needed. Approaches to this are discussed in Chapter 6.
Currently, product following techniques are not advanced enough to enable loaf-by-loaf following, however they do offer improvements over the alignment by weight data technique discussed in Section 4.2 above. Currently, using weight data is the best option because of its ease of use.