COMPARISON OF DELAYED CORD CLAMPING
AND UMBILICAL CORD MILKING IN LATE
PRETERM AND TERM INFANTS – AN OPEN LABEL
RANDOMISED CONTROL TRIAL
Dissertation submitted to
THE TAMILNADU
DR.M.G.R. MEDICAL UNIVERSITY
in partial fulfilment of the requirements
for the award of the degree of
D.M. (NEONATOLOGY)
THE TAMILNADU
DR.M.G.R. MEDICAL UNIVERSITY
CHENNAI
CERTIFICATE
This is to certify that the dissertation entitled “COMPARISON OF DELAYED CORD CLAMPING AND UMBILICAL CORD MILKING IN LATE PRETERM AND TERM INFANTS – AN OPEN LABEL RANDOMISED CONTROL TRIAL” is a bonafide
work done by Dr.S.BALAJI under my guidance and supervision during the period between Nov 2013 – Feb 2014 towards the partial fulfilment of requirement for the award of D.M. (Neonatology) degree examination to be held in August 2014 by the Tamilnadu Dr. M.G.R. Medical University, Chennai.
Prof. Dr. J.KUMUTHA, MD., DCH., Prof. M. KANNAKI MD., DCH.,
Prof., and H.O.D. of Neonatology, Director,
Institute of Child Health, Institute of Child Health, Madras Medical College, Madras Medical College,
Chennai. Chennai.
Dr.R.VIMALA.,MD. Dean,
Madras medical college, Government General Hospital,
CERTIFICATE
This is to certify that the dissertation entitled “COMPARISON OF DELAYED CORD CLAMPING AND UMBILICAL CORD MILKING IN LATE PRETERM AND TERM INFANTS – AN OPEN LABEL RANDOMISED CONTROL TRIAL” is a bonafide work done by Dr.S.Balaji., Madras medical college in partial fulfillment of the University rules and regulations for award of DM Neonatology under my guidance and supervision during the academic year 2011 – 2014.
Name & Signature of the Guide:
Prof. Dr. J.Kumutha, MD.,DCH.,
Prof., and H.O.D. of Neonatology, Institute of Child Health,
Madras Medical College, Chennai.
Name & Signature of the Head of Department
Prof. Dr. J.Kumutha, MD.,DCH.,
Prof., and H.O.D. of Neonatology, Institute of Child Health,
Madras Medical College, Chennai.
Name & Signature of the Dean:
Dr.R.Vimala., MD.
DECLARATION
I solemnly declare that this study titled “COMPARISON OF DELAYED CORD CLAMPING AND UMBILICAL CORD MILKING IN LATE PRETERM AND TERM INFANTS – AN OPEN LABEL RANDOMISED CONTROL TRIAL” was my original work in the Department of Neonatology, Madras medical college, Chennai under the guidance and supervision of Prof.J.Kumutha MD.,DCH., Professor & Head of the department, Department of Neonatology, Institute of child health and hospital for Children, Egmore, Chennai. This dissertation is submitted to The Tamilnadu Dr.M.G.R Medical University, Chennai in partial fulfilment of the university requirements for the award of the degree of D.M. Neonatology.
Place: Chennai
ACKNOWLEDGEMENT
It gives me immense pleasure to express my deep sense of gratitude to Prof.J.Kumutha, Prof. and H.O.D. of Neonatology, for her able guidance during the course of the study and in preparation of this dissertation.
I sincerely thank Dr.S.MangalaBharathi, Associate Prof. of Neonatology, for his guidance in designing and carrying out the trial.
I sincerely thank my professors Prof.Dr.RemaChandramohan and Prof.Dr.B.I.Sasirekha for their constant encouragement and support in completing this study.
I express my thanks to Assistant Professors Dr.C.N.Kamalarathnam, Dr.N.MuthuKumaran and Dr. Mohammed Sajidfor their encouragement during the course of study.
Obstetrics & Gynecology, Egmore for permitting me to use all the necessary resources for my study.
I thank Mr. Ezhil Radhakrishnan statistician for this timely work to complete my dissertation.
I thank my fellow postgraduates and juniors and staff nurses for helping me in carry out the study.
CONTENTS
S.NO TITLE PAGE NO.
1. INTRODUCTION 1
2. REVIEW OF LITERATURE 5
3. HYPOTHESIS AND OBJECTIVES 20
4. MATERIALS & METHODS 23
5. OBSERVATION & RESULTS 33
6. DISCUSSION 50
7. CONCLUSION 57
INTRODUCTION
The umbilical cord is the lifeline that connects the placenta to the fetus. It contains umbilical arteries that carry blood from the infant to the placenta and umbilical veins which carry blood from the placenta to the infant.
This additional blood volume transferred from the placenta to the neonate at birth through the umbilical vein is defined as Placental transfusion (Duley et al., 2009)(3). Placental transfusion is affected by three main factors namely uterine contractions following delivery, position of infant following delivery, and timing of umbilical cord clamping (Duley et al., 2009) (3).
Active management of the third stage of labour includes
administration of uterotonic agent, early cord clamping & cutting and
controlled cord traction (Prendiville et al. 2000) (4). It has supplanted the
‘physiological’ approach; as a consequence the umbilical cord is usually
clamped soon after delivery of the neonate.
The placenta contains approximately 100 ml of blood and the mean blood volume of a term infant is about 85 ml/kg. The interval between delivery and clamping of the umbilical cord can significantly affect a newborn’s blood volume and total RBC mass. Early cord clamping reduces the placental transfusion and hence reduces mean blood volume by about 10%.
that delayed clamping benefits preterm and term infants (Van Rheenen et al 2006)(6).
One of the major advantages of delayed cord clamping is increase
in circulating volume and haemoglobin level. Beard et al 2007 and Carlson et al 2009 in their study showed that the benefits of the delayed cord clamping include less respiratory distress and reduced need for later transfusions especially in preterm babies(7,8).
Increasing the hemoglobin level and iron stores are beneficial
because anemia in early infancy is a frequent problem, especially in
developing countries. However these potential benefits need to be
balanced against possible harmful effects in infant (delayed resuscitation,
hypothermia, polycythemia, hyperbilirubinemia and risk of
intraventricular hemorrhage).
An alternative method that could increase the placental transfusion is umbilical cord milking. A recent study by Amit Upadhaya et al demonstrated that umbilical cord milking is safe and it improves the haemoglobin and iron stores at 6 weeks of age when compared to delayed cord clamping (10).
Umbilical cord milking may be considered as an effective alternative to delayed cord clamping for improving the placental transfusion.
However, there are insufficient data about the effect of umbilical cord milking and delayed cord clamping in full-term and late preterm infants.
REVIEW OF LITERATURE
Hemoglobin levels during gestation and first year of life
Iron transport to the fetus occurs mostly during the third trimester of pregnancy (Bradley et al., 2004) (11). Hemoglobin level is higher at birth than at any other period of life and reduces from approximately 17 gm/dl at birth to a low of about 11.2 gm/dl in the first two months of life (Brown, 1988) (12). This stage is referred to as the “physiological anemia of infancy” and is a result of the combined effect of the shorter lifespan of fetal erythrocytes, decreased red blood cell production and a dilution effect from increased blood volume related to growth (Brown, 1988) (12). From 2 months onward, haemoglobin concentration increases slightly and usually reaches about 11.8 gm/dl by four to six months of age (Domellofet al., 2001) (13). Accompanying changes in haemoglobin concentration during the first few months of infancy is a redistribution of total body iron. Estimated amount to of total body iron in newborn is approximately 260 mg. Of which 70% is in the form of hemoglobin, 24% is stored as ferritin and Myoglobin & Iron-containing enzymes constitute remaining 6% (Dallmanet al., 1993) (14).
iron in haemoglobin increases to approximately 76%, and iron in myoglobin and iron-containing enzymes increases to 12% (Dallman et al., 1993) (14).
After 4 to 6 months of age, the breast-fed infant begins to receive exogenous sources of iron such that total body iron increases to approximately 420 mg (Dewey and Chaparro, 2007) (2).
Determinants of birth iron stores
Iron store in a neonate is largely determined by maternal iron status, gestational age of and birth weight of the neonate, (Chaparro, 2008) (15). Several longitudinal studies, including one randomized controlled trial on iron supplementation during pregnancy, have found that maternal anemia during pregnancy is associated with anemia during infancy (de Pee et al., 2002; Kilbride et al., 1999; Preziosi et al., 1997; Colomer et al., 1990) (21-24).
The effect of birth weight on iron stores at birth is more well known. A linear relationship between body iron and birth weight exists such that birth iron stores increase with increasing birth weight (Widdowson and Spray, 1951).
Although gestational age is correlated with the amount of body iron stores at birth, the correlation between birth weight and gestational age may, to a large degree, account for this (Chaparro, 2008)(15). There is an increase in the total amount of iron stores in liver, because of an increase in liver size during the last eight weeks of gestation, which is related to birth size of neonate (Chaparro, 2008) (15).
Depletion of iron stores during first year of life
Low birth weight infants are at a higher risk of iron deficiency during the first six months of infancy because they begin life with lower iron stores and require more iron to sustain their faster rate of post-natal growth (Chaparro, 2008) (15). The high prevalence of anemia in six-to-nine months raises the concern that birth iron stores in some infants are insufficient to sustain growth and development through the first six months of life (Chaparro, 2008) (15).
Consequences of fetal / infant anemia
Iron is a critical nutrient for the normal development of brain (Lozoff and Georgieff, 2006) (17). The structures of the brain can become abnormal due to iron deficiency in uteroor in early postnatal life, as iron is essential for proper neurogenesis and differentiation of certain brain cells and brain regions (Rao et al., 2007; Ward et al., 2007; Rao et al., 2003) (18-20)
In the fetus, red blood cells receive priority for iron over other tissues including the brain (Lozoff and Georgieff, 2006) (17). When iron supply does not meet iron demand, as in the case of iron deficiency, the fetal brain may be at risk of developmental problems (Lozoff and Georgieff, 2006) (17).
Georgieff, 2006) (17). What is particularly alarming regarding iron deficiency during early infancy is the finding that many negative consequences are not reversed following iron therapy (Lozoff and Georgieff, 2006) (17).
The best strategy to prevent and/or reverse adverse effects is to give iron therapy early before iron deficiency manifest (Lozoff and Georgieff, 2006) (17). This highlights the importance of prevention of fetal and infant iron deficiency.
Preventing iron deficiency anemia in infancy.
Umbilical cord clamping
Active management of third stage of labour became part of clinical practice following documentation of its effect in decreasing the risk of maternal postpartum hemorrhage by 50% compared to physiological management (Duleyet al., 2009; Enkinet al., 2000) (26,27).
Recently, however, it has come to light that the beneficial effects of the individual components of active management of labour have not been adequately studied. The effect of decreased risk of post-partum hemorrhage observed following the active management of third stage of labour is almost entirely due to the use of utero tonic drugs and not the result of the three combined interventions as was originally thought. Following this realization, the impact of the timing of umbilical cord clamping has undergone intensive scientific investigation.
Placental transfusion
Distribution of blood between infant and placenta depending on time of cord clamping.
The timing of umbilical cord clamping will affect the amount of blood volume transferred to the infant through placental transfusion. Farrar et al estimated the placental transfusion in term infants by measuring infant weight gain in the first 5 minutes after birth while the cord was left intact at vaginal and cesarean birth. The mean amount of placental transfusion was 81ml (range 50 to 163ml) or 25ml/kg (range 16 to 45ml/kg). The authors estimated that placental transfusion contributed to about 20% of the infant’s blood volume at birth (28).
In one study of harvested placental blood, a residual volume of approximately 15 to 20 ml blood could often be obtained from the umbilical vein itself (30). When the cord is cut immediately, approximately 20ml/kg of infant whole blood and 25mg/kg of iron remains in the placenta and it is routinely discarded as medical waste after birth (31, 32).
During placental transfusion, an additional 15-40 ml/kg birth weight of blood volume is transferred from the placenta to the infant through the umbilical cord. Therefore, waiting to clamp the umbilical cord and allowing placental transfusion to complete can increase a term neonate’s blood volume by approximately 30-50% (Levy and Blickstein, 2006; Dewey and Chaparro, 2007). Approximately 25% of the transfer occurs in the first 15 – 30 seconds after birth, 50-78% of the transfer by one minute and the remaining by three minutes (Yaoet al., 1969) (31).
volume by delaying umbilical cord clamping has many subsequent effects on child Health outcomes.
Effects of delayed cord clamping in term infants
A number of systematic reviews (McDonald et al., 2008, Hutton et al., 2007, Mathew et al., 2007) have examined the risks and benefits of delayed cord clamping in healthy term infants. These have found an increase in hemoglobin concentration and improved iron status up to six months after birth, thus decreasing the risk of early neonatal anemia and iron deficiency (33,34,35,9).
The increase in neonatal blood volume has the potential not only to increase iron stores and haemoglobin concentrations but also to augment jaundice . In a recent Cochrane review, risk between Early cord clamping and delayed cord clamping for the development of jaundice requiring phototherapy was significantly higher in the delayed cord clamping group (34).
Conversely, two separate systematic reviews by Mathew et al and Rabe et al found no significant difference in mean serum bilirubin, development of neonatal jaundice, or requirement for phototherapy between these groups (35,9).
cord clamping, are promising and strengthen the belief that Delayed cord clamping does not increase the risk of hyperbilirubinemia. Apart from this insignificant risk of jaundice and need for phototherapy, Delayed cord clamping has not been shown to affect other neonatal outcomes negatively in term infants. Specifically, there are no differences in Apgar scores at five minutes, rates of NICU admission, or rates of respiratory distress in comparisons of Early cord clamping and delayed cord clamping in healthy term infants (33,34,35,9).
Delayed cord clamping presents a number of clinically relevant benefits, with minimal risk if any. These include decreasing neonatal anemia and iron deficiency, which may have a positive impact on development. These advantages are also present in populations in which iron deficiency has a relatively low prevalence (33). Therefore, a universal approach to delayed cord clamping in the term infant can be justified, given the current available evidence.
Effects of delayed cord clamping in preterm infants.
infants.(9,36-38). Importantly, doing so neither affect their Apgar scores significantly, nor does it increase the risk of other neonatal outcomes such as respiratory distress, jaundice requiring phototherapy, and mortality.(9,36).
The benefits of delayed cord clamping in this population include decreasing the need for and the number of blood transfusions for anemia by increasing blood volume RR 0.72(95% CI 0.54, 0.96) and hematocrit at birth MD 3.04 (2.58, 3.51), decreasing the risk of intraventricular hemorrhage RR0.49 (95% CI-0.32, 0.74) and decreasing the risk of late onset sepsis.(9,36-38).
Current practices of timing of umbilical cord clamping
One recent study attempted to describe current practices of the timing of umbilical cord clamping across Europe (Winter et al., 2007) (39). This study concluded that 66-90% of maternity units in Belgium, France, Italy, the Netherlands, Portugal, Spain, Switzerland, and the UK had policies of clamping and cutting the cord immediately after birth (Winteret al., 2007) (39).
There did not appear to be any demographic determinants of timing of cord clamping and many respondents implied that practice was dictated by institutional policies, independent of their own beliefs (Mercer et al., 2000)(40). The high degree of variability in the timing of cord clamping found in these studies reflects an inadequate scientific knowledge base among obstetric staff.
Attitudes of health professionals towards delayed cord
clamping
A questionnaire-based study published in 2009 attempted to investigate the attitudes of obstetricians towards delayed cord clamping (Ononeze and Hutchon, 2009) (18). They concluded that only 9.3% of obstetricians sampled from hospitals across the British Isles, European countries, USA, Canada, Australia, etc. always adhere to recommendations on delayed umbilical cord clamping (Ononeze and Hutchon, 2009) (41). Reasons for non-adherence include difficulty implementing delayed cord clamping in clinical practice and being unaware of the scientific evidence (Ononeze and Hutchon, 2009) (41).
between one to three minutes, 3.8% clamp after three minutes, and 29.3% clamp after cord pulsations have ceased (Merceret al., 2000) (40).
Effects of Umbilical cord milking
Umbilical cord milking is the another method of increasing the placental transfusion in which cord is milked several times towards the baby from the placenta. It has also shown same beneficial effects as that of the delayed clamping, in which waiting for few minutes is not needed.
The largest body of evidence describing umbilical cord milking comes from studies published in the middle of the 20th century (1940’s-1960’s) using this methodology and reporting styles that do not meet contemporary standards. These studies (Archilei 1960; Colozzi 1954; McCausland 1949; Siddal 1952; Siddal 1953; Whipple 1957) describe consecutive series of primarily full- term, healthy newborns assigned in a non-randomized or quasi-randomized method to immediate cord clamping or cord milking. None of these published studies described any adverse effects from cord milking.
hematocrit at 36-48 hours of life (Erickson et al 2011) (44). Umbilical cord milking is a safe procedure and shows improved Hemoglobin and iron status at 6 weeks of life among term and near term neonates (Amit Upadhayay et al 2013) (10).
Delayed cord clamping versus milking
Rabe et al who compared these two techniques of delayed cord clamping and umbilical cord milking concluded that in preterm infants milking the cord four times achieved a similar amount of placento-fetal blood transfusion compared with delaying clamping the cord for 30 seconds (45). At present there are no studies comparing these two techniques in late preterm and term neonates.
Milking of the umbilical cord may be an alternative strategy for increasing placental transfusion in the preterm baby. In a recent study done by Rabe et al, milking the cord and Delayed cord clamping led to similar results in terms of haemoglobin concentration, need for transfusions, and other secondary outcomes such as intraventricular haemorrhage, sepsis, necrotizing enterocolitis, and death (45).
Justification
recommended by various National and International organisations including World Health Organisation, but it is not practised widely. Difficulty in implementation at field level was the main reason for failure to adopt this recommendation. Obstetricians show reservations in adopting this recommendation.
Another technique which can improve the placental transfusion is milking of the Umbilical cord several times towards the baby and studies has shown the beneficial effects of milking when compared to immediate cord clamping in improving the placental transfusion in both preterm and term infants.
HYPOTHESIS AND OBJECTIVES
Hypothesis:
Milking of the umbilical cord 4 times, towards the baby from the placenta at the time of delivery both in caesarean and vaginal delivery is non inferior than delaying the clamping of umbilical cord at 2 minutes of life in improving the placental transfusion as measured by haemoglobin, hematocrit and serum ferritin without causing significant difference in adverse effects such as the respiratory distress, jaundice requiring phototherapy and Polycythemia, in preterm infants 34 weeks of gestational age and term infants.
Objectives of the Study
Primary Objective: To compare the level of Haemoglobin at 2 months of age in term infants and preterm infants 34 weeks gestation between Delayed cord clamping and Umbilical cord milking.
Secondary Objectives: To compare the following Hemodynamic,
1. Hemodynamic
parameters-a. Heart rate - recorded by the auscultation of precordium for one full minute.
b. Respiratory rate - recorded by clinical observation of movement of chest wall for one full minute.
2. Clinical parameters –
a. Respiratory distress as measured by DOWNES score. b. Polycythemia defined as the venous hematocrit 65%. c. Jaundice requiring phototherapy.
3. Hematological
parameters-a. Hemoglobin measured in venous blood using the cell counter
b. Hematocrit measured in venous blood using the cell counter c. Serum bilirubin level measured by Diazo method.
d. Serum ferritin level measured by Turbidometric method.
OUTCOME:
Primary Outcome:
Secondary Outcome: Assessment of
1. Hemodynamic parameters - Heart rate, Respiratory rate at 30 minutes and at 48 hours of life.
2. Clinical parameters - Respiratory distress at 30 minutes, Polycythemia, and Jaundice requiring phototherapy at 48 hours. 3. Hematological parameters- Hemoglobin, Hematocrit & serum
MATERIALS AND METHODS
Study design:
Open label randomized controlled trial with the non inferiority framework.
Study site:
Study was conducted in Institute of Obstetrics and Gynaecology and Hospital for women and children in Chennai, Tamilnadu.
Study period:
November 2013 to February 2014
Subjects:
All neonates 34 weeks born either by vaginal route or through Lower segment caesarean section were considered eligible for the study.
Inclusion criteria:
Exclusion Criteria:
Mother fetus pair with following characteristics were excluded from the study
Multiple gestation,
Rh negative mother, Baby limp at birth,
Antenatally diagnosed major congenital malformation,
Hydrops fetalis,
Placenta previa,
Placental abruption
Maternal transfusion for anemia.
Sample size:
Methodology
Gestational age assessment
Gestational age was calculated from the first trimester ultrasound dating and if it was not available last menstrual period was used.
Consent and ethical clearance
Informed written consent for the study was obtained from the pregnant mother for enrolment into the study after explaining about the study. They were also provided with the participant information sheet. The study was approved by the institutional Ethical committee (No.21112013).
Randomisation:
Randomisation was done through computer generated random numbers placed in serially numbered opaque envelops. Eligible mothers admitted in the maternity hospital were randomized just before delivery into Group-1 (Delayed clamping group) or Group-2 (Umbilical cord milking group).
Interventions:
Delayed cord clamping:
cut 2-3 cm distance from the umbilical stump at 2 minutes of life. The timing of delayed clamping at 2 minutes was measured by a stop clock. Umbilical cord milking:
Delayed cord clamping procedure
According to our local protocol, after delivery, intramuscular oxytocin was given to vaginally delivered mother and intravenous oxytocin was given to mother who was delivered through caesarean section. All neonates were managed as per our unit protocol.
Measurement of outcomes:
The following parameters were recorded after intervention
At birth respiratory distress was assessed using DOWNES score. Neonates with DOWNES score of 2 were admitted in the newborn nursery for further management.
At 30 minutes of life, heart rate was recorded by the auscultation of precordium, respiratory rate was recorded by observation of chest wall movement over one full minute.
At 48 hours of life again heart rate and respiratory rate were recorded. One ml of venous sample was obtained from the baby for estimation of haemoglobin and hematocrit using Sysmex KX 21 cell counter and serum bilirubin level was assessed by Diazo method using ROBONIK semianalyzer.
All the study neonates were daily assessed for clinical jaundice till discharge and serum bilirubin was measured if clinical assessment of jaundice was significant. Babies were treated with phototherapy if the serum bilirubin levels were in phototherapy range. Peak serum bilirubin was measured.
Babies were discharged home as per our hospital protocol and they were followed up at secondary end point which was at 2 months of age.
Serum bilirubin estimation semi analyser
Serum ferritin kit
Data collection:
Baseline parental data and neonatal data were recorded in the data collection sheet. Post intervention clinical, hematological and hemodynamic parameters were recorded in the data collection form. All the data were uploaded into the excel sheet (Microsoft excel 2008) at regular intervals. Infants were followed up till 2 months of age. No medicinal iron was given to any of these infants till the end of the study.
Statistical analysis:
Standard statistical tests were employed. Categorical variables were analysed with chi square test and continuous variables were analysed using student’s independent t test. Results on continuous
measurements were presented as Mean SD and results on categorical
RESULTS AND ANALYSIS
A total of 457 mothers were admitted for delivery during the study period. Of which 155 mothers were eligible for the study. Three hundred and five mothers were not eligible for reasons like Preterm delivery less than 34 weeks (65), Home distance more than 20 km radius (74) and trained persons not available for intervention (163 ).
Out of 155 eligible mothers 52 mothers were excluded. The reasons for exclusion were refusal of consent (38) ,Multiple gestation (2), Rh negative mother (6), Placenta previa (2), Abruptio placenta (1) and Mother received transfusion for anemia (3).
Totally 103 three mothers were enrolled and they were randomized to Delayed cord clamping group (n=52) and Umbilical cord milking group (n=51). Of 103 mothers enrolled, interventions were given only for 96 neonates.
Flow diagram of study
Fig: 1
Total no. of deliveries during the study period (n=457)
Eligible mothers (155) Gestational age 34 weeks.
Living within 20 km radius of hospital. Trained person available for intervention
Excluded (52) Refusal of consent 38 Multiple gestation 2 Rh negative mother 6 Placenta previa 2 Abruption placenta 1 Maternal transfusion
for anemia 3
Enrolled (n=103)
Randomized (n=103)
Allocated to Delayed cord clamping group (n=52)
Allocated to Umbilical cord milking group (n=51)
Limp at birth (n=3)
Limp at birth (n=4)
Intervention done (n=47) Intervention done (n=49)
Lost to follow up ( n=7) Lost to follow up (n=6)
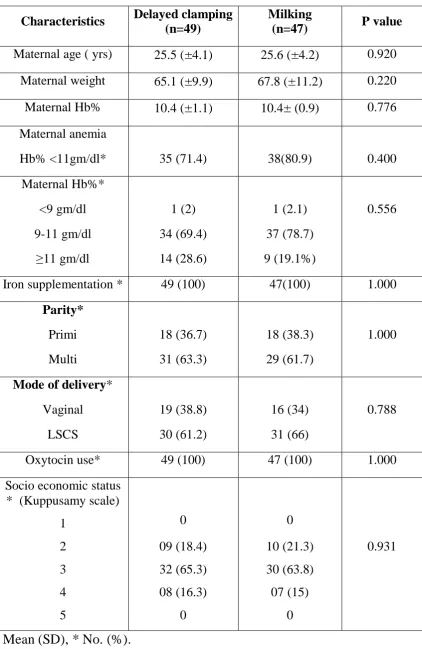
Table : 1 - Baseline maternal characteristics
Characteristics Delayed clamping (n=49)
Milking
(n=47) P value
Maternal age ( yrs) 25.5 (±4.1) 25.6 (±4.2) 0.920 Maternal weight 65.1 (±9.9) 67.8 (±11.2) 0.220 Maternal Hb% 10.4 (±1.1) 10.4± (0.9) 0.776 Maternal anemia
Hb% <11gm/dl* 35 (71.4) 38(80.9) 0.400
Maternal Hb%* <9 gm/dl 9-11 gm/dl 1 (2) 34 (69.4) 1 (2.1) 37 (78.7) 0.556
11 gm/dl 14 (28.6) 9 (19.1%)
Iron supplementation * 49 (100) 47(100) 1.000
Parity*
Primi 18 (36.7) 18 (38.3) 1.000
Multi 31 (63.3) 29 (61.7)
Mode of delivery*
Vaginal 19 (38.8) 16 (34) 0.788
LSCS 30 (61.2) 31 (66)
Oxytocin use* 49 (100) 47 (100) 1.000
Socio economic status * (Kuppusamy scale)
1 0 0
2 09 (18.4) 10 (21.3) 0.931
3 32 (65.3) 30 (63.8)
4 5 08 (16.3) 0 07 (15) 0
Baseline maternal characteristics like age, weight, haemoglobin level, anemic status, parity, antenatal iron supplementation, mode of delivery and socioeconomic status were comparable between the two groups (Table-1)
Baseline maternal characteristics:
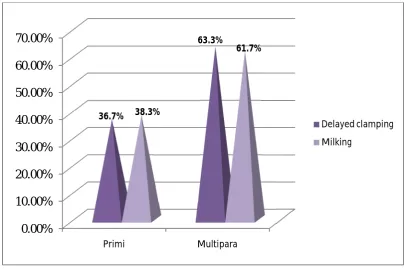
Distribution of Parity
[image:51.595.105.512.399.668.2]There were no significant difference in number of babies born to Primi mothers and Multiparous mothers between the Delayed Clamping group and Milking group (p value 1.000).
Fig 2: Parity of the mother in both the groups.
0.00% 10.00% 20.00% 30.00% 40.00% 50.00% 60.00% 70.00%
Primi Multipara
36.7%
63.3%
38.3%
61.7%
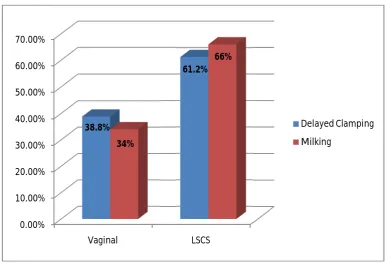
Mode of delivery
[image:52.595.115.501.364.628.2]Most of the neonates included in the study were born through lower segment caesarean section (61.2% in Delayed clamping group and 66% in Milking group). 38.8% of neonates in delayed clamping group and 34% of neonates in milking group were delivered by vaginal route. There was no significant difference in mode of delivery between the two groups (P value 0.788).
Fig 3: Mode of delivery of neonates in both the groups 0.00%
10.00% 20.00% 30.00% 40.00% 50.00% 60.00% 70.00%
Vaginal LSCS
38.8%
61.2%
34%
66%
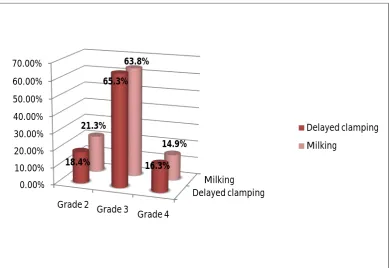
Socio Economic status of parents
[image:53.595.114.504.366.634.2]Most of the mothers in this cohort were under grade 3 socio economic status (Kuppusamy scale). 65.3% of mothers in delayed clamping group and 63.8% of mothers milking group were belong to grade 3 socio economic status. Mothers in all the classes of socio economic status in both delayed clamping and milking were comparable and P value (0.931) was statistically not significant.
Fig 4: Socio economic status of parents in both the groups Delayed clamping
Milking 0.00%
10.00% 20.00% 30.00% 40.00% 50.00% 60.00% 70.00%
Grade 2 Grade 3 Grade 4
18.4%
65.3%
16.3% 21.3%
63.8%
14.9%
Table: 2 - Baseline Neonatal characteristics
Characteristics Delayed clamping (n=49)
Milking
(n=47) P value
Birth weight (grams)
3058.4 (±483.5) 2951.3 (±497.5) 0.288
Sex - Male * 23 (47) 24(51) 0.842
Gestation age in weeks
38.7 (±1.5) 38.5 (±1.5) 0.458
Gestation age *
37-42 weeks 42 (±85.7) 40 (±85.1) 1.000
34-37 weeks 7 (±14.3) 7 (±14.9) Growth status *
AGA 45(±91.8) 44 (±93.6) 1.000
SGA LGA
4 (±8.2) 0
3 (±6.4) 0 Mean (SD), *No. (%).
Gestational age of neonates
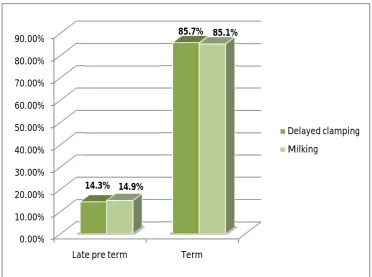
[image:55.595.122.495.262.539.2]Most of the neonates in this study were term neonates (42 were in Delayed clamping group and 40 neonates were in Milking group). Preterm neonates with gestational age 34 weeks were seven neonates in each group. Both the groups were comparable.
Fig 5: Gestational age in both the groups 0.00%
10.00% 20.00% 30.00% 40.00% 50.00% 60.00% 70.00% 80.00% 90.00%
Late pre term Term
14.3%
85.7%
14.9%
85.1%
Growth status of neonates
[image:56.595.127.492.316.575.2]In Delayed cord clamping group, AGA and SGA neonates were 91.8% and 8.2% respectively and in milking group, AGA and SGA neonates were 93.6% and 6.4% respectively. Both the groups were comparable with P Value of 1.000. There were no LGA neonates in both the groups.
Fig 6: Growth status in both the groups delayed clamping
Milking 0.00%
10.00% 20.00% 30.00% 40.00% 50.00% 60.00% 70.00% 80.00% 90.00% 100.00%
AGA SGA
91.8%
8.2% 93.6%
6.4%
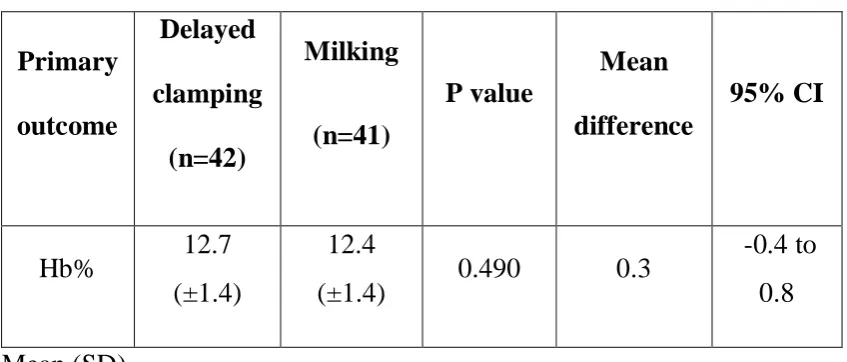
Primary outcome
Table : 3 - Haemoglobin level at 2 months of age in both groups.
Primary outcome
Delayed clamping
(n=42)
Milking
(n=41)
P value
Mean difference
95% CI
Hb% 12.7
(±1.4)
12.4
(±1.4) 0.490 0.3
-0.4 to 0.8
Mean (SD)
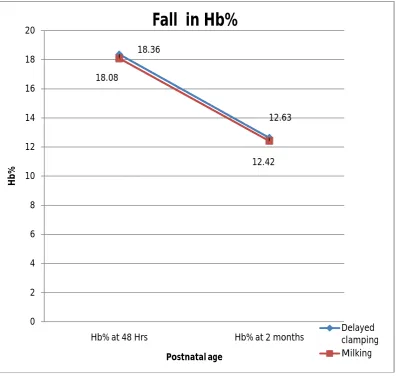
Fig 7: Haemoglobin level in two groups at 48 hours and 2 months
Post natal fall in haemoglobin level from 48 hours to 2 months of age in delayed cord clamping and umbilical cord milking groups were comparable as depicted in figure 7.
18.36
12.63 18.08
12.42
0 2 4 6 8 10 12 14 16 18 20
Hb% at 48 Hrs Hb% at 2 months
Hb%
Postnatal age
Fall in Hb%
Sub group analysis for primary outcome
Table : 4 - Hemoglobin level at 2 months
Gestational age Delayed cord clamping (n=42) Umbilical cord milking (n=41)
P value 95% CI
Late preterm 12.5(±1.5) 12.7 (±0.4) 0.825 -1.77 to 1.45 Term 12.6 (±1.4) 12.4 (±1.5) 0.437 -0.41 to 0.94 Mean (SD)
In late preterm and term neonates there was no significant difference in Mean haemoglobin level at 2 months between the two groups as shown in table.4
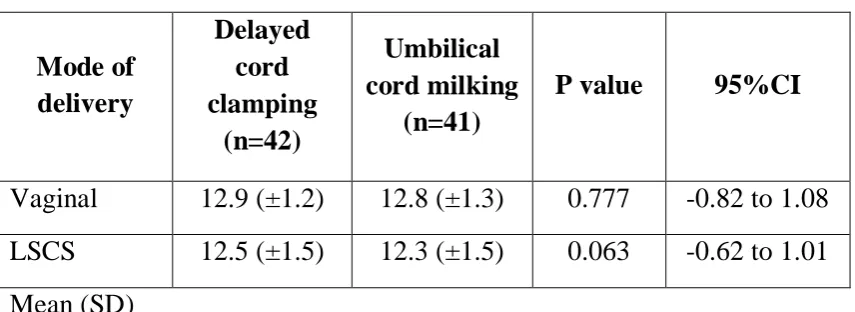
Table : 5 - Mean Hemoglobin level at 2 months
Mode of delivery Delayed cord clamping (n=42) Umbilical cord milking (n=41)
P value 95%CI
Vaginal 12.9 (±1.2) 12.8 (±1.3) 0.777 -0.82 to 1.08 LSCS 12.5 (±1.5) 12.3 (±1.5) 0.063 -0.62 to 1.01 Mean (SD)
[image:59.595.96.524.453.609.2]Secondary outcome
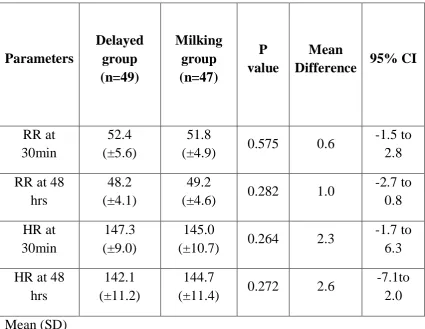
Table : 6 - Hemodynamic parameters within 48 hours
Parameters Delayed group (n=49) Milking group (n=47) P value Mean
Difference 95% CI
RR at 30min
52.4 (±5.6)
51.8
(±4.9) 0.575 0.6
-1.5 to 2.8 RR at 48
hrs
48.2 (±4.1)
49.2
(±4.6) 0.282 1.0
-2.7 to 0.8 HR at 30min 147.3 (±9.0) 145.0
(±10.7) 0.264 2.3
-1.7 to 6.3 HR at 48
hrs
142.1 (±11.2)
144.7
(±11.4) 0.272 2.6
-7.1to 2.0 Mean (SD)
Table : 7 - Clinical parameters within 48 hours of life
Parameters Delayed group (n=49)
Milking group
(n=47) P value
Respiratory distress
at birth* 3(6.1%) 2(4.3%)
Need for
Phototherapy* 5(10.2%) 5(10.6%) 1.000
Polycythemia* 0 0
*no(%)
Regarding clinical parameters like number of neonates required admission for respiratory distress and significant jaundice requiring phototherapy, there was no significant difference between the two groups. Approximately 10% of the neonates in Delayed clamping group and Milking group required phototherapy for hyperbilirubinemia. No polycythemia was detected in either group.
[image:61.595.106.516.522.774.2]0.00% 10.00% 20.00% 30.00% 40.00% 50.00% 60.00% 70.00% 80.00% 90.00% 10.2%10.6% 89.8%89.4% Phototherpy No Phototherpy 0.00% 10.00% 20.00% 30.00% 40.00% 50.00% 60.00% 70.00% 80.00% 90.00% 100.00% 6.1%4.3% 93.9% 95.7% Respiratory distress No Respiratory distress
Fig 9 :Respiratory distress at birth
Table : 8 - Peak Bilirubin (Among the babies admitted for phototherapy)
Delayed cord clamping (n=5)
Umbilical cord
milking (n=5) P value Peak Bilirubin in
mg% 16.2 (±0.8) 16.1 (±0.6) 0.735
Mean (SD)
[image:62.595.95.525.104.234.2]Among the neonates who was underwent phototherapy, there was no significant difference in peak mean serum bilirubin levels between the two groups.
Table : 9 - Hematological parameters at 48 hours of life
Delayed group (n=49) Milking group (n=47) P value Mean
Difference 95% CI
Hb % at
48hrs 18.4(±1.6) 18.9(±1.7) 0.404 0.5 -0.4 to 0.9 Hct at
48hrs 53.2(±4.5) 52.8(±4.8) 0.731 0.4 -1.6 to 2.2 SBR
at 48 hrs
8.9(±3.6) 8.8(±4.3) 0.881 0.1 -1.5 to 1.7
Mean (SD)
[image:62.595.95.523.381.623.2]Table : 10 - Hematological parameters at 2 months of life Parameters Delayed group (n=49) Milking group (n=47) P value Mean
Difference 95% CI
Hematocrit 37.2(±4.5) 36.7(±4.6) 0.662 0.4 -1.6 to 2.4
S.Ferritin 264.3(±86.1) 262.7(±90.1) 0.932 1.6 -36.8 to 40.1 Mean (SD)
At two months of age, there were no significant differences in mean hematocrit and Serum ferritin level between the two groups. The 95% confidence interval (CI) for Serum ferritin level was -36.8 µgm/L to 40.1 µgm/L. The 95% CI for hematocrit was -1.6 to 2.4% .
Table : 11 - Breast feeding and iron supplementation till 2 months of age. Delayed clamping (n=42) Milking (n=41) P value Exclusive breast feeding *
36 (85.7) 36 (87.8) 1.000
Iron
supplementation *
0 0
*No. (%)
Table : 12 - Morbidities between the two groups
Delayed clamping (n=42)
Milking (n=41)
Need for transfusion* 0 0
Post discharge
hospitalisation* 0 0
DISCUSSION
Our study has showed that, milking the extra amount of placental blood, achieved haemoglobin level within the non inferiority margin of 1 gm/dl when compared to delayed cord clamping at 2 minutes in late preterm and term infants which implies that milking is non inferior to delayed cord clamping in achieving the haemoglobin level.
In a study by Gupta and Ramji in 2002, haemoglobin at 3 months of life was significantly higher in delayed cord clamping group (9.9gm/dl) when compared to immediate cord clamping group (8.8gm/dl).
In 2013 Amit Upadhyay et al had showed that mean hemoglobin at 6 weeks was higher in the milking group (11.9 gm/dl) compared to immediate cord clamping group (10.8gm/dl).
In our study, neonates allocated to milking group (12.4 gm/dl) had similar haemoglobin values at 2 months compared with delayed clamping group (12.7 gm/dl), indicating a similar amount of placental blood transfer in both groups. This is relationship might indicate that the procedure of milking four times guarantees the transfer of same amount of placental blood into the neonate when compared to delayed clamping.
to use the precise measure of placental transfusion rather than measuring the haemoglobin and hematocrit after birth. However, the available method of biotin labelling of red blood cells is time-consuming and difficult to perform on a large number of neonates.
Hosono et al 2008 showed that hemoglobin value at birth in extreme preterm was significantly higher in the milking group (16.5 gm/l) when compared to immediate clamping group (14.1 gm/dl).
In a study by Cernadas et al 2006, the immediate cord clamping group showed significantly lower infant haemoglobin level (17.8 gm/dl) at 24 hours after birth than the delayed clamping group (19.4gm/dl) with mean difference -1.34 g/ dl.
In 2013, Amit Upadhyay et al had showed that at 48 hours of age milking group (11.9gm/dl) had higher haemoglobin level when compared to immediate clamping group (10.8 gm/dl).
placental transfusion when compared with them where baby received only the blood remaining in 20 cms of cut cord and there was no connectivity with the placenta (Umbilical cord was cut from the placenta and then milked towards the baby). Intactness of the umbilical cord with the placenta till the end of milking adopted in our study, 100% of antenatal iron supplementation and lesser percentage of maternal anemia in our study would have been the reasons for higher mean haemoglobin value in our study.
Our results show that milking the cord four times may be adequate and produced comparable haemoglobin levels both at 48 hrs and at 2 months with two minutes of delayed cord clamping. The inclusion of another control group of neonates randomized to immediate cord clamping would have been useful but was felt superfluous because already several studies had established the beneficial effects of delayed cord clamping.
Rabe et al placed the newborns 20 cm below the level of mother, which could lead to a gravity-dependent flow of blood from mother to baby. To avoid this, we kept the neonates at the level of uterus in both the groups.
weight babies led to similar amount of placento-fetal blood transfusion compared with delayed cord clamping.
We adopted the same milking technique used by Rabe et al (45). Amit Upadhayay et al also used the same speed 10cm/sec for umbilical cord milking but they milked it three times only. However, Amit Upadhyay et al and Tarnow- Mordi et al did the milking after clamping and cutting the umbilical cord.
With regarding to need for phototherapy, five trials (1762 infants) (Emhamed 2004; McDonald 1996; Nelson 1980; Oxford Midwives 1991; van Rheenen 2007) had showed significantly fewer infants in the immediate cord clamping group requiring phototherapy for jaundice than in the delayed cord clamping group (RR 0.59, 95% CI 0.38 to 0.92). This equates to 3% of infants in the early clamping group and 5% in the late clamping group, a risk difference of 2% (95% CI -0.04 to 0.00).
In our study about 10% of neonates in each group had significant hyperbilirubinemia requiring phototherapy which was higher than those found in previous studies and in study by Amit upadhayay et al, in which none of the neonates had significant hyperbilirubinemia requiring phototherapy.
the neonates had polycythemia. Three other trials (Cernadas 2006; Emhamed 2004; Van Rheenen 2007) also showed that there was no difference in polycythemia between the immediate and delayed cord clamping groups.
In one trial of 107 infants (Geethanath 1997), infant ferritin levels were significantly higher in the delayed clamping group (73.6 µg/L) compared with immediate clamping group (55.7µg/L) with mean difference of 17.90 µg/L at three months.
At four months, Andersson et al showed a 45% improvement in serum ferritin level between the delayed clamping group and immediate cord clamping group (Ferritin level in delayed clamping group-117µg/L and immediate cord clamping group - 81µg/L)
At six months, Ferritin levels were significantly higher in the late clamping group compared with early clamping (mean difference of 11.80 ug/L, Chaparro 2006).
Serum ferritin at 6 weeks was significantly higher in milking group (355.9µg/L) than in immediate clamping group (177.5 µg/L) (Amit Upadhayay et al 2013)
(264.3µg/L) and milking group (262.7µg/L) with mean difference of 1.6 µg/L.
Serum ferritin level achieved at 6 weeks in the milking group of Amit Upadhayay et al 2013 was higher when compared to our milking group (value 355.9 µg/L versus 262.7 µg/L). Though our serum ferritin value was less when compared to this study but definitely much higher than the immediately clamping group of Amit Upadhayay et al.
Regarding neonates admitted for respiratory distress, our study had reported relatively higher percentage (6.3% in delayed clamping group and 4.1% in milking group) when compared to Amit upadhayay et al, in which none of the neonates were hospitalised for respiratory distress at birth. This was probably because of more placental blood transfused to the neonates in our cohort as demonstrated by higher haemoglobin value at 48 hours.
The strengths of our study were:
The main strength of our study is that it is a randomized control trial with appropriate sample size.
The technique of umbilical cord milking was standardized by meticulous demonstrations to all doctors on duty.
In our study all the clinically important side effects of increased placental transfusion have been reported.
The limitations of our study were:
We did not measure circulating blood volume because it was not feasible in our set up. The available method was beyond the scope of our infrastructure.
We measured the serum bilirubin level only at 48 hours to avoid frequent blood samplings.
Since the randomisation was done before delivery, post randomisation exclusion was unavoidable but it was only a minor percentage. (5.7% in delayed clamping group and 7.8% in milking group)
CONCLUSION
1. Umbilical cord milking is as effective as delaying the umbilical cord clamping in achieving higher haemoglobin levels at two months of age in late preterm and term infants delivered both by caesarean section and vaginal route.
2. Umbilical cord milking and delayed cord clamping resulted in comparable levels of haemoglobin and hematocrit at 48 hours of life implying that similar amount of placental transfusion occurs in both the groups.
3. Milking the umbilical cord resulted in similar iron stores when compared to that of the delayed cord clamping.
4. Umbilical cord milking does not produce significant hemodynamic disturbances.
Implication for practice
Umbilical cord milking may be safely instituted in situations where delayed umbilical cord clamping is practically difficult to perform delayed cord clamping in late preterm and term infants.
Implication for further research
1. Further studies with longer follow-up till 6-12 months are desirable to establish whether the initial advantage in haemoglobin and ferritin is sustained later in infancy.
BIBLIOGRAPHY
1. Yao AC, Lind J. Blood flow in the umbilical vessels during the third stage of labour. Biology of the Neonate. 1974;25:186-193.
2. Dewey KG, Chaparro CM. Session 4: Mineral metabolism and body composition iron status of breast-fed infants. The
Proceedings of the Nutrition Society. 2007;66(3):412-422.
3. Duley LMM, Weeks AD, Hey EN, Drife JO. Clamping of the umbilical cord and placental transfusion. Royal College of Obstetricians and Gynaecologists. 2009.
4. Prendiville WJP, Elbourne D, McDonald SJ. Active versus
expectant management in the third stage of labour [Cochrane
review]. Chichester: The Cochrane Library; 2000.
5. Management of the third stage of labour to prevent post-partum
haemorrhage (joint statement). The Hague and London:
International Confederation of Midwives and International
Federation of Gynaecology and Obstetrics; 2003.
6. Van Rheenen PF, Brabin BJ. A practical approach to timing cord clamping in resource poor settings. BMJ 2006; 333: 954-8 doi:10.1136/bmj.39002.389236.BE pmid: 17082547.
7. BeardJ.Recent evidence from human and animal studies regarding iron status and infant development. J Nutr2007;137:524-30S.
9. Mathew JL. Timing of umbilical cord clamping in term and preterm deliveries and infant and maternal outcomes: a systematic review of randomized controlled trials. Indian Pediatr 2011.
10. Amit Upadhayay et al. American journal of Obst. & Gynac. february 2013.
11. Bradley J, Leibold E A, Harris Z L, Wobken J D, Clarke S, Zumbrennen K B et al. Influence of gestational age and fetal iron status on IRP activity and iron transporter protein expression in third-trimester human placenta. American Journal of Physiology
Regulatory, Integrative and Comparative Physiology. 2004;
287(4):R894-R901.
12. Brown MS. Physiologic anemia of infancy: Normal red-cell values and physiology of neonatal erythropoiesis. In: JA Stockman III, (ed). Developmental and Neonatal Hematology. New York: Raven Press. 1988. pages 249-273.
13. Domellof MD, Cohen RJ, Dewey KG, Hernell O, Rivera LL, Lonnerdal B. Iron supplementation of breast-fed Honduran and Swedish infants from 4 to 9 months of age. Journal of Pediatrics. 2001;138(5):679-687.
14. Dallman PR, Yip R, Oski FA. Iron deficiency and related nutritional anemias. In: Orkin S, Nathan D, Ginsburg D, Look A, Fisher D, Lux S, (eds). Hematology of Infancy and Childhood. Philadelphia: W.B. Saunders and Company. 1993.
16. Oski F A, Landaw S A. Inhibition of iron absorption from human milk by baby food. American Journal of Diseases of Children. 1980;134(5):459-460.
17. Lozoff B, Beard J, Connor J, Barbara F, Georgieff M, Schallert T. Long-lasting neural and behavioral effects of iron deficiency in infancy. Nutritional Review. 2006;64:S34-S43.
18. Rao R, Tkac I, Townsend EL, Ennis K, Gruetter R, Georgieff MK. Perinatal iron deficiency predisposes the developing rat hippocampus to greater injury from milk to moderate hypoxia-ischemia. Journal of Cerebral Blood Flow Metabolism. 2007;27(4):729-740.
19. Ward KL, Tkac I, Jing Y, Felt B, Beard J, Connor J et al.
Gestational and lactational iron deficiency alters the developing striatal metabolome and associated behaviors in young rats.
Journal of Nutrition. 2007;137:1043-1049.
20. Rao R, Tkac I, Townsend EL, Gruetter R, Georgieff MK. Perinatal iron deficiency alters the neurochemical profile of the developing rat hippocampus. Journal of Nutrition. 2003;133:3215-3221.
21. De Pee S, Bloem MW, Sari M, Kiess L, Yip R, Kosen S. The high prevalence of low hemoglobin concentration among Indonesian infants aged 3-5 months is related to maternal anemia. Journal of
Nutrition. 2002;132:2215-2221.
iron-deficiency anemia in infancy: a case-control study in Jordan.
International Journal of Epidemiology. 1999;28:461-468.
23. Preziosi P, Prual A, Galan P, Daouda H, Boureima H, Hercberg S. Effect of iron supplementation on the iron status of pregnant women: consequences for newborns. American Journal of Clinical
Nutrition. 1997;66:1178-1182.
24. Colomer J, Colomer C, Gutierrez D, Jubert A, Nolasco A, Donat J
et al. Anaemia during pregnancy as a risk factor for infant iron
deficiency: Report from the Valencia Infant Anaemia Cohort (VIAC) study. Paediatric and Perinatal Epidemiology. 1990;4(2):196-204.
25. Stoltzfus R J. Research needed to strengthen science and programs for the control of iron deficiency and its consequences in young children.Journal of Nutrition. 2008;138(12):2542-2546.
26. Duley LMM, Weeks AD, Hey EN, Drife JO. Clamping of the umbilical cord and placental transfusion. Royal College of Obstetricians and Gynaecologists. 2009.
27. Enkin M, Keirse M, Neilson J, Crowther C, Duley L, Hodnett E et al. A guide to effective care in pregnancy and childbirth. 3rd ed. Oxford: Oxford University Press. 2000.
29. Narendra AB, Beckett C, Aitchison T, Kyle E, Coutts J, Turner T, et al. Is it possible to promote placental transfusion (PTFx) at preterm delivery? Abstract 213. Pediatr Res 1998;44:454.
30. Brune T, Garritsen H, Witteler R, Schlake A, Wu¨llenweber J, Louwen F, et al. Autologous placental blood transfusion for the therapy of anaemic neonates. Bio Neonate 2002.
31. Yao ac, moinian m, distribution of blood between infant and placenta after birth. Lancet 1969.
32. Dewey KG, Chaparro CM, mineral metabolism and body composition. P Nutri soc 2007.
33. Andersson O, Hellstrom Westas L, AnderssonD, Domellof M. Effect of delayed versus early umbilical cord clamping on neonatal outcomes and iron status at 4 months :a randomized controlled trial. BMJ.2011.
34. Effect of timing of umbilical cord clamping of term infants on maternal and neonatal outcomes. J McDonald, Philippa Middleton et al. Cochrane review 2008.
35. Hutton EK, Hassan ES. Late vs early clamping of the umbilical cord in full-term neonates: systematic review and meta-analysis of controlled trials. JAMA 2007.
37. Rabe H, Reynolds G, Diaz-Rossello J. A systematic review and metaanalysis of a brief delay in clamping the umbilical cord of preterm infants. Neonatology 2008;93:138–44.
38. Mercer JS, Vohr BR, McGrath MM, Padbury JF, Wallach M, Oh W. Delayed cord clamping in very preterm infants reduces the incidence of intraventricular hemorrhage and late-onset sepsis: a randomized, controlled trial. Pediatrics 2006;117:1235–4.
39. Winter C, Macfarlane A, Deneux-Tharaux C, Zhang WH, Alexander S, Brocklehurst P et al. Variations in policies for management of the third stage of labour and the immediate management of postpartum haemorrhage in Europe. British
Journal of Obstetrics and Gynaecology. 2007;114(7):845-854.
40. Mercer JS, Nelson CC, Skovgaard RL. Umbilical cord clamping: beliefs and practices of American nurse-midwives. Journal of
Midwifery & Women's Health. 2000;45(1):58-66.
41. OOnnoonneezzee eett aall.. Attitude of obstetritian towards DCC. Questionnaire based study Ononeze et al, J. obstet. Gynac 2009.
42. Hosono S, Mugishima H, Fujita H, et al. Blood pressure and urine output during the first 120 hours of life in infants born at less than 29 weeks gestation related to umbilical cord milking. Arch Dis Child fetal and neonatal ed. 2009; 94:F328–31. [PubMed: 19221402].
adaptation in infants born at less than 29 weeks gestation: a randomized controlled trial. Arch Dis Child Fetal neonatal ed. 2008.
44. Erickson, Owen, Mercer et al. Umbilicalcord milking in term infants delivered by cesarean section. J perinatology November 2011.
ANNEXURE - 1
Parameters 0 1 2
RR Per min. <60 60-80 >80
Cyanosis Absent In room air In 40% oxygen
Grunt
Absent Audiable with stethscope
Audible with naked ear Retraction
Absent Mild
Moderate-severe Air entry
Good Diminished Barely audible
ANNEXURE -2
ANNEXURE – 3
PARENT DATA COLLECTION FORM
Mother’s name : Father’s name :
Age : Age :
Educational status : Educational status :
Job : Job :
Income : Income :
Address : Phone no. :
Home Distance in km :
Mother blood group and typing : No. of antenatal visits :
Prepregnant weight :
Present weight :
Weight gain :
Intervention group : Delayed clamping / Milking
LMP :
EDD :
Scan EDD [first trimester] :
Gestation age :
Antenatal iron supplementation :
Hemoglobin % :
Use of oxytocin : Yes / No
ANNEXURE – 4
NEONATAL DATA COLLECTION FORM
Name : DOB:
Sex : TOB:
Disc no. :
Birth weight in grams :
Gestation age :
Mode of delivery : Vaginal / LSCS Intervention group : DCC / UCM Hemodynamic parameters
Parameters At 30 minutes 48 hours
Heart rate
Respiratory rate Clinical parameters
Parameter At birth Till discharge
Respiratory distress Jaundice requiring photot herapy
Yes/No. if yes duration of phototherapy... Hematological parameters
Parameters 48 hours 2 months
Hemoglobin Hematocrit S. Bilirubin S. Ferritin
Peak bilirubin level :
Sl.
no R. no. Name Sex Group Birth weight Gest. Age Gestati on Gest. Age Mode of Delivery Parity index Mat Age Mat. age Mat. weight Mat. height Mat. Hb% Mat. Hb Mat. Anemi a Mat. Hb% Iron supplement ation socioecono mic status Oxyto cin use Respirat ory rate at 30 min
respirato ry rate at 48 hours Heart rate at 30 min heart rate at 48 hours Hb% at 48 hrs Polycyt hemia Hct at 48 hrs S.Biliru bin at 48 hrs Peak Bilirub in Hb% at 2 mon Hct at 2 mon S.Ferrit in at 2 mon Exclusive breast feeding at 2 months Admitted for photother apy Admitted for Respirato ry Distress Alive or death
1 1 Saradha 1 2 3200 38.4 1 2 2 2 35 2 60 150 2 10.3 1 2 1 2 1 55 44 148 120 18.2 2 54.8 9.6 12.8 37 126.77 1 2 2 1
2 2 Megala 2 2 2850 37.2 1 2 2 2 29 2 66 152 2 9.2 1 2 1 3 1 50 42 140 139 19.7 2 56.8 10.3 11.4 34 277.55 2 2 2 1
3 3 Priya 2 1 3800 38.5 1 2 2 2 25 2 47 151 3 11.5 2 2 1 2 1 43 41 146 158 19.6 2 56 5.3 12 35 264.31 1 2 2 1
4 4 Kavitha 1 2 1440 35.4 2 1 2 2 26 2 70 156 2 10.2 1 2 1 3 1 44 45 155 130 18.2 2 56 8.9 13 39 363.33 1 2 2 1
5 5 Padmavathi 1 2 3200 38.5 1 2 2 2 27 2 81 160 2 10.5 1 2 1 3 1 66 47 154 149 18 2 54 10 2 1 1
6 6 Bhavani 1 2 3000 38.5 1 2 2 2 24 2 85 161 2 9.4 1 2 1 4 1 44 49 148 129 20.5 2 56 15.9 15.9 11.4 34 383.56 1 1 2 1
7 7 Nathiya 1 1 2500 36.6 1 1 2 1 26 2 55 158 2 9.5 1 2 1 2 1 67 51 146 138 20 2 50 9 13 39 328.81 2 2 1 1
8 8 Gunasekari 2 2 2000 36.1 1 1 2 1 36 2 84 159 2 9 1 2 1 3 1 52 52 144 147 18.4 2 51.7 2.2 12.4 36 322.45 1 2 2 1
9 9 Veeraselvi 2 1 3850 39.6 1 2 2 2 22 2 78 154 3 11 2 2 1 3 1 51 54 154 156 15.3 2 45.9 8.4 11.6 33 123.63 2 2 2 1
10 10 Devi 1 1 2750 39.4 1 2 2 2 25 2 56 151 3 12.6 2 2 1 3 1 58 47 158 149 16.6 2 48.9 7.3 10.9 32 253.22 1 2 2 1
11 11 Uma maheshwari 1 2 3440 39.5 1 2 2 1 28 2 65 144 2 9.4 1 2 1 2 1 42 58 152 138 17 2 51.2 7 12 36 267.21 2 2 2 1
12 13 Usharani 1 1 2510 39 1 2 2 2 29 2 54 152 2 10.8 1 2 1 3 1 50 45 150 127 16 2 48.4 3.6 10 28 209.12 1 2 2 1
13 14 Koteeshwari 2 1 2400 39.5 2 2 2 2 29 2 64 144 2 9.4 1 2 1 4 1 51 44 159 129 22.6 2 60.2 16.8 17.2 1 2 1
14 15 Lakshmi 2 1 3315 38.6 1 2 2 2 28 2 70 156 2 10.5 1 2 1 3 1 70 43 145 138 18.9 2 51.5 1.6 13.1 40.2 357.74 1 2 1 1
15 16 Nathiya 2 2 2800 36.3 1 1 1 2 24 2 60 144 2 9.4 1 2 1 4 1 47 40 144 146 17 2 51 1.8 2 2 1
16 17 Devika 2 2 3000 39.5 1 2 1 1 19 2 78 149 2 10.1 1 2 1 4 1 53 42 149 157 14.7 2 44.1 2.1 11 31 388.46 1 2 2 1
17 18 Anushya 2 1 2800 39.4 1 2 1 2 22 2 70 154 2 10.2 1 2 1 2 1 50 43 165 129 18.1 2 53.9 7.3 10.5 30 299.97 1 2 2 1
18 19 Sujatha 1 1 3380 39.1 1 2 1 2 26 2 63 160 2 9.9 1 2 1 3 1 52 41 148 138 18.9 2 52.4 7.8 11.7 32 217.67 1 2 2 1
19 20 Revathi 1 2 3000 42 1 2 1 1 24 2 67 159 2 10.6 1 2 1 3 1 52 48 144 146 17.4 2 52.2 8.2 13 39 271.11 1 2 2 1
20 21 Divya 1 2 2860 40 1 2 1 1 18 1 75 152 2 9.2 1 2 1 3 1 54 53 140 157 17.8 2 52.4 5.6 13.5 40.2 167.73 1 2 2 1
21 22 Adhila parveen 2 2 1660 38.6 2 2 1 1 19 2 45 140 2 10.2 1 2 1 3 1 49 55 135 126 15 2 45 5.2 9.4 27 279.98 2 2 2 1
22 23 Anathi 1 2 2940 39.5 1 2 2 2 28 2 75 153 2 10.2 1 2 1 3 1 48 54 120 138 17 2 46.4 1.5 10.7 30 174.45 1 2 2 1
23 24 Deepa lakshmi 2 1 2170 34.2 1 1 2 2 33 2 50 162 3 12.9 2 2 1 3 1 56 53 134 149 19.2 2 57 17 17 10.1 30 168.56 2 1 2 1
24 25 Kaniyammal 2 2 3090 38 1 2 2 2 36 2 60 152 3 12.5 2 2 1 2 1 54 47 129 159 20.4 2 55 16.7 16.7 12.6 35 205.77 1 1 2 1
25 26 Lakshmi 2 2 3150 40.2 1 2 2 2 25 2 70 150 2 10.2 1 2 1 3 1 51 43 130 129 20.9 2 55 16.7 16.7 14 42 388.52 1 1 2 1
26 27 Barathi 1 1 3200 38.4 1 2 2 2 27 2 75 153 3 11.8 2 2 1 3 1 53 51 150 138 18.7 2 50 12.1 11.7 33 231.11 1 2 2 1
27 28 Gunapusanam 2 2 2820 37.6 1 2 2 2 28 2 71 156 2 10.5 1 2 1 4 1 56 50 135 147 15.8 2 43 10.4 8.9 24 90.89 1 2 2 1
28 29 Devi 2 1 2890 38.6 1 2 2 2 32 2 85 154 2 9.4 1 2 1 2 1 57 50 139 156 18.3 2 52 5 13.8 41.4 302.44 1 2 2 1
29 30 Karthiga 2 1 3850 39 1 2 2 2 21 2 89 166 3 12.8 2 2 1 3 1 47 51 148 159 18.1 2 46 11.9 13.9 41.7 311.23 1 2 2 1
30 31 Anushiya 1 2 3890 37.5 1 2 2 2 25 2 70 155 2 10.5 1 2 1 3 1 49 50 127 148 16.8 2 47 9.4 2 2 1
31 32 Rajathi 1 2 2290 40.1 1 2 2 1 20 2 44 142 3 13.3 2 2 1 3 1 50 52 129 138 20.1 2 55 9.2 11 33 275.62 1 2 2 1
32 33 Sangeetha 1 2 3000 38 1 2 1 2 24 2 70 156 3 11 2 2 1 3 1 53 48 123 127 19.6 2 58.8 15.4 13.2 39.6 304.42 2 2 2 1
33 34 Bhuvaneshwari 2 1 2780 38.3 1 2 2 2 24 2 67 150 2 9.4 1 2 1 4 1 42 50 139 138 18 2 51 7.4 12 35 205.56 1 2 2 1
34 35 Sarmila 2 1 3200 39.4 1 2 2 2 33 2 71 160 3 11.5 2 2 1 3 1 48 51 148 128 19.2 2 57.8 4.2 14.6 41.7 378.61 1 2 2 1
35 36 Thulasi 1 1 2540 39.2 1 2 2 2 29 2 70 150 2 10.5 1 2 1 2 1 69 53 146 140 15 2 42 8.3 11 31.4 79.56 2 2 1 1
36 37 Bhanumathi 1 2 2950 39.2 1 2 2 1 25 2 49 146 2 10.5 1 2 1 2 1 50 55 155 123 15.6 2 42 4.9 9.1 29 352.51 1 2 2 1
37 38 Jenifar 2 2 2450 36.2 1 1 1 1 23 2 65 153 2 10.2 1 2 1 3 1 53 56 140 148 19.3 2 53 5.5 12.1 32.3 405.56 1 2 2 1
38 39 Kanagi 2 1 3800 41.3 1 2 1 2 26 2 68 156 3 12.2 2 2 1 3 1 54 46 150 159 18.6 2 56 9 12 33.5 388.67 1 2 2 1
39 40 sarala 2 1 2465 38 2 2 1 1 24 2 49 156 2 9 1 2 1 3 1 56 49 152 129 21.6 2 57 16.7 16.7 14.6 41.7 205.57 1 1 2 1
40 41 Glory 2 2 3750 40.3 1 2 2 2 24 2 55 155 2 9.6 1 2 1 3 1 51 48 158 150 22.3 2 60 16.1 16.1 13.3 38 187.67 1 1 2 1
41 42 Vijayalakshmi 2 2 3295 39.2 1 2 2 2 30 2 90 151 3 11.5 2 2 1 4 1 52 50 155 155 18.1 2 55 14.6 13.5 40.5 206.55 1 2 2 1
42 43 Roshini 2 1 2965 38.5 1 2 1 2 20 2 50 145 1 8.9 1 1 1 2 1 54 51 159 144 18.9 2 52 6.7 11 33 178.89 1 2 2 1
43 44 Bobby 1 1 2550 36.1 1 1 2 1 24 2 70 165 3 11.1 2 2 1 3 1 50 54 149 159 19.5 2 53 8.5 2 2 1
44 45 Kalpana 1 1 3650 40 1 2 1 1 24 2 75 160 2 9.2 1 2 1 3 1 48 53 146 134 19.7 2 55 9.1 14.6 41.7 177.14 1 2 2 1
45 47 Kalaiarasi 2 1 3250 35.3 1 1 1 1 19 2 67 154 2 9.4 1 2 1 3 1 50 50 142 143 18.9 2 52 12.1 12.5 36 234.62 1 2 2 1
46 49 Preethi 2 1 2940 39 1 2 1 1 21 2 61 153 2 9.5 1 2 1 3 1 52 51 149 123 18.6 2 56 13.2 12.5 36 207.56 1 2 2 1
48 51 Vidhiya 1 2 3130 40.4 1 2 1 2 23 2 49 162 1 8.9 1 1 1 4 1 49 48 158 143 18.6 2 55.8 5.6 2 2 1
49 52 Prameela 2 2 3550 40.4 1 2 1 1 21 2 65 147 2 9.1 1 2 1 2 1 52 50 137 134 17.9 2 53.7 7.2 14 42 78.57 1 2 2 1
50 53 Rajalakshmi 1 1 2890 40.1 1 2 1 2 23 2 55 150 2 10.1 1 2 1 2 1 53 51 156 145 17.5 2 52.5 5.1 13 39 207.37 1 2 2 1
51 54 Maheswari 1 2 2860 37.1 1 2 1 1 35 2 92 152 3 11.5 2 2 1 3 1 66 54 153 154 20.7 2 56 15.2 13.8 39 211.12 1 2 1 1
52 55 Uma 2 2 2400 40.1 2 2 1 2 24 2 56 148 2 9.4 1 2 1 3 1 49 51 159 156 17.3 2 53.8 6 12.5 37.5 201.12 1 2 2 1
53 56 Deepa 2 2 2500 36.4 1 1 1 1 23 2 69 159 2 10.9 1 2 1 3 1 50 50 160 147 18.9 2 54 9.6 2 2 1
54 59 Luthiya 1 1 2745 40.4 1 2 1 1 20 2 56 160 2 10.3 1 2 1 3 1 54 48 151 138 17.3 2 53.8 11.6 12.5 37.5 367.87 1 2 2 1
55 60 Kovindammal 1 2 3275 38.1 1 2 2 2 27 2 67 165 2 10.5 1 2 1 3 1 55 49 149 129 15.2 2 45.6 2.7 9.7 28 257.62 2 2 2 1
56 61 Rekha 1 1 2780 39.4 1 2 2 2 24 2 53 143 2 9.2 1 2 1 3 1 56 51 136 126 18 2 48 11.4 11 30 389.67 1 2 2 1
57 63 Priya 2 2 3100 38.2 1 2 2 2 23 2 65 154 2 10.5 1 2 1 3 1 52 53 139 137 16.5 2 48 12.6 12.5 37.2 355.67 1 2 2 1
58 64 Sangeetha 1 2 3370 38.2 1 2 2 2 24 2 60 152 2 9.8 1 2 1 3 1 54 54 142 148 17.3 2 53.8 13.1 13.8 39 307.85 1 2 2 1
59 65 Jasimin 2 2 3440 40.1 1 2 2 1 27 2 60 140 2 9.2 1 2 1 3 1 50 55 149 159 14.8 2 40 12.6 11 33 190.98 1 2 2 1
60 66 Kanchana 1 2 3100 40 1 2 2 1 28 2 69 159 2 10.9 1 2 1 3 1 52 45 129 160 17.3 2 54 8.9 13.8 39 137.89 1 2 2 1
61 67 Indhu 2 1 3180 39.9 1 2 1 1 22 2 84 161 2 10.5 1 2 1 3 1 51 47 140 120 16.5 2 48 9.1 12.4 37 172.23 1 2 2 1
62 69 Sasikala 1 1 3600 38.5 1 2 2 2 26 2 64 155 2 9 1 2 1 4 1 49 40 149 139 17 2 44 5.2 13.8 39.1 291.67 2 2 2 1
63 70 Revathi 1 1 2630 38.1 1 2 2 2 26 2 60 148 2 9.8 1 2 1 2 1 53 42 158 148 17.3 2 54 7.2 12 36.3 287.56 1 2 2 1
64 71 Parameshwari 2 1 2730 38.5 1 2 2 2 25 2 71 156 2 9.5 1 2 1 3 1 55 43 150 157 17.1 2 51.3 6.2 2 2 1
65 72 Anjali 2 2 3230 39.3 1 2 2 2 23 2 70 162 3 12.5 2 2 1 2 1 56 49 147 126 18.1 2 54.6 7.2 12.5 36.5 352.45 1 2 2 1
66 73 Bhavani 2 1 2500 39.4 2 2 2 1 24 2 44 142 2 10.8 1 2 1 3 1 52 47 139 137 16.5 2 49.5 7.7 12.2 36.6 222.85 1 2 2 1
67 74 Shalini 2 1 3000 41 1 2 2 1 28 2 74 155 2 10.3 1 2 1 3 1 53 51 129 148 16.8 2 50.4 4.3 12.4 37.4 299.45 1 2 2 1
68 75 Jayalakshmi 2 2 3375 39.4 1 2 2 2 29 2 75 147 2 10 1 2 1 3 1 47 53 140 159 20 2 60 15.2 17.1 14.7 46 401.55 1 1 2 1
69 76 Saraswathi 1 1 3765 38.2 1 2 2 2 25 2 65 145 2 9.9 1 2 1 3 1 48 58 132 160 20.2 2 60.6 15.1 16 14.5 43.5 388.55 1 1 2 1
70 77 Vetriselvi 1 2 3040 38 1 2 2 2 28 2 97 157 2 10.4 1 2 1 3 1 58 47 155 156 19.5 2 58.5 10.1 2 2 1
71 78 Manjula 2 1 3490 38.1 1 2 2 2 26 2 65 153 2 10.4 1 2 1 3 1 54 48 154 150 15 2 45 13.2 9.7 28 107.34 1 2 2 1
72 79 Thayaluni 2 2 2200 35.5 1 1 2 1 25 2 68 144 2 10.9 1 2 1 2 1 57 49 159 148 19 2 57 6.9 13 39 209.12 1 2 2 1
73 80 Mathina bakam 1 1 3500 41.5 1 2 2 2 36 2 65 152 3 11 2 2 1 2 1 53 52 149 137 18.2 2 54.6 7.9 13.9 41.7 388.87 1 2 2 1
74 81 Selvi 1 1 2700 36.5 1 1 1 2 32 2 60 148 2 9 1 2 1 3 1 52 51 144 122 17.9 2 53.9 8.1 12.9 38.9 209.99 1 2 2 1
75 82 Anitha 1 1 3600 39.4 1 2 1 1 20 2 65 153 2 10.5 1 2 1 3 1 51 42 155 143 18.1 2 54.3 7.2 13.6 40.9 378.93 1 2 2 1
76 83 Samdhanibakam 1 2 3500 40.1 1 2 1 2 29 2 56 148 2 9.6 1 2 1 3 1 45 41 145 154 17.8 2 53.1 11.1 12.8 37 259.56 1 2 2 1
77 84 Rajalakshmi 1 1 3520 38 1 2 1 1 23 2 60 156 3 11 2 2 1 3 1 46 43 154 146 20 2 60 9 14 42 399.67 1 2 2 1
78 85 Lavanya 2 1 2980 36.6 1 1 1 1 20 2 72 152 2 10.8 1 2 1 3 1 49 47 160 135 20.3 2 60.9 15.8 15.8 14.2 42.6 180.87 2 1 2 1
79 86 Vijayalakshmi 2 1 3300 38.2 1 2 1 2 27 2 72 161 2 10.2 1 2 1 4 1 47 49 156 124 17.6 2 52.8 8.9 13.2 39.9 211.42 1 2 2 1
80 87 Kavitha 2 1 1800 36.5 2 1 1 1 21 2 64 149 2 9.6 1 2 1 3 1 51 48 145 142 18.2 2 54.6 8.2 2 2 1
81 88 Kanikeshwari 1 1 3300 40.2 1 2 1 2 23 2 65 158 2 1