University of Southern Queensland
Faculty of Engineering and Surveying
Terrestrial Photo Modelling
A dissertation submitted by
Andrew Robert Bryde
Q97240711
In fulfilment of the requirements of
Courses ENG4111 and 4112 Research Project
Towards the degree of
Bachelor of Spatial Science
(Surveying)
ABSTRACT
The implementation of planning schemes by local government councils has increased the cost to produce a development application. The project aims to use terrestrial photogrammetry to reduce the cost of preparing proposal plans required for development applications. Terrestrial photogrammetry has been identified as a potential source of reducing costs as bottom-end terrestrial photogrammetry software has considerably reduced in cost.
There are three case studies used to assess the cost benefit of terrestrial photogrammetry as the primary input for the preparation of preparatory development plans. The case studies used are:
• A duplex subdivision
• A residential renovation
• A canal basin
These case studies were chosen to provide a variety of accuracies and detail that is required to produce the relevant plans.
University of Southern Queensland
Faculty of Engineering and Surveying
ENG4111 & ENG4112
Research Project
Limitations of Use
The Council of the University of Southern Queensland, its Faculty of Engineering and Surveying, and the staff of the University of Southern Queensland, do not accept any responsibility for the truth, accuracy or completeness of material contained within or associated with this dissertation.
Persons using all or any part of this material do so at their own risk, and not at the risk of the Council of the University of Southern Queensland, its Faculty of Engineering and Surveying or the staff of the University of Southern Queensland.
This dissertation reports an educational exercise and has no purpose or validity beyond this exercise. The sole purpose of the course pair entitled ‘Research Project’ is to contribute to the overall education within the student’s chosen degree program. This document, the associated hardware, software, drawings, and other material set out in the associated appendices should not be used for any other purpose: if they are so used, it is entirely at the risk of the user.
Prof G Baker
Dean
CANDIDATES CERTIFICATION
I certify that the ideas, designs and experimental work, results, analysis and conclusions set out in this dissertation are entirely my own efforts, except where otherwise indicated and acknowledged.
I further certify that the work is original and has not been previously submitted for assessment in any other course or institution, except where specifically stated.
Andrew Robert Bryde
Student Number: Q97240711
(Signature)
ACKNOWLEDGEMENTS
v
1.
TABLE OF CONTENTS
Contents
Page
ABSTRACT i
CANDIDATES CERTIFICATION iii
ACKNOWLEDGEMENTS iv
LIST OF FIGURES vii
LIST OF TABLES ix
LIST OF APPENDICES x
1. CHAPTER 1 - INTRODUCTION 1
1.1 Outline of the Study 1
1.2 Introduction 1
1.3 The Problem 2
1.4 Project Objectives 2
1.5 Conclusion 4
2. CHAPTER 2 – LITERATURE REVIEW 5
2.1 Introduction 5
2.2 Data Required for DA Proposal Plans 5
2.2.1 Locality Plans 6
2.2.2 Site Analysis Plans 6
2.2.3 Reconfiguration of a Lot Plans 6
2.2.4 Demolition Plans 7
2.3 Survey Projects using Terrestrial Photogrammetry 7 2.4 Other Projects using Close-range Photogrammetry 11
2.5 Image File Formats 12
2.6 Overview of Photography Techniques 14
2.6.2 Camera Calibration 17
2.7 Overview of PhotoModeler 19
2.7.1 Modelling Techniques 20
2.8 Conclusion 22
3. CHAPTER 3 – DESIGN AND PHOTOGRAPHY MODELLING 22
3.1 Introduction 23
3.2 Design 23
3.2.1 Photography of Case Studies 23
3.2.2 Model Case Studies 25
3.2.3 Evaluate Photographic Model Accuracy 25 3.2.4 Evaluate Photography Model Against Total Station Model 26 3.2.5 Cost Comparison Between Photography over Total Station Models 26
3.3 Model Development 26
3.3.1 Camera Calibration 27
3.3.2 Case Study 1 – A Duplex Subdivision 28 3.3.3 Case Study 2 – A Residential Renovation 32 3.3.4 Case Study 3 – A Canal Basin 34
3.4 Conclusion 37
4. CHAPTER 4 – MODEL ANALYSIS AND EVALUATION 36
4.1 Introduction 38
4.2 Model Accuracy 38
4.2.1 Case Study 1 – A Duplex Subdivision 38
4.2.1.1 Accuracy Results 39
4.2.1.2 Analysis of Errors 40
4.2.2 Case Study 2 – A Residential Renovation 41
4.2.2.1 Accuracy Results 41
4.2.3 Case Study 3 – A Canal Basin 43
4.2.3.1 Accuracy Results 43
4.2.3.2 Analysis of Errors 44
4.3 Cost Evaluation 45
4.3.1 Baseline Costs 45
4.3.2 Implementation Costs 46
4.3.3 Comparative Costs – Total Station v PhotoModeler 47 4.3.3.1 Case Study 1 – A Duplex Subdivision 49 4.3.3.2 Case Study 2 – A Residential Renovation 49 4.3.3.2 Case Study 3 – A Canal Basin 49
4.4 Conclusion 50
5. CHAPTER 5 – CONCLUSIONS AND IMPLICATIONS 48
5.1 Introduction 51
5.2 Outcomes of Research 51
5.3 Future Study 52
6. LIST OF REFERENCES 53
7. BIBLIOGRAPHY 55
2.
LIST OF FIGURES
Number Title
Page
2.1 Examples of point location error with regard to camera positions 14 2.2 Example of camera positions with good vertical separation 15 2.3 Example of three camera positions used to increase accuracy 16 2.4 Example of correct camera positions to combat obstructions 16 2.5 Example of calibrated camera information 18 2.6 Constraints available by PhotoModeler Pro 20 2.7 Total error scale as calculated by PhotoModeler Pro 21 3.1 Calibration sheet supplied by PhotoModeler Pro 27
3.2 Locality diagram of subject site 28
3.3 Photographs of subject site 29
3.4 Photograph showing epi-polar line crossing placed control marks 31 3.5 Photograph showing window structure is contained within
control marks
33
3.6 Image showing cross-section taken perpendicular to wall 35 4.1 Photo showing selected points used for accuracy evaluation 40
3.
LIST OF TABLES
Number
Title
Page
2.1 Table showing model accuracies of various image qualities as researched by PhotoModeler Pro
17
4.1 Table showing errors of selected model points 39 4.2 Table showing errors of selected window dimensions 41 4.3 Table showing field hours to survey case studies using a
total station
45
4.4 Table showing indicative prices of terrestrial photogrammetry products
47
4.5 Table showing field hours to survey case studies using photogrammetry
47
4.
LIST OF APPENDICES
Number
Title
Page
A Project Specification 57
B Aerial photography supplied by Gold Coast City Council 59
C Example of DA proposal plans 60
Reconfiguration of a Lot plan 61
Part SP165596 (showing reciprocal support easements) 62
Site Analysis plan 63
Demolition plan 65
CHAPTER 1
INTRODUCTION
1.1
Outline of the Study
The implementation of new planning schemes in Queensland by local government councils has increased the costs of producing development applications (DA). These planning schemes have been introduced under the requirements of the Integrated Planning Act of 1997, which initially indicated that DA’s were to become cheaper and easier to produce.
The cost of producing a DA has increased due to the amount of information now required. Previously, a DA might consist of a set of concept plans and a short report. With the introduction of the new planning schemes, DA’s consist of proposal plans that closely represent current site conditions and a substantial report addressing specific criteria, even if the criteria is not applicable.
The focus of this project is to investigate terrestrial photograph modelling as a way of collecting data for the preparation of plans required for DA’s. The underlying objective is to reduce the rising costs of producing these plans.
1.2
Introduction
Until recently, the cost of photogrammetry has been high and its penetration as a useful tool has been limited. The implication is that knowledge and fine-tuning of its application in survey practises has been constrained, forming a hurdle to its wider adoption. As a result, some specialist survey practises have emerged that use photogrammetry. In recent years, software has taken advantage of the increased power of the desktop computer. This has led to the development of powerful computer programs like PhotoModeler. PhotoModeler uses terrestrial photography (or even video) to produce three-dimensional models for visualisation.
This project will deal with the use of digital photography modelling as a method of data collection for a survey practise.
1.3
The Problem
Survey practises are generally accepting of new and emerging technologies, though are impeded in taking advantage of these technologies due to cost. Therefore, there is a need to not only demonstrate compliance to accepted practice and standards, but also cost effectiveness of terrestrial photogrammetry. This project explores the use of this technology for collecting survey data for DA proposal plans.
1.4
Project Objectives
The objectives of this project are to:
1) determine how terrestrial photogrammetry enables the compilation of cost effective development plans, and
The project is divided into four parts:
a) an investigation phase which reviews relevant literature on:
- Data required for the preparation of DA proposal plans.
- Survey projects completed using terrestrial photograph modelling. - Other projects completed using terrestrial photograph modelling. - Image file formats.
- Overview of photography techniques. - Overview of PhotoModeler software.
b) A process phase to extract data from photographs required for CAD models to produce drawings, and source or collect data for comparison purposes using a total station
c) An evaluation phase comparing CAD models produced from total stations to photographic CAD models for comparative accuracy, and
1.5
Conclusion
The need of this study is to assess whether terrestrial photogrammetry can alleviate the rising cost to produce DA’s. The project assumes the use of total stations as the predominant method to collect data. Costs associated with compiling the report and other ancillary information in DA’s currently has little inefficiency and is not investigated during the course of this project.
A review of literature should identify that terrestrial photogrammetry is a valid way of capturing three dimensional survey data.
CHAPTER 2
LITERATURE REVIEW
2.1
Introduction
Establishing the cost effectiveness of terrestrial photogrammetry will require a technical understanding of the technology, as well as the nuances of its implementation for the purpose outlines in chapter 1. Literature provides easy access to the details of the studies undertaken by other professionals of similar projects. The literature review will entail six main topics:
• Data required for the preparation of DA proposal plans.
• Survey projects completed using terrestrial photograph modelling.
• Other projects completed using terrestrial photograph modelling.
• Image file formats.
• Overview of photography techniques.
• Overview of PhotoModeler software.
2.2
Data Required for DA Proposal Plans
There is certain information that is required on proposal plans contained within a DA. The survey information required depends on the type of proposal plan. Some example plans are:
• Locality
• Site Analysis
• Reconfiguration of a Lot (ROL), and
There are other plans that are contained within the DA but deal with information relating to the plan of development and do not require the need of any survey information.
2.2.1 Locality Plans
Locality plans are simple plans that give the reader an impression of surrounding lots and road layout. These plans show the site in relation to other parcels and supply the reader a focus of where the site lies. For this project, there is no requirement to supply information for these plans using terrestrial photogrammetry.
2.2.2 Site Analysis Plans
Site Analysis plans provide the reader with knowledge of existing and surrounding site conditions. The information on these plans includes:
• Limited feature information, e.g. trees, buildings, kerb line, etc.
• Position and direction of supplied site photography.
• Indicative levels over site.
• Miscellaneous information pertaining to infrastructure, climate, etc.
Appendix C shows examples of these plans. This project identifies the use of terrestrial photogrammetry to obtain feature information and indicative levels of the site. Current practice is to take photographs for inclusion in DA reports – these can form the base images required to produce the information.
2.2.3 Reconfiguration of a Lot Plans
demonstrates whether new lots can be serviced by the existing network and are compatible with the existing site contours.
This project will look at producing information for a smaller development that uses similar titling to the terrace style housing in Appendix C. It is envisaged that close-range photogrammetry can be used on duplex and triplex developments. This project will look at deriving contours for ROL’s.
2.2.4 Demolition Plans
Demolition plans indicate existing buildings intended to be demolished for the subsequent development as shown in appendix C. These plans show site and adjoining boundary information and the building outlines of the structures that are to be demolished. Rectified aerial photography is the best source in obtaining this information, but depending on site conditions, a combination of aerial and terrestrial photography can be used. This project will not directly refer to information shown on Demolition plans as it contains information from Site Analysis and ROL plans.
2.3
Survey Projects using Terrestrial Photogrammetry
The literature reviewed highlighted the use of terrestrial photogrammetry for both cadastral and engineering survey projects. None of the references provided information on how the technology has been applied to collect data for the use in producing DA’s.
The project described by DeChant and Gwartney (1999) showed how a survey company, FotoMetrix, used close-range photogrammetry to locate existing furnace ducts that required replacement. The problem was that it was elevated above the ground with many obstacles. If the survey used traditional methods, the furnace would need to be shutdown for a day to allow the ducts to cool down (that operates in excess of 300ºC), with the survey going to take further two days to complete. Further shutdowns are also required for the installation of the new ducts. An alternative survey method was therefore required to minimise plant downtimes and close range photogrammetry was selected as the most viable option.
The surveyed area was 9 x 12 x 3 metres taking 3 hours to complete with a total of 70 photographs taken. A 1.5 mega-pixel digital camera was used to acquire the photographs that were loaded into PhotoModeler, the software used for terrestrial photogrammetry, with a pre-saved calibration for the camera.
The advantage of PhotoModeler is its adjustment technique. In the above case, a 2.4 metre precision scale bar incorporated into the image was used to determine the scale rather than using a total station to locate control points. The drafting took two and a half days to complete, and according to the article, another 40% longer if the same survey used manually collected data.
Fotometrix undertook different tests to obtain and identify the resultant accuracies, (tests were not specified), which were accurate from 1:6000 and 1:20000 of overall project size. “The difference in accuracy depends on the method of marking points on the photos. The greater accuracy can be achieved with a feature called ‘sub pixel
target marking’ using adhesive-backed targets” (DeChant et al, p3,1999).
photogrammetry will still easily provide acceptable accuracies for DA proposal plans of 600 to 1000m² residential lots. This article also highlights the ability of terrestrial photogrammetry to locate structures in inaccessible areas and to create three-dimensional line work of all types of structures.
The North American Space Agency (NASA) also uses PhotoModeler to measure deformation in gossamer structures. The article by Pappa (2002) details the problem of measuring gossamer structures. Gossamer structures are soft and flexible, meaning instantaneous measurements are required for accurate measurements of deformation at any point in time. A few measurement options were discussed, including laser scanning, and close-range photogrammetry. The main problem with laser scanning of the gossamer structure is the time scanning takes. Although, scanning does not take very long, gossamer structures are very flexible and there is no guarantee that the structure will remain constant during the scan. As such, close-range photogrammetry was deemed the best method of measurement. NASA used the following photogrammetric process to develop their three-dimensional models.:
1) Establish measurement objectives and accuracy requirements
2) Design the photogrammetric geometry and select suitable cameras and lenses 3) Calibrate the cameras and lenses
4) Take the photographs
5) Import the images into the data analysis program
6) Mark the target locations on each image (this can be automatic in many cases) 7) Identify which points in each image are the same physical point (this can also be
automatic in many cases)
8) Process the data to obtain 3D results
9) Export the 3D coordinates to a CAD program for viewing or comparison with analytical predictions
(Pappa, 2002)
programs costing several hundred dollars. NASA identified a requirement for eight or more cameras to be needed simultaneously, favouring PhotoModeler as it works with ‘off the shelf’ digital cameras.
To model the photos with required accuracy, retro-reflective targets are marked in a grid on the structure. To ensure contrast between the structure and the targets, maximum flash and dim lighting was used. To model the structure is a matter of matching corresponding targets in each photo and clicking the process button to do a bundle adjustment. Pappa (2002, p.4) states, ‘An important part of these computations is the software’s sub-pixel interpolation algorithms that can find the center of ellipses in
images to an accuracy of one-tenth of a pixel or less. The 3D spatial measurement
precision of photogrammetry is directly related to this sub-pixel measurement factor.’ Measurements on the structures’ parabolic surface had a root-mean square deviation of approximately 1.5mm. This proves that there is potential for this software and use of digital cameras in regular surveying practices.
2.4
Other Projects using Close-range Photogrammetry
In a world where heritage and urban landscapes are becoming an important realm of capture and visualisation, close-range photogrammetry is becoming an important means of data capture and modelling (Ogleby and Rivett 1985; Ogleby 1999). Historical buildings are seen as integral to urban environment. As such, renovating them to their former glory is a consensus taken by the majority. There is also a need to visualise new developments to reflect the beauty of the history of the area. The contemporary approach is to create multi media formats, particularly video, making 3D models an integral part of developing new and redeveloping existing landscapes.
In an article by Chong et al (2003), New Zealand has been pro-active in using close-range photogrammetry for the recording of historical buildings and monuments. It is also shown by Santana Quintero et al (2002) close-range photogrammetry is being used in the recording of Europe’s Monuments and Sites.
As the accuracy and efficiency of digital techniques exceeds that achievable using manual and analytical techniques (Landes et al 1996), there has been a push by The International Committee for Monuments and Sites (ICOMOS) to adopt guidelines for the digital recording of historical sites. This involves specifications and standards for digital photogrammetric recording, including:
• Camera format and lens calibration.
• Photographic resolution.
• Object-space control accuracy.
• Bundle adjustment requirement.
• Photogrammetric products.
• Data archive.
(Chong et al, 2003)
• A set of colour digital photographs of photogrammetric quality.
• A set of accurate ground controls, which can be used in conjunction with a bundle adjustment technique (for aero triangulation).
• Details of the camera and lens.
• A topographic map showing the heritage site layout.
• Architects’ reports on the construction materials.
• Archaeologists’ reports on the cultural significance of the sites.
(Chong et al, 2003)
The recommended practices are for both architecturally and archaeological recording standards. There is scope to adopt these techniques in the spatial industry as a standard for quality assurance purposes, i.e. legal traceability of measurements. The recording of historical monuments and sites using terrestrial photogrammetry provided the project with confirmation that data required for DA proposal plans can be collected and that the idea of mapping a residential lot is feasible. The papers provided a good grounding to the potential quality assurance matters that will need to be determined to suit current recording procedures.
2.5
Image File Formats
The file formats reviewed for this project were:
• Joint Picture Expert Group (JPEG), and
• Tag Image File Format (TIFF)
There are a few reasons for focusing on these two image formats:
• Most digital cameras use JPEG file format for storage of images.
The main detraction of using JPEG is the type of compression used to reduce the size of the stored image. For photogrammetry purposes, the images need to be the best resolution possible, comprising of the number of pixels (the more the better) and definition between colours (noise). The compression ratio of the JPEG format consists of finding similar pixels with respect to their colour and determining that each is identical to the other.
For example, when a file is stored with 8 pixels in a row, the colours consist of aaaabbba, but in JPEG compression the image is stored as 4a3ba. Storing images this way takes less bytes, therefore reducing file size. Applying this technique, if a photo of a piece of paper was taken, you assume the image to be one colour. However, each pixel has a slightly different colour. When the image is saved as a JPEG, the pixel colours are deemed to be the same, which reduces the original quality of the image.
An alternative to the crude compression of JPEG is TIFF. There are many different types of compression available on TIFF images, but LWZ compression appears to produce the best results for photogrammetry. The feature of LWZ compression is that it uses code to compress the file without degrading the image quality. LWZ looks for patterns in the image to compress it. This means that the analysed information of the image will dictate the compression available. Generally, images can be compressed 3:1 without degradation.
2.6
Overview of Photography Techniques
2.6.1 Photography Methodology
To create accurate 3D models, a photograph set needs to meet three important criteria:
• Camera angles that allow all aspects of the object(s) to be included,
• At least two photographs in the series (three preferable), and
• Photography overlap to produce a contiguous image.
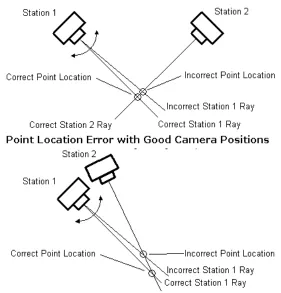
To obtain 3D points from the photographs, PhotoModeler firstly calculates the position of camera stations. 3D points are then calculated via the intersection of light rays from a minimum of two camera stations. Photographs should have intersections of 90 degrees (where possible). This minimises errors if camera stations are incorrectly positioned, as shown graphically below.
[image:26.595.183.464.324.617.2](PhotoModeler Pro, 2000) Figure 2.1 – Examples of point location error with regard to camera positions
errors in camera position will be accentuated as it will cause the calculated point to be further out as shown in figure 2.1 ‘Point Location Error with Bad Camera Positions’.
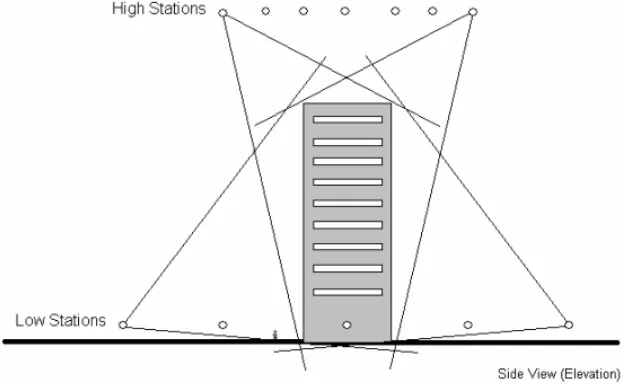
Good camera angles are based on horizontal and vertical separation. When taking photographs with both horizontal and vertical components, it is best to take photographs from above and below the object.
[image:27.595.171.483.198.390.2](PhotoModeler Pro, 2000) Figure 2.2 – Example of camera positions with good vertical separation
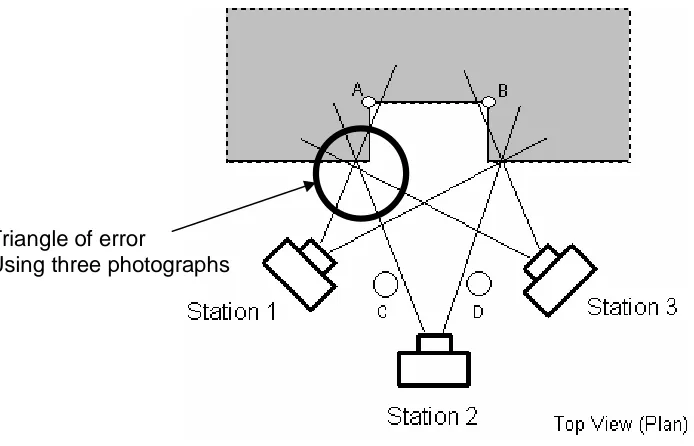
(PhotoModeler Pro, 2000) Figure 2.3 – Example of three camera positions used to increase accuracy
Photography overlap is necessary to increase accuracy of digitised points. The points to be digitised have to be shown on two photographs for calculation purposes. Therefore, there needs to be correlation of the image across photographs. The other point of interest is that accuracy decreases towards the edges of the photographs due to image refraction. When taking photographs of areas where obstructions exist, correct camera positions are needed to produce the best results. This is shown below:
(PhotoModeler Pro, 2000) Figure 2.4 – Example of correct camera positions to combat obstructions
Triangle of error
[image:28.595.190.461.522.678.2]2.6.2 Camera Calibration
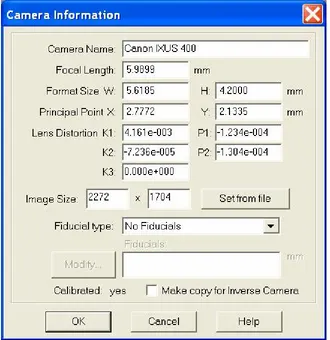
Before any work can be undertaken, all cameras need to be calibrated. Cameras need calibration of focal length, format size, principal point, and lens distortion. Most cameras have generalised figures for these, but these aspects need to be measured to ensure accuracy. PhotoModeler provides a camera calibrator program as part of the software.
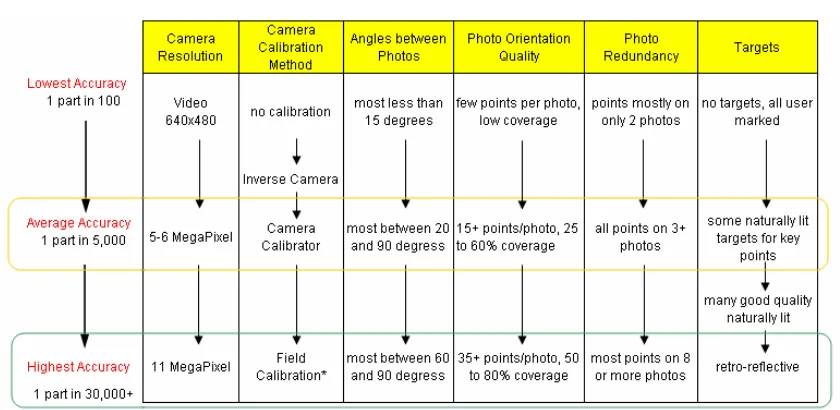
Camera calibration is a key component for accuracy of any project of this type. The table below highlights accuracy factors given by PhotoModeler.
Table 2.1 – Table showing model accuracies of various image qualities as researched by PhotoModeler Pro
(PhotoModeler Pro, 2000)
[image:29.595.114.534.332.537.2]Two digital cameras were used for the project, a 2.0 mega-pixel Power Shot A40 camera and a 4.0 mega-pixel Canon IXUS 400. However, it is recommended to use the highest resolution camera possible as there is a direct correlation between accuracy and the number of pixels (refer table 2.1). Using images with high resolution highlights features shown on the photography, as there is greater clarity between features. An example of the calibrated camera information is shown below, identifying the difference of focal length given by the camera of 7.4mm whereas the calibrated length is 5.9899mm.
2.7
Overview of PhotoModeler
There are many similar software programs available, such as I-Witness and Dimension, which apparently work like PhotoModeler. PhotoModeler has already obtained favourable results for NASA and FotoMetrix and is the preferred software for this project.
PhotoModeler uses one or more photographs of an object to produce a 3D representative model. A 3D model is a set of connected points, edges, curves and cylinders that represent an object. Points have coordinate values for each of the Cartesian axes (X, Y, and Z).
The photographs are imported and displayed on screen, and using the mouse, features of interest are marked, traced and tagged. PhotoModeler then combines the data from each photograph and locates the marked features in three dimensions. The marks become accurately measured points, lines, curves, cylinders or surfaces in a single, unified 3D space. The result is a 3D model that can be transferred to any graphics or CAD program.
There are eight steps to produce a model with PhotoModeler:
• Create approximations of a calibrated camera.
• Plan the Measurement Project.
• Take photographs of the object or scene.
• Import the photographs into PhotoModeler.
• Mark features on the photographs.
• Identify which points are the same.
• Process the data, and
Based on the research undertaken (see the discussion above from published articles including NASA), producing survey accurate 3D model requires several common factors, including:
• a calibrated camera
• multiple photos of the building or structure taken from different angles
• at least one known physical measurement between 2 points that appear in the photo (for scale and measurement purposes)
• possibly a network of 3D control points to help "solidify" the geometry if the photos have sub-optimal coverage or angles
2.7.1 Modelling Techniques
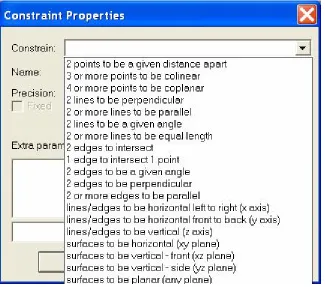
Using PhotoModeler to transform photographs into a 3D model requires a process using specific techniques. PhotoModeler uses “Constraints” as a method of adjusting photography to the required (or intended) outcome.
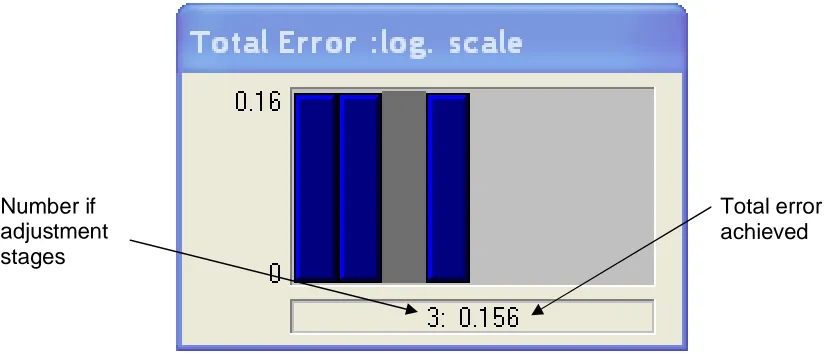
[image:32.595.166.491.424.711.2]Along with constraints, PhotoModeler has the ability to import control points of features on the photography. A mixture of control points and constraints are ideal for the bundle adjustment that is used by PhotoModeler. Once the control points and constraints are setup, the referencing of other common features take place using the point, line and edge tools. The photographs are processed to rectify images and produce 3-Dimensional points. A good bundle adjustment uses a two-stage process where control points and constraints are used firstly, with other point and line features used as a check on the initial adjustment. The aim is a total error of less than 1. If total error is over 1, then the rectification of the photographs is not to the desired accuracy. The total error is a composite value based on a combination of residuals for image, camera parameter, edge, constraint and control point in its calculation. An example of the two-stage total error result is shown below. The left most blue bars are the first adjustment, and the right most blue bar is the second, or check stage of the adjustment.
[image:33.595.110.528.356.534.2](PhotoModeler Pro, 2000) Figure 2.7 – Total error scale as calculated by PhotoModeler Pro
After the 3D model has been created the Z-axis needs to be determined to allow importing into a CAD package (the X and Y axes can be determined in the CAD package). A vertical component in at least one of photographs can be used to determine the Z-axis.
Number if adjustment stages
2.8
Conclusion
This chapter demonstrates that terrestrial photogrammetry can be used in collecting survey data for different types of applications. The processes outlined by FotoMetrix, NASA, and PhotoModeler will be used during this project to construct a comprehensive methodology. Using this methodology, accuracies obtained should resemble those gained by FotomMetrix and NASA, thus meeting required specifications (refer 3.2.1).
CHAPTER 3
DESIGN AND PHOTOGRAPHY MODELLING
3.1
Introduction
The aim of this chapter is to design a methodology and construct a photography model. The previous chapter details literature as a base in which development of the methodology can occur.
3.2
Design
The design methodology for acquiring the information required for DA proposal plans will be set out in five sections, being:
• Photography of case studies.
• Model case studies.
• Evaluate photographic model accuracy.
• Evaluate photography model against total station model
• Cost comparison between photography against total station model.
3.2.1 Photography of Case Studies
The photography methodology for the project will be based on the first four of nine steps outlined by Pappa (2002) (refer 2.1) and using the techniques shown in section 2.4.1.
is determined by the size of the site. Generally, for small developments of 600m2 to 1000m2, proposal plans are drawn at a scale of 1:200 or 1:250. DA proposal plans, being of a diagrammatic nature, only need to within +/- 0.5m for placement relative to the boundaries, with the relative positions of features to be within +/- 0.15m. The vertical position needs to be able to produce 0.5m contours and heights need to be within +/- 0.1m (relative to each other). This will produce contours accurate to half the contour width. The measurement objectives are such that the reader is able to scale from the plan and for the plan to represent current site conditions.
The horizontal component of the accuracy is set at a lower accuracy than required because of the inaccuracy of relating the photography model to lot boundaries. It is envisaged that the photography model will overlay the lot boundaries using fence lines and/or rectified aerial photography for correct horizontal positioning. Rectified aerial photography with a boundary overlay is now available through some local councils at a minimal charge (see appendix B).
Step two in the photography is designing the geometry and selecting a suitable camera. This step is essential to produce accurate photogrammetric models. This project acknowledges this step, but in obtaining photography for DA proposal plans, site conditions are generally unknown and photographs are taken with a camera available to the surveyor at the time. It is noted that good photography geometry is required. This involves knowledge of the photographic techniques described in section 2.4.1 and decisions about photographic geometry can be made ‘on the fly’ by the surveyor.
Step three involves camera and lens calibration (refer 2.6.2). In a typical work environment, this would occur as a routine quality assurance exercise and generally would not be calibrated before individual jobs. For the project, the cameras were calibrated (refer 3.3.1) before the first case study and after the last case study which will indicate any significant change to the calibration during the course of the project.
3.2.2 Model Case Studies
After the photographs are taken, the steps outlined by PhotoModeler Pro (2000) (refer 2.6) can be used as a guide. The steps taken are as follows:
a) Import the photographs into PhotoModeler.
b) Mark easily identifiable features on the photographs. c) Identify which points are the same.
d) Process the data.
e) Mark other required features.
f) Using auto-drive, identify which points are the same. g) Process the data.
h) Evaluate photographic model accuracy.
Steps e), f) and g) have been added to the list of steps from section 2.6 for clarity of process.
3.2.3 Evaluate Photographic Model Accuracy
3.2.4 Evaluate Photography Model Against Total Station Model
After the model has been exported to a CAD package the drawing can be finalised. This might include using fences to place the model over a boundary overlay, placing text, adding colour and shading. At this point the accuracy of the 3D model can be assessed against one collected via a total station. Models collected via a total station are not technically correct, but recognised as an industry standard for data representation for topographic surveys. If the comparison shows the photography model results are within +/- 0.100m, then accuracy is acceptable for DA proposal. The accuracy analysis results are detailed in section 4.2.
3.2.5 Cost Comparison Between Photography over Total Station Models
The collection of data using photography, instead of total station methods, is commercially viable if the costs are less. The cost for a total station survey team is sourced from B & P Surveys (Consulting Surveyors, Isle of Capri, Gold Coast, Queensland) job costings. The cost comparison is contained in section 4.3.
3.3
Model Development
The project has used three different case studies to assess the usefulness of terrestrial photogrammetry in DA proposal plans. These case studies were chosen to provide different modelling aspects in acquiring data for proposal plans, with an inference of using terrestrial photogrammetry to acquire future project data. The case studies include:
• A duplex subdivision
• A residential renovation, and
3.3.1 Camera Calibration
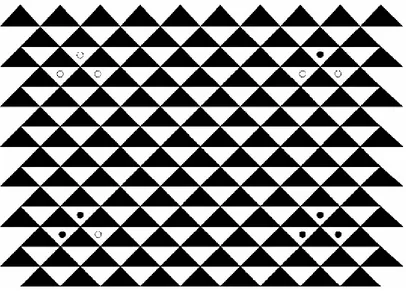
[image:39.595.125.531.212.503.2]The first step in constructing a photographic model is calibrating the camera and lens of the project cameras (refer 2.4.2). The cameras used were a Canon IXUS 400 (4 mega-pixel) and a Canon PowerShot A40 (2 mega-mega-pixel). The camera calibration used 8 photographs of an A1 size calibration sheet as shown below.
Figure 3.1 – Calibration sheet supplied by PhotoModeler Pro. (PhotoModeler, 2000)
The calibration sheet has four areas of control point mark being intersection of triangles at circular objects. The rest of the intersections are found by PhotoModeler using auto point recognition. The calibration results were sufficient being under 1 for the bundle adjustment.
3.3.2 Case Study 1 – A Duplex Subdivision
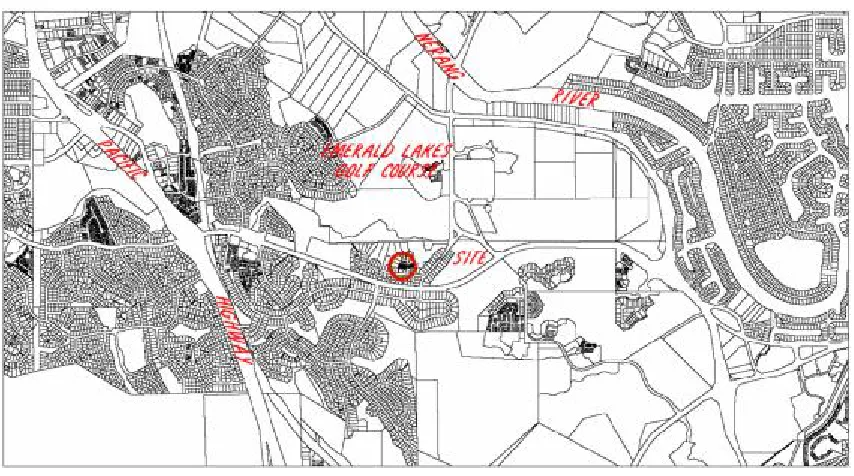
[image:40.595.113.540.226.464.2]Redevelopment of large house lots into duplex lots is a contemporary phenomenon designed to increase residential density. Case study 1 covers the main aim of the project, being collecting data from terrestrial photogrammetry to produce DA proposal plans. The case study site is a standard house block that is situated in Carrara on the Gold Coast and lies 1.5km from the Pacific Highway and 1.5km from the Nerang River (refer figure 3.2).
Figure 3.2 – Locality diagram of subject site.
Currently there is a single storey brick and tile home on the site. Terrestrial photogrammetry, in conjunction with aerial photography, that includes a boundary overlay (see appendix B), will be used to acquire data for DA proposal plans over the front of the property.
Control measures were obtained during the fieldwork. The first consisted of measuring the house with an offset tape. These measurements will be used to set the scale of the photography model, by nominating the distance between two digitised points. The other control measure was to detail (building line and features around the yard) the front of the property using a total station. This will be used as the control model in assessing the three-dimensional accuracy of the photography model.
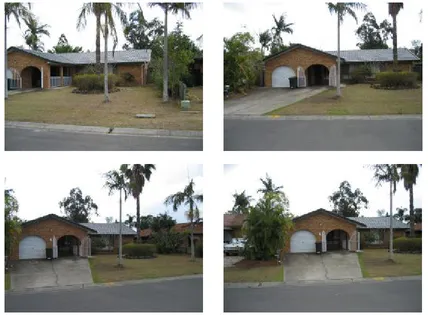
The photographs were then processed as outlined in section 3.1.2. Easily identifiable features were digitised and processed. The other features, especially those located in vegetated areas, were digitised using the aid of the auto-drive referencing, discussed later in the section. The main problem occurred when trying to digitise relief in open areas where there were no defining features. The following photographs are discussed below to highlight the difficulties and resultant solutions for this problem.
[image:41.595.109.537.367.682.2]
Figure 3.3 – Photographs of subject site
• Concrete driveway
• Garage facade
• Windows
• Roof line
• Eastern side (right most) of building, and
• Kerb
These features are useful 3-dimensional points. Additional points are needed for contouring, for example, spot levels over the lawn area. After photographs are oriented in PhotoModeler, there is a command for auto-drive referencing. Auto-drive referencing is an option that provides a cross-reference guide between photographs to assist in identifying common points. In this instance, a spot level was identifiable next to the central rock garden.
The auto-drive referencing works best when photographs are taken near 90 degrees to each other and uses a line (known as epi-polar line), which is consistent with the intersections from oriented photographs to show where related points lay. These are all taken from the one level, which means that the auto-drive line is shown close to horizontal along the photograph. So, when trying to pick the same point on another photograph, the Z component of the coordinate is easily found (as it lies along the epi-polar line), but the X and Y component is virtually impossible to pick as there is no identifiable feature to pick. If there is better vertical separation in the photographs, the epi-polar line can (depending on rectification) intersect the photograph on a greater vertical plane, which will reduce the error in locating X and Y component of a horizontal plane.
Figure 3.4 – Photograph showing epi-polar line crossing placed control marks
The red dots (highlighted by the circle) shown in figure 4.4, along with the epi-polar line, allow a spot level to be easily extracted from the photography. Thus, forward planning is required in taking purposeful photography.
Another problem that occurred was trying to locate the main roof peak, due to poor vertical separation in the photography set. The problem is the minimal perspective between the photographs. The horizontal position of the model is calculated using shallow angle photography. The vertical face of the building provides PhotoModeler with a surface to correctly rectify this problem for the area between the kerb and the building. To avoid this basic problem with the photography, especially for survey use, some elevated camera stations are needed. Case study 3 is used to show that when vertical separation is achieved, this problem will not occur.
There are several practical solutions to achieve elevated camera stations. The use of a cherry picker, or the like, will result in good vertical separation. Another option is an accessory called a camera pole. Camera poles have the ability to achieve a camera height of 6 metres with operation from ground level. Refer to section 4.3 for details of associated costs.
3.3.3 Case Study 2 – A Residential Renovation
Case study 2 highlights terrestrial photogrammetry use as a tool to ‘in fill’ existing data needed to produce DA proposal plans. This case study will involve acquiring data not required for DA proposal plans, but will highlight the ability of terrestrial photogrammetry to gather ‘extra’ data.
The survey involved locating rooflines and window and door openings of a previously located building outline. This was done using an offset tape transcribing the dimensions on an elevation sketch. The fieldwork took 1 day and the took 2 days in the office to draft all rooflines and window structures of each facade. There were subsequent trips to site to confirm some measurements.
During the fieldwork for this case study, photographs were taken of each side for ease of drafting. These photographs were taken using a Canon Power Shot A40 (2.0 mega-pixel) digital camera. As the photographs weren’t specifically designed for this purpose, there were some difficulties modelling the whole building. As such, only parts of facades could be modelled. Based on the modelling completed for the case study, an estimate to complete the full photography model is 5 hours.
Figure 3.5 – Photograph showing window structure is contained within control marks.
The 3-dimensional model is exported from PhotoModeler using a drawing exchange file (DXF) that can be imported into CAD for final drafting. The control points enabled the photography model to be imported into the correct position in the CAD model. A problem with this approach is that the top and bottom of window points are over the top of each other, having the same position but different elevations. The way to avoid this and show it in profile is to use the building ground control points to scale the model using the known distance between them, and then the rotation is set using one window as the X and Y-axes. When imported into CAD the facade is now shown as an elevation. The building ground points can be used to position the elevation in the correct spot in the model.
3.3.4 Case Study 3 - A Canal Basin
Case study 3 uses a survey of a canal basin to represent a larger and undeveloped parcel requiring data to produce DA proposal plans. The case study, like case study 2, will involve collecting data for purposes not relating to DA proposal plans. This case study is also used to confirm predictions that better vertical separation will provide greater accuracy to the vertical.
The newly built canal is located at Hope Island Resort on the Gold Coast. The canal was in the form of a bowl to which verification of ‘as constructed levels’ were needed before flooding took place. The issue with this type of case study is that generally time is of the essence, as the canal is flooded as soon as possible. The productivity improvement of taking photographs of an open area (less than half an hour using one person) compared to a topographic survey of at least two hours using a field crew is obvious. The camera used is a Canon Power Shot A40. Photographs were specifically taken to access the modelling potential of PhotoModeler. In this exercise, there were no issues with vertical separation, as photographs could be taken at the basin floor and basin rim.
Figure 3.6 – Image showing cross section taken perpendicular to wall.
Ensuring good adjustment, the model was processed using only the easily identifiable points in the revetment wall. With the photographs being oriented, it was just a matter of referencing points along the cross section between at least two photographs, with its coordinates and heights known. The reason for not processing the photographs after the cross section lines were added is because of the imprecise point locations. There are enough points to accurately orient the photographs using just the wall, so if the cross section points were added into the orientation, the resultant model would become skewed due to the inaccuracies of picking exactly the same point.
3.4
Conclusion
This chapter outlined the design methodology and subsequent modelling of the case studies. The methodology concisely demonstrated the steps required to perform an accurate photography model, being:
• Establish measurement objectives and accuracy requirements
• Design the photogrammetric geometry and select suitable cameras and lenses
• Calibrate the cameras and lenses
• Take the photographs
• Import the photographs into PhotoModeler.
• Mark easily identifiable features on the photographs.
• Identify which points are the same.
• Process the data.
• Mark other required features.
• Using auto-drive, identify which points are the same.
• Process the data.
• Evaluate photographic model accuracy
• Evaluate photographic model accuracy.
• Evaluate photography model against total station model
• Cost comparison between photography against total station model
CHAPTER 4
MODEL ANALYSIS AND EVALUATION
4.1
Introduction
For terrestrial photogrammetry to be viable in collecting data for DA proposal plans, an analysis is required to ensure the accuracy and cost saving to collect data with this method. Chapter 3 collected data for three case studies, from which a detail accuracy analysis can be done. An analysis of the cost to collect this data is also contained within this chapter.
4.2
Model Accuracy
This section evaluates and analyses the accuracy of the data. Each case study is evaluated to the required accuracy tolerances for DA proposal plans, stated in section 3.1.4.
4.2.1 Case Study 1 – A Duplex Subdivision
4.2.1.1 Accuracy Results
To evaluate the accuracy of the photography model against the total station model, the same datum must be used. The datum was established by:
• Point 3 (see figure 4.1) was used as common point to position the model horizontally.
• Points 3 and 4 (see figure 4.1) were used as a baseline to define a common model rotation.
• A point in the centre of model geometry was used a vertical datum point.
[image:51.595.162.489.473.637.2]The scale of the models was checked using the length of the garage as measured with an offset tape and the “snapped” distance from the CAD models. The length of the wall was within 0.010 metres of the taped measurement, being within required tolerances. The next challenge was to evaluate the position of the points compared with the total station model. Various points around the front yard (see figure 4.1) were used in conjunction with building corners. The results of this analysis can be seen below in Table 4.1.
Table 4.1 – Table showing errors of selected model points.
Pt Description dEast dNorth dEle 1 NW Fence Corner -0.041 -0.050 -0.06 2 NE Corner House 0.082 -0.060 3 NE Corner Garage -0.001 0.000 -0.01 4 SE Corner Garage 0.000 0.000 -0.05 5 NE Corner Driveway 0.006 0.016 0.06 6 SE Corner Driveway 0.036 0.016 0.07 7 SW Corner Driveway -0.021 0.072 -0.06
8 Benchmark -0.027 -0.035 0.06
9 Telstra Pit 0.063 -0.047 -0.06
4.2.1.2 Analysis of Errors
[image:52.595.114.536.274.451.2]Point 2 has the largest error. On the photograph shown in figure 4.1, this point is hidden by vegetation and is set much further back in the block than the other points located. This inaccuracy is resulting from the calculating of the light intersections by PhotoModeler. There was no height difference at this corner, as a level at ground level could not be obtained with the photography. The elevations are within tolerance with all inside +/- 0.100 metres. It is believed vertical accuracy will increase once a greater vertical separation is obtained in photography. Case study 3 will provide proof of this.
4.2.2 Case Study 2 – A Residential Renovation
This case study investigated the use of terrestrial photogrammetry as a tool to acquire ‘in fill’ data that is required for DA proposal plans.
4.2.2.1 Accuracy Results
[image:53.595.111.524.330.512.2]A selection of window dimensions were used to analyse the accuracy of the photography model. These are shown below in table 4.2.
Table 4.2 – Table showing errors of selected window dimensions.
Distance from Building Corner
Window dimensions
Window 1 left corner right corner
Distance from
Ground Height Width Photographic model 3.21 4.18 0.52 1.805 4.503 Measured dimensions 3.20 4.20 0.50 1.800 4.500
Difference 0.01 -0.02 0.02 0.005 0.003
Window 2
Photographic model 4.98 14.21 0.11 2.495 4.807 Measured dimensions 5.00 14.20 0.13 2.500 4.800
Difference 0.02 -0.01 -0.02 -0.005 0.007
4.2.2.2 Analysis of Errors
The errors are well within tolerance (table 4.2) and easily pass the requirements used for DA proposal plans.
The accuracy of this photography model is of a high level for several reasons:
• The close proximity of photography to the model area.
• Control points are located on the perimeter of the model area.
The proximity of the photography to the model area relates to the resolution that is obtained by the photography. The image files that digital cameras take are of a resolution of 2 mega-pixels in this case. This means that no matter what distance from the object, there will only be 2,000,000 pixels of detail, meaning the closer you to an object, the higher resolution the object will become.
Being infill photography, there will be already located features for which the software will use to rectify the photographs. In this case, control points were the corners of the building, providing accurate and easily identifiable control. Using control points on the surround the object will invariably increase accuracies as working from the whole to part will provide solid base from which rectification can occur.
The other benefit is that the feature to be digitised is relatively central in the photographs. This helps to minimise the effects of refraction (degrading accuracy) which generally increases in nature around the edges of the image.
The accuracy of the photography model also suggests that this is a valid method of performing a detailed survey of structures for architectural enhancement. The tolerances for this type of survey is two fold:
• The horizontal and vertical position of the window needed to be within 0.030m of the taped dimensions.
• The window dimensions are required to be within 0.010m of the taped dimensions.
4.2.3 Case Study 3 – A Canal Basin
Case study 3 is a survey of canal basin for the purpose of producing as constructed cross-sections for lodgement to the Department of Harbours and Marines. This government department sets the tolerances to which canals are to be constructed. The tolerance is shown in blue on figure 4.2.
4.2.3.1 Accuracy Results
[image:55.595.116.524.336.557.2]An example of cross-sections acquired from the photographic model is shown below in figure 4.2.
4.2.3.2 Analysis of Errors
Figure 4.2 identifies that cross-sections derived from terrestrial photogrammetry can resemble cross section obtained by total stations. The sketch also shows that in this case the constructed canal basin meets the Harbours and Marines specifications. The main problem that was encountered shows in point positioning of top and toe of batters. The top of rock shows a difference in position of 0.12m. This difference is due to the fact that when locating with the total station, the overhang of the revetment wall restricts location with a prism pole into the base of the wall. The other locations being the toe of rock, top of batter and toe of batter has a two-fold problem. As found earlier in case study one, digitising of features that don’t have an easily defined position, are restricted in the accuracy that can be obtained. The other is the location by total station. Locating the top and toe of batter is an interpretation by the chainman of where the top or toe of batter actually lies, as the batter normally has a ‘rollover’ on the change of grade rather than a definite change of grade. As such, there is little conclusive evidence that terrestrial photogrammetry is an accurate method of locating open space detail. There needs to be further analysis in this area by using a laser scanner. The laser scanner can provide a realistic three-dimensional model of the ground surface as it locates thousands of points against one string line of the total station.
4.3
Cost Evaluation
Establishing a baseline cost for traditional survey methods (total station) is important to assess the feasibility of terrestrial photogrammetry. In addition, there is the issue of the ‘one-off’ implementation costs of setting up terrestrial photogrammetry as a survey method in a practice. A review of B & P Surveys recent jobs shows that there is about 25 DA applications (Case Study 1) per year.
The cost comparison brings together the baseline and implementation costs. The implementation costs are mainly based on the purchase of new technology. The technology can become redundant in a very short period of time, as short as a 2 year life-cycle. A whole-of-life cost analysis is deemed unnecessary in this situation.
4.3.1 Baseline Costs
For this project, the baseline cost for a survey team using a total station has been established from B & P Surveys actual job costings. B & P Surveys have a time recording database. The database has separate entries for each job, and for each person assigned to that job is able to distinguish between office time and field time. The three case studies job times have been summarised as follows:
Table 4.3 – Table showing field hours to survey case studies using a total station
Field Time
(hours) Office Time (hours)
Project Travel On-site Surveyor Draftsman
Case Study 1 Total Station 0.5 1.5 1.0 0.6 Case Study 2 Field Crew 0.4 7.6 6.2 9.0 Case Study 3 Total Station 1.0 2.5 2.0 2.0
The hourly rates used for the cost extensions are based on the consulting rates from B & P Surveys. The rates are
Rates AUD Per Hour
Field party $130.00
Surveyor field $100.00
Surveyor office $90.00
Draftsman office $70.00
and will be applied to the case studies, both total station and photogrammetry survey methods.
4.3.2 Implementation Costs
Survey practises in the main are used to using technology to conduct their business, both in an administrative and operational sense. The computing resources available usually run sophisticated CAD software often in a local area network with several CAD stations. The technology associated with photogrammetry requires high level desktop operating systems and universal serial bus (USB) connectivity.
The elements required in the implementation of this technology would involve:
• Desktop Computer with minimum requirements being Windows 2000 and available USB 2.0 ports
• A Digital Camera, minimum of 1.5 mega-pixels
• PhotoModeler 4.0
Desktop computers and digital cameras are commodity items and are available from retail stores. The follow products and prices are used to establish the implementation cost.
Table 4.4 – Table showing indicative prices of terrestrial photogrammetry products
Sony Cybershot DSCP150 Digital Camera $500 Dell Dimension 3100 Desktop $1000
PhotoModeler $1000
Camera pole $6000
Total $8500
Using higher end products, such as a 11 mega-pixel camera and a more powerful computer, may add up to $2000 to the overall implementation cost. It is unlikely that any training or installation costs are required for photogrammetry. These costs may be reduced in some circumstances as many survey practises already have capable computers and digital cameras.
4.3.3 Comparative Costs – Total Station v Photogrammetry
The data collected on the case studies included the time required to do the photography and modelling of each of the studies. These times have been summarised in a similar format to the baseline job data as follows:
Table 4.5 – Table showing field hours to survey case studies using photogrammetry
Field Time
(hours) Office Time (hours)
Project Travel On-site Surveyor Draftsman
[image:59.595.113.507.620.731.2]The implementation cost of $8500 can be attributed across the 50 DA jobs expected to be undertaken using photogrammetry during the two year life-cycle. Each job will then receive a $170 on cost charge to recoup that implementation cost.
[image:60.595.88.558.218.516.2]Other overhead costs such as vehicle and administration costs are considered to be equal under both survey methods.
Table 4.6 – Spreadsheet showing cost analysis breakup
Notes:
1. Field cost travel is the extension of hours multiplied by applicable rate per hour. 2. Field cost On-site is the extension of hours multiplied by applicable rate per
hour plus either hours multiplied by total station rate per hour or photogrammetry rate.
3. Office costs extension of hours multiplied by applicable rate per hour.
4. The percentage represents the cost of the case divided by the total station cost. This means that for a case study, total station will always be 100%.
Rates Per Hour Per Job
Field party $130.00 Surveyor field $100.00
Total Station $20.00 Applicable to On-site time only Photogrammetry $170.00
Surveyor office $90.00 Draftsman office $70.00
Field Costs ($) Office Costs ($) Project Travel(1) On-site(2) Surveyor(3) Draftsman(3)
Total ($) %(4)
4.3.3.1 Detailed Analysis Case Study 1 – A Duplex Subdivision
The cost comparison for case study 1 reveals that it would not be cost effective to use photogrammetry to produce DA proposal plans. Terrestrial photogrammetry at 105% is comparable to total station costs. This analysis needs to be balanced with reality on the breadth of experiences and techniques in total station use. There is no cost driver to move to terrestrial photogrammetry by survey practises. To succeed as a viable option and replace total stations, terrestrial photogrammetry will need to be more cost effective on the office tasks. Future versions of PhotoModeler has the potential to halve office costs, at which point, terrestrial photogrammetry could become an attractive option.
4.3.3.2 Detailed Analysis Case Study 2 – A Residential Redevelopment
The cost comparison for case study 2 reveals that it would be very cost effective to use terrestrial photogrammetry to complement the production of DA proposal plans. Terrestrial photogrammetry costs of 44% suggests that this method is ideally suited for added detail to existing or historical survey data. Using traditional survey methods is labour intensive, tedious and has a high potential for error. Terrestrial photogrammetry has two cost advantages. The initial collection of the detail in the field suggests a 60% cost benefit. Secondly, the drafting tasks have a 75% cost benefit. The office based surveying tasks only have a minimal cost benefit using terrestrial photogrammetry.
4.3.3.3 Detailed Analysis Case Study 3 – Canal Basin
Vacant lot situations have few obstructions, with access readily available, highlighting the effective use of other methods, such as robotic total stations and global positioning systems (GPS). GPS and Robotic Total Stations are not investigated in this project. It is not likely that terrestrial photogrammetry will be more cost effective than these other methods.
4.4
Conclusion
This chapter assessed the accuracy and costs of using terrestrial photogrammetry to collect data for DA proposal plans (Case study 1). Case studies 2 and 3 provide the opportunity to assess terrestrial photogrammetry as a means to collect data for architectural enhancements and a test for greater accuracy for vertical separation.
Terrestrial photogrammetry is a useful and accurate tool for collecting data in small scale situations. Accuracy suffered when there were no discernable features. For case studies 1 and 2, the survey outcome is comparable to total stations and meets generally accepted standards. The accuracy comparison for case study three is inconclusive as both methods are flawed when used in vacant lot situations.
CHAPTER 5
CONCLUSIONS AND IMPLICATIONS
5.1
Introduction
The preceding chapters researched the use of terrestrial photogrammetry to gather data for DA proposal plans. This chapter will overview the findings of this project showing the outcome of the research. There will also be a section on future research required in the use of terrestrial photogrammetry.
5.2
Outcomes of Research
5.3
Future Study
Additional research is required to ascertain how the office task component of the terrestrial photogrammetry survey method can be stream lined. Alternate products to PhotoModeler may improve the office task component. As the cost of similar software varies greatly in cost, cost savings for office tasks could be offset by initial cost outlay. Alternate software, along with new versions of PhotoModeler, use cloud point technology to increase automation of point and string feature digitising. This will produce the greatest cost saving to office tasks.
List of References
Chong, A, McFadgen, B, Majid, Z, McKinlay, H, Luther, S, McHutchon, N, Khaw, C, Wang, S, Ahmad, A, 2003, ‘Digital Architectural Photogrammetric Recording of Historical Buildings and Monuments’, New Zealand Surveyor, No. 293, June, pp. 25-30.
DeChant, L, Gwartney, R, 1999, ‘Application: CAD Models Made from Photos Reduce Furnace Down Time’, Professional Surveyor, Vol. 19, April, A copy of this document can be found at http://www.profsurv.com/ (Accessed 15/04/2004)
EOS Systems Inc., 2000, ‘PhotoModeler Pro’, Version 4.0, a copy of this document can be found in the help screens within the program.
Ioannidis, C, Potsiou, C, Soile, S, Badekas, J, 2000, ‘Detailed 3D Representation of Archaeological Sites’, IAPRS, Vol. XXXIII, Amsterdam.
Kay, David C. & Levine, John R. 1995, Graphics File Formats, Windcrest, USA.
Landes, S., Bahr, H.P., Ringle, K., 1996, Architectural photog