Temporal variation in bird assemblages: how representative is a
one-year snapshot?
Martine Maron
1*, Alan Lill
1,2, David M. Watson
3, Ralph Mac Nally
41
Wildlife Ecology Research Group, School of Biological Sciences, Monash University, Victoria 3800, Australia
2
Department of Psychology, School of Psychology, Psychiatry and Psychological Medicine, Monash University, Victoria, 3800, Australia
3
Applied Ornithology Group, The Johnstone Centre, Charles Sturt University, Thurgoona NSW 2640 Australia
4
Australian Centre for Biodiversity: Analysis, Policy and Management Department of Biological Sciences, Monash University, Victoria 3800, Australia
* Corresponding author.Current address: Department of Biological and Physical Sciences, University of Southern Queensland, Toowoomba, Queensland 4350, Australia.
ABSTRACT
Bird assemblages generally are no longer regarded as stable entities, but rather as fluctuating in response to many factors. Australia’s highly variable climate is likely to result in a high degree of dynamism in its bird assemblages, yet few studies have investigated variation on an inter-annual temporal scale. We compared two year-long samples of the bird assemblages of a series of highly fragmented buloke Allocasuarina luehmannii (Casuarinaceae) woodland remnants in south-eastern Australia, the first sample taken in 1994–1995 and the second in 2001–2002. Bird densities were almost three times higher in the second period than in the first. Mean species richness also was significantly higher. Species richness of each individual site was unrelated between the two years. Minimum species turnover was 63% and was higher, on average, for
migratory and nomadic than for sedentary species. Therefore, site-level bird assemblage composition was markedly different between the two survey periods and, on average, the assemblage composition of each site bore greater resemblance to those of other sites in the same year than to that of the same site in the other survey period. Most species changed substantially in their distribution among remnants between the two periods. The change in distribution of most species did not differ significantly from that expected if the species had redistributed at random among the sites. This suggests that although the remnant vegetation of the area is highly fragmented with minimal inter-patch connectivity, bird movements among remnants must be relatively frequent. Inter-annual variability in Australian bird assemblages may be higher than is commonly recognized. In such dynamic systems, we must be cautious when extrapolating from the findings of short-term studies to longer temporal scales, especially in relation to
distributional patterns is likely to enable better predictions of species’ responses to habitat change.
INTRODUCTION
Studies in recent decades, mainly in the northern hemisphere, have challenged the idea that most bird assemblages are tightly structured and are, therefore, at or close to an equilibrial state (Wiens 1973, 1981; Rotenberry & Wiens 1980; Wiens & Rotenberry 1981; Holmes et al. 1986; DeAngelis & Waterhouse 1987; Mac Nally 1995; Yahner 1997; Collins 2000; Holmes & Sherry 2001). Not only do bird assemblages change seasonally, they also vary over longer temporal scales. The causes of such changes are often difficult to determine because patterns of variation in abundance and distribution differ among species (Hogstad 1993; Blake et al. 1994; Mac Nally 1996; Yahner 1997; Holmes & Sherry 2001). Factors responsible for changes in bird population densities and local distributions include climatic and/or resource variation on a local, regional or continental scale (Collins et al. 1984; Holmes et al. 1986; Virkkala 1991; Blake et al. 1994), interspecific competition (Holmes et al. 1986), density fluctuations of predators and changes in the type, amount and spatial configuration of available habitat (Blake et al. 1994; Holmes & Sherry 2001). These multiple influences, many of which may be unpredictable and/or difficult to detect, may result in a local bird assemblage exhibiting apparently stochastic variability through their effects on breeding success, juvenile or adult mortality and emigration/immigration of individuals.
variability in composition and species richness (Enemar et al. 1984). However, although much research has investigated seasonal variation in Australian bird assemblages, few studies have focused on variation among years (although see Mac Nally 1996).
Australia has many nomadic bird species that respond to fluctuating resource availability (Rowley 1975; Schodde 1982). Many Australian birds, particularly
nectarivorous species, are very dynamic in their distribution and local population sizes within years (Collins & Briffa 1982; Recher et al. 1983; Collins et al. 1984; Collins & Newland 1986; Mac Nally & McGoldrick 1997; Griffioen & Clarke 2002). Inter-annual variability of bird assemblages of particular localities is also likely to be pronounced, particularly where the climate is most variable.
2000). Recommendations for management stemming from only the one year of study would have led to only part of the species’ habitat being considered for conservation management.
METHODS
Study Area
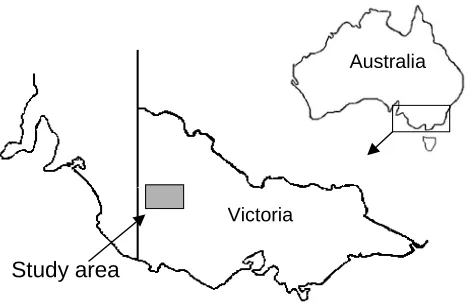
The study area is in the Wimmera region of western Victoria, Australia (Fig. 1). The area was originally grassland and open woodland, but has been mostly cleared for agriculture. About 95% of native vegetation has been removed, with the majority of clearing occurring prior to 1940. Woodland dominated by buloke Allocasuarina
luehmannii (Casuarinaceae), a small tree (to 15 m), was once a common vegetation type in this region, but now is restricted to a series of small, isolated patches. Originally having an understorey of native grass, forb and chenopod species, most remnants have been severely degraded by livestock grazing and introduced pest herbivores (European rabbit Oryctolagus cuniculus and brown hare Lepus capensis). Regeneration of bulokes is restricted to the few remnants from which grazing is excluded.
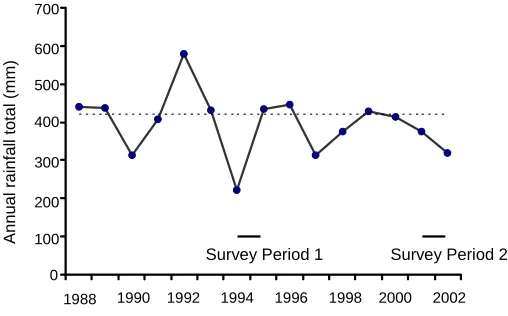
The study area is on the fringe of the southern part of Australia's semi-arid zone. The climate is variable and unpredictable from year to year. Mean annual rainfall is 400 mm, but annual totals fluctuated between 221 mm and 580 mm over the 15 y to the end of 2002. Most rainfall occurs in winter. Average daily temperature range at Nhill (36° 33’ 64’’S; 141° 63’ 53’’E) is 12.5°C–28.9°C in the austral summer (December– February) and 3.9°C–14.4°C in the austral winter (June–August).
Bird surveys
Watson et al. 2000). Most remnants were very isolated from other areas of native vegetation by cropping land, and only six of them were connected to nearby native vegetation by narrow (20–40 m) corridors. The distance from each remnant to the nearest patch of native vegetation ≥ 10 ha averaged 1457 m (Maron et al. 2004). The
bird assemblages of the 26 remnants were surveyed during each of two survey periods. Survey Period 1 was between April 20 1994 and March 22 1995 and Survey Period 2 was between June 30 2001 and June 14 2002. During each survey period, nine surveys were conducted in each of the 26 remnants at approximately six weekly intervals. Each survey consisted of the observer (DMW in 1994-95 and MM in 2001-02) slowly walking a 200 m transect and recording all individual birds within 25 m of the transect line, yielding a 1 ha sampling area. Each survey took 20 min to complete. Birds seen flying over the remnant were not included in analyses. Surveys were not undertaken in rainy or very windy conditions, within 30 min of sunrise or sunset, or during the hottest part of the day. To minimize survey bias due to time of day, each transect was surveyed at least four times in the morning and three times in the afternoon during each survey
period. All transects were located ≥ 20 m from the remnant’s edge. Although transects
could not be permanently marked because most remnants were privately managed, transects for Survey Period 2 were positioned as close as possible to the locations used in Survey Period 1 by referring to diagrams of their locations made by DMW during the first survey period.
with the bird fauna of the region and both observers undertook ‘mock’ surveys prior to data collection to become acquainted with the birds present. The open nature of buloke woodland and the structure of the trees themselves make locating and identifying birds present within a 1 ha transect relatively easy. Survey effort was identical during each survey period.
In addition to bird surveys, we obtained data on mean annual precipitation for the study area, to identify any major climatic events, such as drought, that might have affected the avifauna of the area. These data were obtained for the 15-y period from 1988 (6 years before the start of Survey Period 1) to the end of 2002. We also obtained maps of the deviation from regional long-term mean rainfall totals for Australia for each year during the same 15 y period. Rainfall data and maps were obtained from the
Australian Bureau of Meteorology.
Data analysis
Total abundance (the total number of records of each species at each site, summed for the survey period) was compared for each species (excluding those that occurred in fewer than five sites, and those that were not present during one of the survey periods) between the two years using Wilcoxon signed-rank tests. Total species richness for each site was calculated for both survey periods and linear regression was used to determine whether the species richness of individual sites was related between the two survey periods. Species turnover rate could not be determined because the survey periods were not in successive years so numerous undetected instances of extinction and
(Diamond & May 1977). Therefore, we calculated minimum turnover (T) for each site as: 100 ) ( . . . × + = tot spp spp S C E T
where Espp. = number of local extinctions (number of species not recorded at the site
during survey period 2 that had been recorded during survey period 1), Cspp. = number
of local colonizations (number of species recorded at the site during survey period 2 that had not been recorded during survey period 1) and Stot. = total number of species
observed at the site during both survey periods.
Mean minimum turnover per site was calculated for all species combined. Linear regression was used to investigate relationships between mean minimum turnover and
a) patch size and b) the distance to the nearest woodland patch ≥10 ha (both log
transformed). Bird species were categorized as nomadic, migratory or sedentary based on the classifications of Pizzey and Knight (1997). Where classifications in Pizzey and Knight (1997) were equivocal, the Handbook of Australian, New Zealand and Antarctic Birds (Marchant & Higgins 1990, 1993; Higgins & Davies 1996; Higgins 1999; Higgins & Peter 2001, 2002) was consulted to determine the most appropriate classification for the species in question in the study area. Mean turnover per site was then calculated separately for nomadic, migratory and sedentary species, and paired t-tests were conducted between each pair of categories.
least once during each survey period, we calculated the percentage change in distribution (D) between the two periods as:
100 ) ( . × + = tot sites sites N C E D
where Esites = number of local extinctions (number of sites from which the species was
not recorded during Survey Period 2 but in which it had been recorded during Survey Period 1), Csites = number of local colonizations (number of sites in which the species
was recorded during Survey Period 2 but in which it had not been recorded during Survey Period 1), and Ntot. = total number of sites in which the species was recorded
during at least one survey period. We conducted pairwise comparisons of the mean percentage change in distribution for each movement category (nomadic, sedentary, migratory) using heterogeneous variances t-tests, because of the unequal numbers of species in each category.
For assemblage-level comparisons, both the total abundance and presence/absence
data were represented as sites × species matrices, and Bray-Curtis similarity matrices
were calculated for each data set. We investigated whether the bird assemblage of each site in Survey Period 1 was more similar to that of the same site in Survey Period 2 than it was to the assemblages of other sites in Survey Period 2. The similarities between the bird assemblage of each site in Survey Period 1 and that of the same site in Survey Period 2 were determined (hereafter referred to as “site similarity”). We also calculated the mean similarity between the bird assemblage of each site in Survey Period 1 and those of each site in Survey Period 2. For example, similarities between site 1 in Survey Period 1 and site 1, 2, 3,…26 in Survey Period 2 were determined. The mean of these similarities was calculated. The grand mean of these 26 means (hereafter referred to as “overall similarity”) was then determined and compared with the site similarity.
RESULTS
Precipitation
The mean annual precipitation in the study area varied between 221 mm and 580 mm (Fig. 2). Both survey periods began during abnormally dry years, although in 1994 there was 99 mm less rainfall than in 2001. Unusually dry conditions were widespread across inland Australia during both 1994 and 2001. The rainfall total in the study area was close to the long-term mean in 1995 during the latter part of Survey Period 1, but conditions remained dry during 2002 in which Survey Period 2 concluded.
Species richness
Seventy-six bird species were recorded during the surveys, 65 in each survey period (for a complete list, contact the corresponding author). The mean species
richness per site (± 1SE) during Survey Period 1 was 13.5 ± 0.78, compared with 18.7 ±
0.61 during Survey Period 2, and this difference was statistically significant (t25 = 6.845,
P < 0.0001). The increased species richness was due to most species being more widespread among the remnants during Survey Period 2 (see ‘species distribution’, below). There was no relationship between the species richness of sites in the two survey periods (R2 = 0.018), so that a site with a relatively high species richness during Survey Period 1 did not necessarily also have a high species richness in Survey Period 2, and vice versa.
Abundance
(71%) increased numerically in abundance, 16 of which were statistically significant changes (Table 1). The red-rumped parrot Psephotus haematonotus increased most in abundance—from 37 individuals recorded in Survey Period 1 to 269 in Survey Period 2. For most species (with the exception of summer migrants), these greater abundances were due to generally higher counts from surveys throughout Survey Period 2, rather than to very high numbers recorded during only a few survey visits. Twenty species decreased in abundance in absolute terms, but none significantly.
Turnover
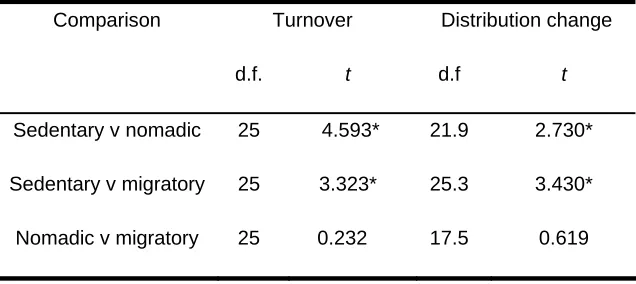
Mean minimum species turnover per site was 63% (Table 2). Turnover of sedentary species was significantly lower than that of both migratory and nomadic species (Tables 2 and 3), but there was no significant difference in turnover between the latter two groups (Table 3). Turnover was not related to either patch area (R2 = 0.001) or to the distance to the nearest patch ≥ 10 ha (R2 = 0.016).
Species distribution
For species that were recorded during both survey periods, the mean difference in distribution among the sites between the two time periods was 68% (Table 2). This means that, considering all the sites in which a species was recorded in either survey period, on average it occurred in 68% only during a single survey period, and in 32% of sites during both survey periods. For example, the dusky woodswallow Artamus
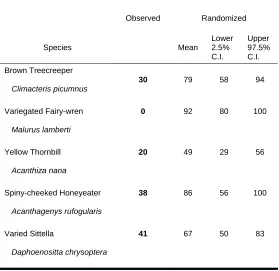
unchanged in distribution, namely the white-eared honeyeater Lichenostomus leucotis, which was observed only at Site 1 in both survey periods, and the variegated fairy-wren Malurus lamberti, which occurred only in sites 1, 2 and 3. The mean difference in distribution was significantly greater for both migratory and nomadic species than for sedentary species, but there was no significant difference between nomadic and migratory species (Table 3).
The randomization test showed that of the 54 species that were recorded at least once during each survey period, only five had a significantly smaller difference in distribution among sites between the two survey periods than expected if their redistribution was random (Table 4). These species were the brown treecreeper Climacteris picumnus, spiny-cheeked honeyeater Acanthagenys rufogularis, varied sittella Daphoenositta chrysoptera, variegated fairy-wren, and yellow thornbill
Acanthiza nana. The remaining 49 species were no more likely than expected by chance to be recorded during Survey Period 2 in sites in which they had occurred during Survey Period 1.
Assemblage structure—abundance data
Acanthiza chrysorrhoa (accounting for 10% of variation between survey periods), red-rumped parrot (8%), and house sparrow Passer domesticus (7%). All of these were species that had significantly different abundances in the two survey periods (Table 1).
The bird assemblage of a particular site (based on abundance data) was more similar to those of the other sites in the same survey period than to that of the same site in the other survey period. The average Bray-Curtis similarity among sites was 29.6 in Survey Period 1 and 31.8 in Survey Period 2. These similarities among sites within years were comparable to the average site similarity (i.e. the similarity between the bird assemblage of a site in Survey Period 1 and that of the same site in Survey Period 2), which was 27.1. Although the mean overall similarity (i.e. the mean similarity between a site in Survey Period 1 and all sites in Survey Period 2) was significantly lower at 23.1 (t25 = 2.57, P < 0.05), the bird assemblages of individual sites still differed
considerably between the two survey periods.
Assemblage structure—presence/absence
DISCUSSION
Bird abundance changes
The bird assemblages of these buloke woodland remnants had changed
substantially after a period of just 7 years. The change in the avifauna of the area was due largely to a threefold increase in the number of individuals recorded in the second survey period. Similar increases have been recorded in several long-term, continuous studies in the northern hemisphere. The total number of individual birds recorded on a 10-ha study plot in the Hubbard Brook Experimental Forest in New Hampshire, USA, varied from 89–214 over a 16 y period (Holmes et al. 1986), while Enemar et al. (1984) found that the number of breeding bird territories in a Swedish Lapland site fluctuated between 260–550 over a 20 y period. The populations of 78% of bird species considered to be permanent residents in Michigan and Wisconsin, USA, also varied significantly in abundance among years during a 6 y study (Blake et al. 1994).
species with a range of movement patterns and foraging strategies, it is difficult to attribute them to any single driver. However, it is possible that climatic conditions, perhaps distant from the study area, were ultimately responsible for the changes in bird abundance, because the study area abuts Australia’s semi-arid region. Variability in precipitation has been found to influence fluctuations in abundance in other animal populations (Lake 1995; Post & Forchhammer 2002; Meserve et al. 2003), and local populations of mobile taxa such as birds could be influenced by climatic variability in adjacent or even distant regions of the continent. The study area is likely to sustain fluctuations in bird populations that are driven by the climatic variability that
characterizes the arid zone. Unusually dry conditions inland may force birds south into the study area, while at other times, wetter coastal conditions may allow southern birds to move inland to the study region.
Many species underwent substantial changes in abundance, some (e.g. the red-rumped parrot) as much as six-fold. Changes of this magnitude over a period of just seven years are unlikely to reflect absolute changes in population density on a broader spatial scale. To determine whether density changes in one region are representative of broader trends, information on the population dynamics of a species on a much broader spatial scale is required (Virkkala 1991) because population dynamics are not
large differences in abundance that we recorded were due to influxes of individuals into the study area from elsewhere in the region, or even other parts of the continent.
Abundance changes of the observed magnitude are not unexpected in nomadic or migratory species. Numbers of individuals of several migratory species, such as the white-winged triller Lalage sueurii, reaching Victoria vary from year to year and influxes of several nomadic species into the study region are irregular (Emison et al. 1987). However, the substantial changes in abundance of several species generally considered to be sedentary suggest relatively large-scale movement even for these species. Movement strategies of many Australian birds are not easily categorized because little is known of their large-scale movements (Griffioen & Clarke 2002) and movement strategies of many species differ among populations (Chan 2001). Our results suggest that many species thought to be sedentary may be more vagile than is commonly recognized.
The use of different observers during each survey period also may have contributed to differences recorded in the bird assemblages between the two survey periods. Several studies have found that estimates of bird abundance can be influenced by observer differences (Kavanagh & Recher 1983; Morin & Conant 1994; Sauer et al. 1994; Cunningham et al. 1999), although others have found this effect to be small relative to among-site or inter-annual variation (Smith 1984). Often, observer
birds in Buloke woodland also reduced the likelihood of large observer effects. The substantial increase in abundance of red-rumped parrots between the two survey periods was also reported by local residents (K. Boschen, personal communication). The
variation in the bird assemblages of individual sites between survey periods was
substantial even when only presence/absence data were considered. Such data are likely to be more robust to inter-observer effects than abundance data (Kavanagh & Recher 1983), particularly as nine surveys per remnant were conducted in each survey period. We believe that the effects of observer differences were probably minor relative to the magnitude of the bird assemblage differences between survey periods. Precluding observer effects will always be difficult in long-term studies, because the capabilities of each individual observer change with experience and skill levels over time (Kendall et al. 1996).
Assemblage composition and species richness
have influenced the distribution of the fifth species, the variegated fairy-wren, which was recorded only from the same three sites in each survey period.
The majority of species, however, appear able to move among patches of remnant vegetation in the area, because their change in distribution among sites was similar to that expected in a random redistribution. These changes in distribution led to
considerable differences in the bird assemblages of individual sites between the two survey periods, despite the apparent ‘isolation’ of the sites by expanses of cropping land. The 63% minimum turnover observed in this study is broadly comparable to the figure of 52–60% average annual turnover in breeding bird species in Kansas tallgrass prairie (Collins 2000). Species richness values of individual sites in our study were also unrelated between survey periods. Fluctuations in bird species richness of 35–40% at a site have been documented in northern hemisphere studies (Enemar et al. 1984; Holmes et al. 1986). This potential for temporal variation in the relative species richness of a site must be recognized, particularly in situations where such information is intended to contribute to conservation management decisions.
Some of the variation in bird assemblages detected in long-term studies has been attributed to vegetation succession (Blake et al. 1994; Holmes et al. 1986). However, it is unlikely that changes in the vegetation characteristics of the remnants that we studied account for the large differences in the bird assemblages between the two survey
habitat that would be most likely to change is the ground layer. Although grazing regimes had not altered noticeably between survey periods, minor changes in grazing pressure may affect aspects of the ground layer, such as percentage grass cover, proportion of native grasses and mean grass height. It is possible that these relatively subtle changes may have influenced the bird assemblages, although it seems unlikely that so many bird species would have been directly affected by vegetation change to the observed extent. It is also difficult to attribute the differences in the bird assemblages of the Buloke remnants to changes in matrix land use, because broad-scale land clearing no longer occurs in the area, and farming practices have not changed markedly since the first survey period. However, rotation of crops is a common practice in the area and so, while similar crops were grown across the study area, it is possible that the particular combination of crops surrounding each site during winter and spring was different between the survey periods.
Such changes in the landscape immediately surrounding each site, as well as subtle within-site habitat changes, may have influenced the availability of food resources. Availability of both grass seeds and invertebrates could be influenced by relatively minor changes in vegetation or rainfall (e.g. Tanaka & Tanaka 1982). Most bird species present in the sites feed primarily on one or the other of these resources, so changes in resource availability may be at least partially responsible for the
are not ‘saturated’ with individuals at all times, and if individuals can move among patches, as appeared to be the case in this study, such distributional changes may be expected even in the absence of corresponding habitat or resource changes.
Dynamism in Australia
been analysed only with respect to seasonal variation after combining data for all years (Collins & Briffa 1982; Pyke & Recher 1988).
Management implications
The considerable temporal variation in bird species richness and assemblage composition in each remnant, despite a lack of clear habitat change, presents difficulties in determining management priorities. Land managers need rapid and inexpensive assessment of the conservation value of sites and predictive models that can be used to prioritize sites for protection or restoration. However, such assessments rarely take into account long-term variability, and the conservation planning tools that ecologists develop are often based on extrapolation of patterns from “snapshot” data. If inter-annual variability of the magnitude recorded in this study is widespread, such pattern-based extrapolation could result in misleading and inaccurate predictions (Mac Nally & Horrocks 2000). For example, Pearce et al. (2001) developed logistic-regression models to predict the distributions of 59 species of diurnal birds in north-eastern New South Wales. When confronted with new data, only 53% of the individual-species models had a prediction accuracy greater than 70% (< 70% was considered poor to marginal
discrimination). In the current study, the lack of relationships between the bird species richness values of individual remnants between the two survey periods means that there cannot be a persistent relationship between the species richness of a site and the
that may have been derived from the Survey Period 1 data are likely to be misleading, making accurate prediction of species distributions problematic.
In temporally variable systems, strategic conservation plans will be unreliable if developed solely on the basis of “snapshot” data (Wiens 1981; Fuller et al. 1997). However, conservation problems need to be addressed urgently, and in many cases we do not have the luxury of collecting data over a period sufficient to characterize the avifauna of sites accurately, or to determine persistent relationships between the presence of a species and landscape and habitat characteristics. An estimate of assemblage variability may be useful in allowing uncertainty to be explicitly
incorporated into models used in conservation planning, but for this to be possible, we need to gain an understanding of continent-wide patterns of assemblage variability. Research in the northern hemisphere has identified several potential correlates of bird assemblage variability, such as latitude (Jarvinen 1979) and habitat fragmentation (Boulinier et al. 1998b). Several databases in Australia contain relatively long-term bird survey data, most notably from the Atlas of Australian Birds project (Blakers et al. 1984; Barrett et al. 2004), which would permit investigation of inter-annual variability in bird assemblages across a wide range of habitats, climatic zones and landscapes.
that influence patterns in bird distribution and abundance (Wiens 1994; Austin 2002). Model predictions based on such an understanding of ecological processes are likely to prove more robust to temporal variability than those based on the extrapolation of correlations between bird presence and habitat variables from snapshots of bird distribution. For example, the influences of patch edges, area, and habitat structure on bird distribution may appear to vary from year to year if these variables are surrogates for factors such as the presence of competitors, predators or particular food sources (Burke & Nol 1998; Piper & Catterall 2003). However, in an environment of high temporal variability, identifying the factors that affect such processes is often a difficult task.
While it is possible that the system of habitat fragments that we studied is peculiar among Australian habitats, it is more likely that variability of the magnitude recorded in this study is a common feature of many bird assemblages because it has been recorded in numerous long-term studies worldwide. Authors of many such studies have
ACKNOWLEDGEMENTS
Financial assistance for this project was generously provided by the Holsworth Wildlife Research Fund, the Birds Australia VicGroup Award and the Stuart Leslie Bird
Research Award. We thank Dr Graeme Newell and the Arthur Rylah Institute for Environmental Research for the use of NRE Corporate Library information. We are indebted to the many landholders of the Wimmera for permission to conduct surveys on their properties and to the Wallace family for providing accommodation during
REFERENCES
Aberg J., Jansson G., Swenson J. E., and Mikusinski G. (2000) Difficulties in detecting habitat selection by animals in generally suitable areas. Wildl. Biol. 6, 89-99. Austin M. P. (2002) Spatial prediction of species distribution: an interface between
ecological theory and statistical modelling. Ecological Modelling 157, 101–118 Barrett G. W., Silcocks A. F., Barry S., Cunningham R. B. & Poulter R. (2004) The
New Atlas of Australian Birds. Birds Australia, Melbourne.
Blake J. G., Hanowski J. M., Niemi G. J. & Collins P. T. (1994) Annual variation in bird populations of mixed conifer-northern hardwood forests. Condor 96, 381– 99.
Blakers M., Davies S. J. J. F. & Reilly P. N. (1984) The Atlas of Australian Birds. Melbourne University Press, Carlton.
Boulinier T., Nichols J. D., Sauer J. R., Hines J. E. & Pollock K. H. (1998a) Estimating species richness: the importance of heterogeneity in species detectability. Ecology 79, 1018-28.
Boulinier T., Nichols J. D., Hines J. E., Sauer J. R., Flather C. H. & Pollock K. H. (1998b) Higher temporal variability of forest breeding bird communities in fragmented landscapes. Proc. Natl. Acad. Sci. U S A 95, 7497–501.
Burke D. M. & Nol E. (1998) Influence of food abundance, nest-site habitat, and forest fragmentation on breeding ovenbirds. The Auk 115, 96–104
Chan K. (2001) Partial migration in Australian landbirds: a review. Emu 101, 281–92. Clarke K. R. & Gorley R. N. (2000) PRIMER 5 for Windows. PRIMER-E Ltd,
Collins B. G. & Briffa P. (1982) Seasonal variation of abundance and foraging of three species of Australian honeyeaters. Aust. Wildl. Res. 9, 557–69.
Collins B. G., Briffa P. & Newland C. (1984) Temporal changes in abundance and resource utilization by honeyeaters at Wongamine Nature Reserve. Emu 84, 159–66.
Collins B. G. & Newland C. (1986) Honeyeater population changes in relation to food availability in the Jarrah forest of Western Australia. Aust. J. Ecol. 11, 63–76. Collins S. L. (2000) Disturbance frequency and community stability in native tallgrass
prairie. Am. Nat. 155, 311–25.
Collins S. L. (2001). Long-term reseach and the dynamics of bird populations and communities. Auk 118, 583–8.
Cunningham R. B., Lindenmayer D. B., Nix H. A., & Lindenmayer B. D. (1999) Quantifying observer heterogeneity in bird counts. Aust. J. Ecol. 24, 270–7. DeAngelis D. L. & Waterhouse J. C. (1987) Equilibrium and nonequilibrium concepts
in ecological models. Ecol. Monogr. 57, 1–21.
Diamond J. M. & May R. M. (1977) Species turnover rates on islands: dependence on census interval. Science 197, 266–270.
Emison W. B., Beardsell C. M., Norman F. I., Loyn R. H. & Bennett S. C. (1987) Atlas of Victorian Birds. Department of Conservation, Forests and Lands and the Royal Australasian Ornithologists Union, Melbourne.
Fuller R. J., Trevelyan R. J., & Hudson R. W. (1997) Landscape composition models for breeding bird populations in lowland English farmland over a 20 year period. Ecography 20, 295–307.
Griffioen P. & Clarke M. F. (2002) Large-scale bird-movement patterns evident in eastern Australian atlas data. Emu 102, 99–125.
Higgins P. J. (ed). (1999) Handbook of Australian, New Zealand and Antarctic Birds Volume 4. Parrots to Dollarbird. Oxford University Press, Melbourne.
Higgins P. J. & Davies S. J. J. F. (eds). (1996) Handbook of Australian, New Zealand and Antarctic Birds Volume 3. Snipe to Pigeons. Oxford University Press, Melbourne.
Higgins P. J. & Peter J. M. (eds). (2001) Handbook of Australian, New Zealand and Antarctic Birds Volume 5. Tyrant flycatchers to Chats. Oxford University Press, Melbourne.
Higgins P. J. & Peter J. M. (eds). (2002) Handbook of Australian, New Zealand and Antarctic Birds Volume 6 Pardalotes to Spangled Drongo. Oxford University Press, Melbourne.
Hobbs J., Anderson J. R., Dillon J. L. & Harris H. (1988) The effects of climatic variation on agriculture in the Australian wheatbelt in M. L. Parry, T. R. Carter, and N. T. Konjin, editors. The impact of Climatic Variations on Agriculture vol 2: Assessments in Semi-arid Regions. Kluwer (eds. M. Dordrecht, L. Parry, T.R. Carter & N.T. Konjin) pp 665-753. Academic Publishers, Dordrecht, The Netherlands.
Holmes R. T. & Sherry T. W. (2001) Thirty-year bird population trends in an
unfragmented temperate deciduous forest: importance of habitat change. Auk
118, 589–609.
Holmes R. T., Sherry T. W., & Sturges F. W. (1986) Bird Community Dynamics in a Temperate Deciduous Forest Long-Term Trends at Hubbard Brook. Ecol. Monogr. 56, 201–20.
James C. D., Landsberg J. & Morton S. R. (1995) Ecological functioning in arid
Australia and research to assist conservation of biodiversity. Pac. Conserv. Biol.
2, 126–42.
Jarvinen O. (1979) Geographical gradients of stability in European land bird communities. Oecologia 38, 51–69.
Kavanagh R., & Recher H. F. (1983) Effects of observer variability on the census of birds. Corella 7, 93–100.
Kendall W. L., Peterjohn B. G., & Sauer J. R. (1996) First-time observer effects in the North American Breeding Bird Survey. The Auk 113, 823–9.
Lake P. S. (1995) Of floods and droughts: river and stream ecosystems of Australia. In: River and Stream Ecosystems. (eds C. E. Cushing, K. W. Cummins & G. W. Minshall) pp. 659–90. Elsevier, Amsterdam.
Link W. A. & Sauer J. R. (1998) Estimating population change from count data:
application to the North American Breeding Bird Survey. Ecol. Appl. 8, 258–68. Mac Nally R. (1996). A winter's tale: Among-year variation in bird community
Mac Nally R. & Horrocks G. (2000). Landscape-scale conservation of an endangered migrant: The Swift Parrot (Lathamus discolor) in its winter range. Biol. Conserv. 92, 335–43.
Mac Nally R. & McGoldrick J. M. (1997) Landscape dynamics of bird communities in relation to mass flowering in some eucalypt forests of central Victoria, Australia. J. Avian Biol. 28, 171–83.
Mac Nally R. C. (1995) On large-scale dynamics and community structure in forest birds: lessons from some eucalypt forests of southeastern Australia. Philos. Trans. R. Soc. Lond. B. Biol. Sci. 350, 369–79.
Manly B. F. J. (1997). Randomization and Monte Carlo Methods in Biology, 2nd edition. Chapman & Hall, London.
Marchant S. & Higgins P. J. (eds). (1990) Handbook of Australian, New Zealand and Antarctic Birds Volume 1. Ratites to Ducks. Oxford University Press,
Melbourne.
Marchant S. & Higgins P. J. (eds). (1993). Handbook of Australian, New Zealand and Antarctic Birds Volume 2. Raptors to Lapwings. Oxford University Press. Maron M., Mac Nally R., Watson D. M., & Lill A. (2004) Can the biotic nestedness
matrix be used predictively? Oikos 106, 433–444
Meserve P. L., Kelt D. A., Milstead B. & Gutierrez J. R. (2003) Thirteen years of shifting top-down and bottom-up control. BioScience 53, 633–46.
Morin M. P. & Conant S. (1994) Variables influencing population estimates of an endangered passerine. Biol. Conserv. 67, 73–84.
Nicholls N. (1992) Historical El Niño/Southern Oscillation variability in the
Southern Oscillation. (eds H. F. Diaz & V. Markgraf) pp. 151–73. Cambridge University Press, Cambridge.
Pearce J., Ferrier S. & Scotts, D. (2001) An evaluation of the predictive performance of distributional models for flora and fauna in north-east New South Wales. J. Environ. Manag. 62, 171–84.
Piper S. D. & Catterall C. P. (2003) A particular case and a general pattern:
hyperaggressive behaviour by one species may mediate avifaunal decreases in fragmented Australian forests. Oikos 101, 602–14.
Pizzey G. & Knight F. (1997) The Field Guide to the Birds of Australia. Harper Collins Publishers, Sydney, Australia.
Post E. & Forchhammer M. C. (2002) Pervasive influence of large-scale climate in the dynamics of a terrestrial vertebrate community. BMC Ecol. 1, 1–7.
Pyke G. H. & Recher H. F. (1988) Seasonal patterns of capture rate and resource abundance for honeyeaters and silvereyes in heathland near Sydney. Emu 88, 33–42.
Recher H. F., Gowing G., Kavanagh R., Shields J. & Rohan-Jones W. (1983) Birds, resources and time in a tablelands forest. Proc. Ecol. Soc. Aust. 12, 101–23. Reid J. R. W. (1999) Threatened and Declining Birds in the New South Wales
Sheep-Wheat belt: 1. Diagnosis, Characteristics and Management. CSIRO Wildlife and Ecology, Canberra.
Rotenberry J. T. & Wiens J. A. (1980) Temporal Variation in Habitat Structure and Shrub Steppe Bird Dynamics. Oecologia 47, 1–9.
Sauer J. R., Peterjohn B. G., & Link W. A. (1994) Observer differences in the North American Breeding Bird Survey. The Auk 111, 50–62.
Schodde R. (1982) Origin, adaptation and evolution of birds in arid Australia. In: Evolution of the Flora and Fauna of Arid Australia. (eds W. R. Barker & P. J. M. Greenslade) pp. 191–224. Peacock Publications, South Australia.
Smith P. G. R. (1984) Observer and annual variation in winter bird population studies. Wilson Bull. 94, 561–74.
Tanaka L. K. & Tanaka S. K. (1982) Rainfall and seasonal changes in arthropod abundance on a tropical oceanic island. Biotropica 14, 114–123.
Traill B. J. & Duncan S. (2000) Status of birds in the New South Wales temperate woodlands region. Consultancy report to the NSW National Parks and Wildlife Service. Australian Woodlands Conservancy, Victoria.
Veerman P. J. (2003) Canberra birds: A report on the first 21 years of the Garden Bird Survey. P. J. Veerman, Canberra.
Virkkala R. (1991) Spatial and temporal variation in bird communities and populations in north-boreal coniferous forests: a multiscale approach. Oikos 62, 59–66. Watson D. M., Mac Nally R. & Bennett A. F. (2000) The avifauna of severely
fragmented, Buloke Allocasuarina luehmanni woodland in western Victoria, Australia. Pac. Conserv. Biol. 6, 46–60.
Wiens J. A. (1973) Pattern and process in grassland bird communities. Ecol. Monogr.
43, 237–70.
Wiens J. A. (1994) Habitat fragmentation: island v landscape perspectives on bird conservation. Ibis 137, S97–S104
Wiens J. A. & Rotenberry J. T. (1981) Habitat associations and community structure of birds in shrubsteppe environments. Ecol. Monogr. 51, 21–41.
Table 1 Species that changed significantly (P < 0.05) in abundance (mean no. individuals recorded per site ± SE) between Survey Period 1 (SP 1) and Survey Period 2 (SP 2) (Wilcoxon signed-rank test). †Introduced species. Effect size is Cohen’s d.
Mean no. individuals/site
Species SP 1 SP 2 Wilcoxon z Effect size (%)
Crested Pigeon
Ocyphaps lophotes
0.96±0.29 3.46±0.80 3.039 81.6
Eastern Rosella
Platycercus eximius
0.27±0.14 1.12±0.39 2.038 56.0
Red-rumped Parrot
Psephotus haematonotus
1.42±0.28 10.35±1.97 3.900 122.3
Chestnut-rumped Thornbill
Acanthiza uropygialis
0.96±.26 3.46±0.40 2.206 63.1
Yellow-rumped Thornbill
Acanthiza chrysorrhoa
2.08±0.33 13.42±2.54 3.867 122.6
Yellow Thornbill
Acanthiza nana
2.85±0.50 8.04±1.73 3.243 80.1
Southern Whiteface
Aphelocephala leucopsis
0.15±0.12 2.31±0.93 2.673 63.7
Singing Honeyeater
Lichenostomus virescens
1.08±0.46 3.00±0.79 3.106 58.4
White-fronted Honeyeater
Phylidonyris albifrons
0.54±0.13 2.92±0.82 2.632 80.0
Hooded Robin
Melanodryas cucullata
1.39±0.29 2.62±0.61 2.028 50.1
Varied Sittella
Daphoenositta chrysoptera
0.58±0.15 4.73±1.01 3.511 112.5
Willie Wagtail
Rhipidura leucophrys
1.81±0.38 2.96±0.46 2.021 53.6
White-winged Triller
Lalage sueurii
European Goldfinch
Carduelis carduelis
0.46±0.21 1.92±0.95 2.222 41.5
House Sparrow
Passer domesticus†
2.69±0.59 9.19±2.16 3.201 80.5
Rufous Songlark
Cinclorhampus mathewsi
Table 2 Mean minimum species turnover per site and mean change in distribution per species for all species combined and for sedentary, nomadic and
migratory species (± SE). Distribution change considers only those species that were recorded in at least one site during both survey periods.
Category Turnover Distribution change
All species 63±2% 68±4%
Sedentary 57±3% 60±5%
Nomadic 79±4% 81±6%
Table 3 Results of paired t-test comparisons of mean minimum species turnover and heterogeneous variances t-test comparisons of distribution change between bird movement categories. *Significant at P < 0.05
Comparison Turnover Distribution change
d.f. t d.f t
Sedentary v nomadic 25 4.593* 21.9 2.730*
Sedentary v migratory 25 3.323* 25.3 3.430*
Table 4 Species whose distribution among sites changed significantly less than expected (P < 0.05) on the basis of a random redistribution between survey periods.
Change in distribution (%)
Observed Randomized
Species Mean
Lower 2.5% C.I.
Upper 97.5% C.I.
Brown Treecreeper
Climacteris picumnus
30 79 58 94
Variegated Fairy-wren
Malurus lamberti
0 92 80 100
Yellow Thornbill
Acanthiza nana
20 49 29 56
Spiny-cheeked Honeyeater
Acanthagenys rufogularis
38 86 56 100
Varied Sittella
Daphoenositta chrysoptera
Victoria
Australia
[image:43.595.100.334.87.240.2]Study area
Survey Period 1 Survey Period 2
1988 1990 1992 1994 1996 1998 2000 2002 700
600
400
200
0 500
300
100
Annu
al
rainfal
l to
tal (m
[image:44.595.90.344.111.269.2]m)