Hyperlinked Concept Map Enhancements for
Electronic Study Materials
Mark Phythian
University of Southern Queensland, Toowoomba, Australia [email protected]
Jishu Das Gupta
University of Southern Queensland, Toowoomba, Australia [email protected]
Abstract: The use of topic maps and concept maps has long been encouraged by
instructional designers as a means of providing an overview of content in study materials. Educational theory and practice affirm the effectiveness of concept mapping: as a concise summary of a body of knowledge; as a practical means by which students can construct and record their own knowledge; and as a means of evaluating student understanding. This paper presents the aims, methodology and initial findings of a project commenced in Semester 1 2008, to include hyperlinked concept maps as an enhancement to electronic study materials. The project aims to evaluate their effectiveness: in improving student understanding of the concepts in the course; and as a means of navigating and accessing electronic study materials. The course of study is in the field of Microcomputer Design.
Introduction
Scaffolding a student’s understanding of concepts, the relationships between those concepts and the relevance of technical content rate among some of the more difficult teaching tasks. An equally difficult task can be assessing the extent to which students achieve understanding of those concepts (Darmofal, Soderholm and Brodeur, 2002). While graphical representations of conceptual information have been in use for decades, modern electronic authoring tools now make it possible for a
hyperlinked concept map to function as an interface between the student and the course content. In this project concept maps representing all key concepts of the course content were integrated with electronic study materials to serve: as a summary of the concepts and their relationships; as a set of navigation pages; and as a means of accessing course content. In this form the concept maps provide an alternate (non-linear) means for the student to access:
• traditional course content - text and images, technical data
• multi-media content – audio, video, recorded lectures
• computer software – to run examples
• online quizzes – for self assessment
• relevant websites – for current and authentic case studies
• sub-concept maps
Concept Mapping
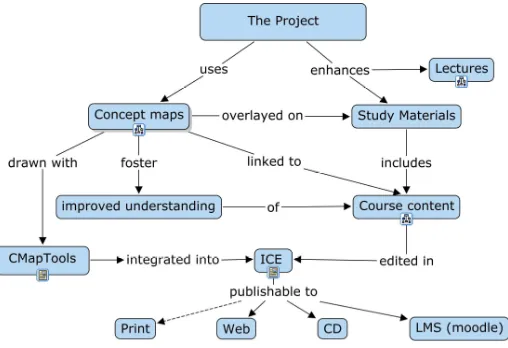
[image:2.595.171.425.146.320.2]A concept map is a graphical tool for organising and representing knowledge. It consists of boxes containing labels (concepts), interconnected by annotated links/arrows that describe the relationships between concepts, as shown in Figure 1. Information is usually arranged in a hierarchical manner, but can be used to illustrate a process or sequence (Novak and Cañas, 2006).
Figure 1: A concept map outlining the project
“Concept maps can be used in a single course to show the relationships between topics within a chapter and to show how the material in several chapters is related. Concept maps have proven to be an effective tool to improve the effectiveness of lectures and to help students achieve a greater depth of understanding of course material.” (Cornwell, 2000)
Concept maps can be used to improve understanding by: having students learn from a reference set of concept maps drawn by experts in the field; and/or having students develop their own concept maps. Turns, Atman and Adams (2000) report that requiring students to construct their own concept maps can be useful in assessing a student’s understanding at a course level:
• to quickly gauge understanding in a class room – initial and acquired knowledge
• in graded assessment - comprehensiveness, level of detail and complexity of a Concept Map
• to characterise learning – that is what students perceive they are learning
This project utilised both approaches: by providing a reference set of concept maps covering the course content and encouraging students to extend these maps and create their own concept maps.
Methodology
Map creation
Creating a reference set of concept maps for a field begins by creating a comprehensive glossary of concepts and terms. The author then poses a Focus Question that clearly specifies the issue the concept map set will address, for example: ‘What hardware and software design tools, technical knowledge and methodologies are required to design a microcomputer system?’. The author then identifies the key concepts that apply to this domain, usually 15 to 25 concepts, and orders them from the most inclusive to the most specific. At this point a preliminary map is drawn, laying out concepts in a loose hierarchy from most general to least general down the page.
The steps outlined above can be completed using a computer program or simply with a set of sticky notes laid out on a larger sheet of paper. A more detailed guide for creating concept maps can be found in Novak and Cañas (2006).
Authoring
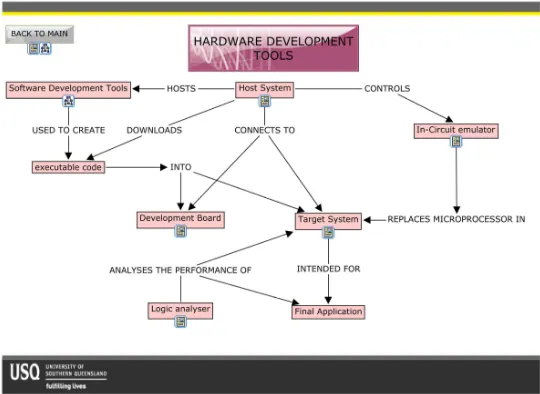
[image:3.595.162.432.242.439.2]Many authoring tools are capable of drawing concept maps; fewer can integrate hyperlinks and export to a webpage; even fewer are free. Arguably the pick of the tools is CmapTools, by the Institute for Human and Machine Cognition (IHMC, 2008). This free application provides authoring capability for single concept maps or a complete ontology of many maps. It is very simple to use and allows the sort of presentation editing capability one expects in similar drawing packages, plus the ability to add hyperlinks to any electronic resource and between maps. Some of its other features include keyword search ability, recording of map construction sequences and exporting to several document formats. A sample of what is achievable with CmapTools and some basic graphics is shown in Figure 2.
Figure 2: A sample map from Embedded Systems Design as produced by CmapTools
The study materials used in this project were part of an existing print based external/correspondence study package for the course titled ‘Embedded Systems Design’. Original source documents in Framemaker were converted to Open Office format as a suitable source for editing with the Integrated Content Environment (ICE) system. ICE is an open source, content management system under development at the University of Southern Queensland (USQ, 2008) which can export content in several forms for distribution via website, CD or print; all under full version control.
Concept maps authored with CmapTools were integrated with the course materials by the addition of hyperlinks, to course content within ICE. (Note the linkable icons under most concepts in Figure 2.) Concept maps were then exported from CmapTools as web pages into the resource area of the ICE file system, where hyperlinks were added from the study materials to the concept maps. In the latest version of ICE these concept maps can be positioned and navigated separately from the content, or inserted within a section of study material as a summary of and method of navigation into that section. Resources included with the course such as power point lecture slides, technical documentation, examples of program source code etc, were also hyperlinked from concept maps to place these elements in context and at the finger tips of the student.
Publishing
external students was tempered by the current requirement that they be provided with printed study materials. Printery lead times meant that these print materials did not include concept maps. Guidance for students
At the commencement of the semester students were introduced to concept maps via an explanation and series of exercises referred to as the Concept Map Primer. This power point series explained the structure of concept maps, their purpose, how to read concept maps and how they were to be employed in the study materials – both as a summary and as a navigation tool. Students were then given instruction on how to draw concept maps and a few exercises requiring them to create a concept map from a given set of terms/concepts. For example: one exercise provided the terms – car, driver, brake, accelerator, steering wheel, road, other cars, pedestrians etc – and they were posed the focus question ‘How do you drive a car safely down a road?’
The final exercise in this introduction required the students to construct a concept map from a set of terms/concepts selected from the Embedded Systems Design course itself. The intention was two-fold: to gauge the student’s initial level of understanding in the field; and as a benchmark for comparison to results from the same exercise repeated at the end of the semester. Quite predictably the early maps created by most students exhibited limited links between concepts and even less annotation, showing minimal understanding of the relationships between concepts. This approach, also used by Ellis, Rudnitsky and Silverstein (2004),allows the lecturer and the students themselves to gauge the student’s initial level of understanding and provides a foundation on which students can extend their knowledge in the field.
This introduction to concept mapping lead directly into the lecturer presenting an overview of the course using the set of reference concept maps. It was at this point that the hyperlinked concept map interface was introduced to the students, along with an explanation of its function and anticipated manner of use. The instructions given to the student were: to develop an overview each section of the study materials by reading the associated concept map; to hyperlink through the map to the course material – particularly for any concepts with which they were unfamiliar; to read a definition or short section of the material - sufficient to understand the term/concept; to return to the concept map and re-read the map to establish an appreciation how the concepts were related. From this point students could read the course materials in a traditional linear fashion, access the content via the concept maps in a self directed fashion, or use some combination of the two approaches.
Evaluation
At the commencement of the course all 34 external and 18 on-campus students were informed of the project, and that the effectiveness of the concept map enhancements and their means as a navigation / access tool was to be evaluated by an optional survey instrument and subsequent interviews.
Approximately half of each cohort of students completed the survey for a total of 23 respondents. The survey covered some demographic information, the effectiveness of the Concept Map Primer, the presentation of the maps, the frequency of use of maps for a small range of purposes, the perceived benefit of the maps and the students’ preferences for extending the use of concept maps.
Results
Demographic
The classifications of the demographic section identified external/on-campus students; year of study; VARK learning style preferences; and if they had used concept maps before. This information was used to verify that no particular group of students had significantly polarized views.
Effectiveness of Concept Map Primer
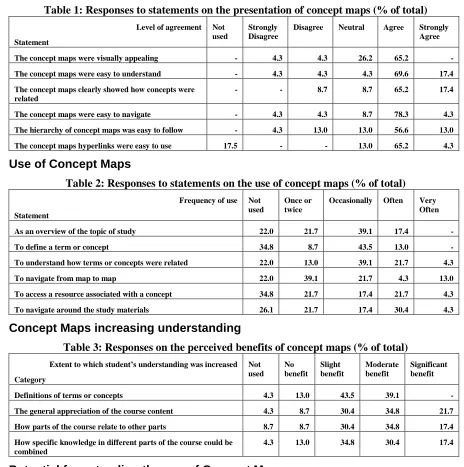
Tables 1 to 3 summarise the results of the survey for the following three survey sections. Presentation of Concept Maps
Table 1: Responses to statements on the presentation of concept maps (% of total)
Level of agreement Statement
Not used
Strongly Disagree
Disagree Neutral Agree Strongly Agree
The concept maps were visually appealing - 4.3 4.3 26.2 65.2 - The concept maps were easy to understand - 4.3 4.3 4.3 69.6 17.4 The concept maps clearly showed how concepts were
related
- - 8.7 8.7 65.2 17.4
The concept maps were easy to navigate - 4.3 4.3 8.7 78.3 4.3 The hierarchy of concept maps was easy to follow - 4.3 13.0 13.0 56.6 13.0 The concept maps hyperlinks were easy to use 17.5 - - 13.0 65.2 4.3
Use of Concept Maps
Table 2: Responses to statements on the use of concept maps (% of total)
Frequency of use Statement
Not used
Once or twice
Occasionally Often Very Often
As an overview of the topic of study 22.0 21.7 39.1 17.4 - To define a term or concept 34.8 8.7 43.5 13.0 - To understand how terms or concepts were related 22.0 13.0 39.1 21.7 4.3 To navigate from map to map 22.0 39.1 21.7 4.3 13.0 To access a resource associated with a concept 34.8 21.7 17.4 21.7 4.3 To navigate around the study materials 26.1 21.7 17.4 30.4 4.3
Concept Maps increasing understanding
Table 3: Responses on the perceived benefits of concept maps (% of total)
Extent to which student’s understanding was increased Category
Not used
No benefit
Slight benefit
Moderate benefit
Significant benefit
Definitions of terms or concepts 4.3 13.0 43.5 39.1 - The general appreciation of the course content 4.3 8.7 30.4 34.8 21.7 How parts of the course relate to other parts 8.7 8.7 30.4 34.8 17.4 How specific knowledge in different parts of the course could be
combined
4.3 13.0 34.8 30.4 17.4
Potential for extending the use of Concept Maps
The last section of the survey investigated the students’ preferences for extending the use of concept maps. In response to the statement ‘I would benefit greatly from the inclusion of concept maps in other courses’, approximately 61% agreed or strongly agreed, while 39% were neutral. In response to the statement ‘Concept maps that covered even more detail of the course would help me understand the material better’, approximately 45% agreed or strongly agreed, while 52% were neutral.
Discussion
Analysis of the survey results reveal that students definitely perceive a benefit from the inclusion of concept maps in their study materials. Of the respondents: an average of 36% responded that they gained a slightly better understanding, 36% a moderately better understanding and 15% a significantly better understanding of the course material.
that this was because students had made a distinction between their initial evaluation of the concept maps under ‘presentation’ and the way in which the maps were ‘used’ during their studies. This occurrence indicates the need to review the survey instrument prior to its next use.
Conclusion
This study has re-affirmed the effectiveness of concept maps in assisting students to understand a set of concepts and their relationships. Over two thirds of respondents indicated a strong preference to extend the use of concepts into other courses. Similar numbers indicated that the introduction to concept mapping presented provided valuable guidance on this methodology.
Students used the hyperlinks in the concept maps more often to gain an understanding of the course, topics and concepts, than as a means of navigating or accessing the course content. Feedback from interviews suggested this was due to the lack of tracking on which material was accessed, a desire by the student to ‘make sure they covered all the material’ and a tendency by most students to continue to approach their studies a traditional linear fashion. Despite this about 25% of students used the
hyperlinks as a form of navigation often or very often, indicating some perceived value to this capability. This level of usage may possibly reflect a lack of richness in the linked resources.
The initial results of this study are encouraging and an extension of the project is already planned into two other courses in 2009. More detailed analysis of other aspects of this study is in progress. References
Cornwell, P. J., (2000). Concept maps in the mechanical engineering curriculum. Proceedings of the 2000
American Society of Engineering Education Annual Conference and Exposition, 2000.
Darmofal, D. L., Soderholm, D. H., & Brodeur, D. R., (2002). Using concept maps and concept questions to enhance conceptual understanding. Proceedings of the 32nd ASEE/IEEE Frontiers in Education
Conference, (pp. 1-6). Boston, MA: IEEE.
Ellis, G., Rudnitsky, A., Silverstein, B., (2004). Using concept maps to enhance understanding in Engineering Education. International Journal of Engineering Education, 20(6), pp 1012-1021, 2004.
IHMC, (2008). CmapTools Web Site. Institute for Human and Machine Cognition. Accessed at
http://cmap.ihmc.us/ on 14 Aug 2008.
Martínez-Torres M. R., Barrero García F. J., Toral Marín S. L., Gallardo Vázquez S., (2005). A digital signal processing teaching methodology using concept-mapping techniques. IEEE Transactions on Education, 48(3), pp. 422-429, August 2005.
Novak, J. D. & A. J. Cañas, (2006). The theory underlying concept maps and how to construct them. Technical
Report IHMC CmapTools 2006-01, Florida Institute for Human and Machine Cognition, 2006. Accessed at: http://cmap.ihmc.us/Publications/ResearchPapers/TheoryUnderlyingConceptMaps.pdf on 14 Aug 08. Turns, J., Atman, C.J., Adams, R. (2000). Concept maps for engineering education: A cognitively motivated tool
supporting varied assessment functions. IEEE Transactions on Education, 43(2), May 2000, pp. 164–173. USQ, (2008). Integrated Content Environment. University of Southern Queensland. Accessed at
http://ice.usq.edu.au/ on 14Aug 2008.
Vega-Riveros J. F., Marciales G. P., M. Martínez, (1998). “Concept maps in engineering education: A case study,” Global Journal of Engineering Education, 2(1), pp. 21–27, 1998.
Acknowledgements
The authors wish to acknowledge the support of the Faculty of Engineering and Surveying and the Learning Futures Innovation Institute of the University of Southern Queensland, Toowoomba Australia during this project.
Copyright statement