University of Southern Queensland
Faculty of Engineering and Surveying
Fracture Toughness of Glass Powder Reinforced Vinyl
Ester Resin
A dissertation by
Geoffrey Korowa
In fulfilment of the requirements of
Courses ENG4111 and ENG4112 Research Project
Towards the degree of
Bachelor of Engineering (Mechanical)
i
Abstract
Composite materials are widely used in industry. Composites are used because they utilise a combination of materials which allows cost to be lowered, while at the same time, giving a new material with improved properties.
The aim of this project was to determine which percentage of glass powder (by weight) would give the highest fracture toughness.
ii
iii
Certification
I certify that the ideas, designs and experimental work, results, analysis and conclusions set out in this dissertation are entirely my own efforts, except where otherwise indicated and acknowledged.
I further certify that the work is original and has not been previously submitted for assessment in any other course or institution, except where specifically stated.
Geoffrey Korowa
Student Number: 0050027542
Signature
iv
Acknowledgements
I would like to thank all those involved with the completion of this project, and those who helped and guided me through the various stages.
Firstly, I would like to thank my Supervisor, Dr Harry Ku, whose help made this project as successful as it was. Thank you for your guidance and mentoring through this project. Your advice has made this project a great learning experience to complete my years at university.
I would also like to thanks Mohan Trada, whose technical experience has been a great help in the practical aspect of the project. The knowledge and skills you shared with me will be something I take with me after completing university.
v
Table of Contents
Abstract ... i
Limitations of use ...ii
Certification ...ii
Certification ... iii
Acknowledgements ... iv
Table of Contents ... v
List of Appendices ... ix
List of Figures ... x
List of Tables ... xiii
List of Tables ... xiii
1 Introduction ... 1
1.1 Introduction ... 1
1.2 Project Topic ... 1
1.3 The Problem ... 1
1.4 Project Background ... 2
1.5 Project Objectives and Aims ... 2
2 Literature Review... 4
2.1 Introduction ... 4
2.2 Introduction to Vinyl Ester Resins ... 4
2.3 Vinyl Ester Resin Used ... 5
2.4 Vinyl Ester Resin and Catalyst ... 6
vi
2.6 Glass Powder Used ... 7
2.7 Fracture Toughness ... 8
2.8 Plane Strain Fracture Toughness ... 10
2.9 Short Rod and Short Bar Method ... 10
2.9.1 Introduction to Short Rod and Short Bar Method... 10
2.9.2 Short Rod and Short Bar Geometry ... 11
2.9.3 Short Rod and Short Bar Calibration ... 16
2.9.4 Short Bar Testing ... 19
2.10 Determining Fracture Toughness ... 20
2.11 Curing and Post Curing ... 21
2.12 Scanning Electron Microscope Analysis ... 22
2.12.1 Introduction to Scanning Electron Microscopy ... 22
2.12.2 Cleaning Sample surfaces ... 22
2.12.3Dehydration of Samples... 23
2.12.4 Coating Samples ... 23
2.12.5 Sputter Coating ... 24
2.13 Works of Others ... 26
3 Project Methodology ... 28
3.1 Introduction ... 28
3.2 Mould and Mould Preparation ... 28
3.3 Sample Production ... 30
3.4 Measuring materials ... 30
3.5 Mixing the Materials ... 31
3.6 Filling the Mould ... 33
3.7 Curing and Sample Removal ... 33
vii
3.9 Short Bar Tests ... 35
3.9.1 Preparation for Testing ... 35
3.9.2 Testing ... 36
3.9.3 Data Retrieved ... 38
3.10 Microscopic Analysis ... 39
3.10.1 Sample Preparation ... 39
3.11 Improvements in Methodology ... 40
3.12 Conclusion ... 41
4 Consequential Effects ... 42
4.1 Introduction ... 42
4.2 Identification ... 42
4.3 Preparation ... 42
4.4 Risks ... 43
5 Results and Discussion ... 46
5.1 Introduction ... 46
5.2 Short Bar Test ... 46
5.3 Fracture Toughness ... 47
5.4 Comparison to Previous Works ... 49
5.5 Scanning Electron Microscopy (SEM) Analysis ... 50
5.5.1 0% Glass Powder ... 51
5.5.2 20% Glass Powder ... 59
5.6 Conclusion ... 68
6 Conclusion ... 69
6.1 Introduction ... 69
6.2 Fracture Toughness ... 69
viii 6.4 Conclusion and Further Work ... 70
ix
List of Appendices
Appendix A – Project Specification ... 73
Appendix B – Raw Data ... 75
Appendix C – Data Analysis ... 139
x
List of Figures
Figure 2.1: Schematic Drawing of Fracture Toughness Specimens with Edge and
Internal Flaws ... 9
Figure 2.2(a): Short Rod Specimen with straight chevron slots. ... 12
Figure 2.2(b): Short Bar Specimen with straight chevron slot. ... 13
Figure 2.3(a): Short Rod Specimen with curved slot. ... 14
Figure 2.3(a): Short Rod Specimen with curved slot. ... 15
Figure 2.4: Cross-section dimensions of short bar specimen ... 16
Figure 2.5: Curved and straight chevron slots superimposed. Tangent at critical crack length, ac ... 18
Figure 2.6: Chevron angle θ and initial crack length ao for curved chevron slot specimens ... 18
Figure 2.7: Load applied vs. crack length ... 20
Figure 2.8: Setup of the Sputter Coater ... 25
Figure 2.9: Sputter Coater chamber with a specimen ... 25
Figure 2.10: Fracture toughness of PF-E-SPHERES with varying percentages by weight of slg ... 27
Figure 3.1: Total mould assembly with chevron slots ... 29
Figure 3.2: Mixing the materials ... 32
Figure 3.3: Samples in the ventilation chamber ... 32
Figure 3.4: Specimens in conventional oven ... 34
Figure 3.5: Eurotherm programmer ... 35
Figure 3.6: Filing down a specimen to required length ... 36
Figure 3.7: Specimen loaded onto MTS 810 ... 37
Figure 3.8: The MTS 810 during short bar test ... 37
Figure 3.9: Raw data obtained from the testing ... 38
xi
Figure 3.11: Gold coated specimens after sputter coating ... 40
Figure 5.1: Fracture toughness of glass powder reinforced vinyl ester resin... 48
Figure 5.2: Fracture toughness of PF/E-SPHERES with varying percentage by weight of slg ... 50
Figure 5.3: Locations of SEM analysis, 0% glass powder ... 51
Figure 5.4: Position 1 at 200x magnification, 0% glass powder ... 53
Figure 5.5: Position 1 at 1000x magnification, 0% glass powder ... 53
Figure 5.6: Position 1 at 2000x magnification, 0% glass powder ... 54
Figure 5.7: Position 2 at 200x magnification, 0% glass powder ... 54
Figure 5.8: Position 2 at 1000x magnification, 0% glass powder ... 55
Figure 5.9: Position 2 at 2000x magnification, 0% glass powder ... 55
Figure 5.10: Position 3 at 200x magnification, 0% glass powder ... 56
Figure 5.11: Position 3 at 1000x magnification, 0% glass powder ... 56
Figure 5.12: Position 3 at 2000x magnification, 0% glass powder ... 57
Figure 5.13: Position 4 at 200x magnification, 0% glass powder ... 57
Figure 5.14: Position 4 at 1000x magnification, 0% glass powder ... 58
Figure 5.15: Position 4 at 2000x magnification, 0% glass powder ... 58
Figure 5.16: Locations of SEM analysis, 20% glass powder ... 59
Figure 5.17: Position 1 at 200x magnification, 20% glass powder ... 61
Figure 5.18: Position 1 at 1000x magnification, 20% glass powder ... 62
Figure 5.19: Position 1 at 2000x magnification, 20% glass powder ... 62
Figure 5.20: Position 2 at 200x magnification, 20% glass powder ... 63
Figure 5.21: Position 2 at 1000x magnification, 20% glass powder ... 63
Figure 5.22: Position 2 at 2000x magnification, 20% glass powder ... 64
Figure 5.23: Position 3 at 200x magnification, 20% glass powder ... 64
Figure 5.24: Position 3 at 1000x magnification, 20% glass powder ... 65
xii
Figure 5.26: Position 4 at 50x magnification, 20% glass powder ... 66
Figure 5.27: Position 4 at 200x magnification, 20% glass powder ... 66
Figure 5.28: Position 4 at 1000x magnification, 20% glass powder ... 67
xiii
List of Tables
Table 2.1: Typical properties of Glass Powder ... 7
Table 2.2: Properties of SPHERICAL® 60P18 Hollow Glass Spheres ... 8
Table 2.3: Summary of slot geometry study results (Barker, 1981) ... 19
Table 2.4: Fracture toughness of different percentages by weight of slg reinforced phenolic resin ... 27
Table 3.1: Percentages by weight... 31
Table 4.1: Risk Assessment ... 45
Table 5.1: Peak Load... 46
Table 5.2: Fracture Toughness ... 48
Table 5.3: Fracture toughness of different percentage by weight of SLG reinforced phenolic resin ... 49
Table C1: Peak Load ... 139
Table C2: Fracture Toughness ... 140
1
1 Introduction
1.1 Introduction
This chapter will describe the purpose, background and processes involved in the project. The aim of this project is to find the percentage (by weight) of glass powder to vinyl ester resin, which will give the best fracture toughness.
1.2 Project Topic
Fracture toughness of glass powder reinforced vinyl ester resins post-cured in a
conventional oven using short bar tests.
1.3 The Problem
2 testing by short bar tests and analysis of the test results has been carried out (Munz, 1981)
1.4 Project Background
Composite materials are widely used in industry. Composites are used because they utilise a combination of materials which allows cost to be lowered, while at the same time, giving a new material with improved properties.
Vinyl ester resins have established and increasing uses in industry. They are regarded for their strong chemical, corrosion and heat resistant properties, as well as their mechanical properties namely fatigue performance and high elongation. The addition of fillers changes structural properties and reduces costs. It can also minimise cracking and decomposition of thick parts of components. The most commonly used filler for vinyl ester resin is Type E fibreglass, however, other materials such as graphite, aramid, olefin, and ceramic fillers may also be used (Blankenship et al., 1989).
1.5 Project Objectives and Aims
3 In this project, the resin used will be the vinyl ester resin, Hetron 922 produced by Huntsman Composites, a division of Huntsman Chemical Company Australia Pty Ltd (Huntsman Composites, 2001). The accelerator used is methyl ethyl ketone peroxide (MEKP); this is an established and recommended accelerator (Blankenship et al., 1989).
Production of the samples will involve mixing the materials at room temperature. The mixture will then be poured into moulds of specified geometries, and allowed to cure in room temperature. After curing, the samples will be taken out of the moulds and post cured in a conventional oven. They will be post cured for four hours at 50° Celsius, then four hours at 80° Celsius, and finally two hours at 100° Celsius.
4
2
Literature Review
2.1 Introduction
This chapter will describe in detail the relevant literature involved in the undertaking of this project. This chapter will provide details about the materials used, curing and post curing, fracture mechanics and the short bar method, and testing.
The majority of the information in this chapter comes from published sources such as texts, and journals. Other sources of information are USQ study materials and previous reports by students. Also, Material Safety Data Sheets (MSDS) are supplied by companies for use with their products.
2.2 Introduction to Vinyl Ester Resins
5 Properties of vinyl ester resins can vary depending on various factors. These factors include (Blankenship et al., 1989):
1. Epoxy resin structure, which determines mechanical and thermal properties, as well as corrosion;
2. The unsaturated acid, which affects reactivity and chemical resistance; and 3. The diluting monomer, which affects viscosity, reactivity, and chemical
resistance
Vinyl esters are more costly than polyesters, and because of this, they are more often used in applications that specifically require superior corrosion, thermal, and fatigue properties. Different techniques are used to manufacture corrosion resistant tanks, piping, ducts, and a wide range of fittings. Aggregate and sand mixtures with vinyl ester resins form strong, chemically resistant polymer concrete used in waste handling applications. High volume fabrication techniques take advantage of vinyl esters low viscosity and adjustable curing time in the production of composites of automotive, industrial and military applications (Blankenship et al., 1989). It is evident from these applications that vinyl esters are a player in the composites field.
2.3 Vinyl Ester Resin Used
6 Some of the features of Hetron 922 include (Sweet, 2002),
Excellent corrosion and chemical resistance; Excellent impact strength;
High tensile elongation; and
FDA compliance for food contact (FDA regulation Title CFR 177.2420) Some applications include corrosion resistant tanks, pipes, vats, vessels, pumps, and other equipment, as well as coatings and linings.
It is recommended that post curing is done for maximum chemical and heat resistance.
2.4 Vinyl Ester Resin and Catalyst
The curing of vinyl ester resin is attained by radical polymerisation with a peroxide. Methyl Ethyl Ketone Peroxide (MEKP) is an organic peroxide that is commonly used with vinyl ester resin; this is the catalyst (or accelerator) used for the polymerisation of the vinyl ester resin. The ratio of resin to catalyst was selected to be 98% to 2%. This is recommended for boat layups at moderate temperatures, i.e. 20° to 25°C (Sweet, 2002).
2.5 Glass Powder
7
Table 2.1: Typical properties of Glass Powder
Typical Properties
Shape Spherical
Colour White
Composition Proprietary Glass
Density 1.1 g/cc and 0.6g/cc
Particle Size Mean Diameter 11 and 18 microns
Hardness 6 (Moh‟s Scale)
Chemical Resistance Low alkali leach/insoluble in water
Crush Strength >10,000 psi
The addition of glass powder to epoxy, compounds, fibreglass reinforced plastics, and urethane castings lowers costs and also gives weight reduction. It also improves impact resistance. Glass powder hollow spheres have insulating properties and improve thermal shock and heat affected areas.
2.6 Glass Powder Used
8
Table 2.2: Properties of SPHERICAL® 60P18 Hollow Glass Spheres
True Density (g/cc) 0.60
Mean volume 16-20
Particle Size (µm) D10 6-10
D50 15-19
D90 28-32
Working Pressure 10 Volume % Loss 8,000psi
Appearance White powder
Composition Fused Inorganic Oxides
Shape Spherical, Non-Porous
2.7 Fracture Toughness
9
Figure 2.1: Schematic Drawing of Fracture Toughness Specimens with Edge and Internal Flaws
Applying fracture mechanics to figure 2.1, the stress intensity factor, K, is defined as,
K = fσ a (1)
where f is the geometry factor of the specimen and flaw, σ is the applied stress, and a is the flaw size. If the dimension of the flaw size is known, tests can be performed to determine the K value which causes a crack to grow and fail. This is known as the critical stress intensity factor, and is given as,
10 The critical stress intensity factor, Kc, of a material is defined as its fracture toughness, and has the units MPa m; Kc is the K required to propagate a crack (Ku et al., 2006; 2007; 2008).
For specimens where the width is assumed „infinite‟, the geometry factor, f = 1; for samples with „semi-infinite‟ width, f = 1.1 (Askeland 1998). Fracture toughness of thin specimens will depend on the specimen thickness, but as thickness increases, the thickness will have less effect on the fracture toughness.
2.8 Plane Strain Fracture Toughness
Plane strain exists when a specimen‟s thickness is large enough that the crack‟s size will not influence the specimens fracture toughness. In plane strain, there will be no resulting strain perpendicular to the front and back faces of the sample. This means the load will be purely a tensile load, also known as mode I loading (Juvinall & Marshek, 2001). The fracture toughness will become the plane strain fracture toughness, i.e. Kc will be KIc.
KIc = fσ a (3)
Brittle materials have low KIc, while ductile materials have high KIc values. Plane strain fracture toughness is an important property and can be affected by a number of factors including, temperature, microstructure, and strain rate. KIc decreases with increase strain rate, and decrease temperature (Askeland 1998).
2.9 Short Rod and Short Bar Method
11 The fracture toughness of a material is determined using the ASTM standard, ASTM E 399-78. This standard requires the maximum load a material can take before failure. The short rod or short bar method is the preferred method of finding the peak load a specimen reaches before breaking. The short rod and short bar methods were mainly developed to determine the fracture toughness of brittle materials (Barker, 1977). The short rod method uses a circular cross section specimen, while the short bar method has a rectangular cross section. Selection of the geometry to be used depends on manufacturing equipment available. It may be used on a number of materials including metals, ceramics, polymers and rocks (Barker, 1981). This method is preferred because it uses a real crack, as well as reducing the size of the specimen. The short rod and short bar methods reduce the cost of testing and also eliminates residual stresses since no fatigue pre-cracking is required (Barker, 1980).
2.9.2 Short Rod and Short Bar Geometry
12
13
14
15
16 Figure 2.4 shows a more detailed diagram of the cross section of the short bar specimen.
Figure 2.4: Cross-section dimensions of short bar specimen
2.9.3 Short Rod and Short Bar Calibration
17 When machining the chevron slots in a curved specimen, it is much easier to do so by measuring the distance to the point of the chevron slot, ao, and the angle θ (Figure 2.4) than to see directly whether the slots pass through the tangent points correctly. Therefore, the values of ao and θ have been calculated as a function of the diameter of the saw blade used to cut out the slots. By using these dimensions, the specimen calibration is virtually always constant, regardless of specimen size. Figure 2.6 shows the functions plotted against each other.
18
Figure 2.5: Curved and straight chevron slots superimposed. Tangent at critical crack length, ac
19
Table 2.3: Summary of slot geometry study results (Barker, 1981)
2.9.4 Short Bar Testing
20 tip of the chevron slot. The load is applied continually at the specified rate, until the length of the crack reaches the critical crack length, ac. This is the breaking point of the specimen, and is the point where the peak load occurs. The load should decrease after this point. Figure 2.7 shows the cross section of the specimen along with the variation of load versus crack length.
Figure 2.7: Load applied vs. crack length
2.10 Determining Fracture Toughness
21 KIcSB =
W B Y F m * max
where Fmax = Peak load
Ym* = Compliance calibration according to ASTM E-399-78 B = Sample breadth
W = Sample width
The compliance calibration, Ym*, is calculated according to ASTM E-399-78. It is given by the equation (Munz, 1981),
Ym* = {-0.36 + 5.48ω + 0.08ω2 + (30.65 – 27.49ω + 7.46ω2) α0
+ (65.90 + 18.44ω + 9.76ω2) α 02}
2 1 0 0 1 ) -(1 ) -(
where ω =
H W
; α0 = W
a0
; α1 = W
a1
.
The values of a0 and a1 are shown in Figures 2.2(a), 2.2(b), 2.3(a) and 2.3(b).
2.11 Curing and Post Curing
22 this also gives faster curing times and is less sensitive to moisture effects (Blankenship et al., 1989).
2.12 Scanning Electron Microscope Analysis
2.12.1 Introduction to Scanning Electron Microscopy
Scanning electron Microscopy enables detailed imaging and analysis of surfaces of specimens. Samples usually need preparation before they may be examined due to the size and functional requirements of the scanning electron microscope (SEM). Ideally, samples should be clean, dry, conductive, and able to generate a signal. The size of a sample should ideally be one to two centimetres in diameter; samples large than this should be cut to smaller sizes. Samples with biological origins require more preparation than samples with biological samples; however, some non-biological specimens such as water pipes may contain traces of micro-organisms, thus classing that specimen as biological.
2.12.2 Cleaning Sample surfaces
23
2.12.3Dehydration of Samples
Any water in a sample will evaporate in the SEM causing damage to the sample, as well as contaminating the microscope; therefore, water has to be removed. There are a number of methods of removing water from a sample.
Air drying is suitable for most samples obtained from aqueous environments. However, if micro-organisms are present in the sample, they must be treated as biological and treated accordingly.
Solvent drying will dehydrate the sample and replace the water with the solvent. Ethanol, methanol and acetone are commonly used solvents. The solvents may be air dried, depending on the nature of the samples.
Critical point drying is the standard method for drying biological samples. It may also be used in some non-biological samples. Special equipment known as a critical point dryer is required.
Freeze drying is a less common method. Special equipment is required. The samples are frozen to -80 degrees Celsius and placed in a vacuum at low pressure, where the ice turns into vapour and is removed by the vacuum. This method is slow.
2.12.4 Coating Samples
When using scanning electron microscopy, the sample surface must be electrically and thermally conductive. Conductivity can be improved by coating the sample with a thin film of metal or carbon. This layer is usually 10-25 nm thick. A carbon coating is used if elemental analysis, while topographical imaging uses gold, platinum, or gold/palladium coatings.
24 electron beam and cause charging or flaring. The coating must be continuous to prevent the build up of charges in a sample. Samples consisting of lower atomic number elements (i.e. less reactive elements) tend to have insufficient secondary electrons and a metal coating is a good source of these electrons to give a good signal.
Sputter coating is used to gold coat samples. It allows all exposed areas of the sample to be coated, as it is a non-directional coating method.
Vacuum evaporation coating is used to carbon coat samples. It is a directional method and only coats the surfaces in direct line with the evaporative source. This method is therefore suitable for flat surfaces.
2.12.5 Sputter Coating
25
Figure 2.8: Setup of the Sputter Coater
26
2.13 Works of Others
27
Table 2.4: Fracture toughness of different percentages by weight of slg reinforced phenolic resin
Percentage by weight of
slg 0 15 20 25 30 35
Fracture toughness
MPa√m 8.72 10.5 12.5 9.62 8.82 8.12
(Standard deviation) (1.94) (0.80) (0.16) (0.24) (0.36) (0.67)
Figure 2.10: Fracture toughness of PF-E-SPHERES with varying percentages by weight of slg
28
3 Project Methodology
3.1 Introduction
This chapter will outline the process involved in the preparation, production, curing and post-curing, testing, and microscopic analysis of the samples. The underlying method implemented in this project was intentionally kept similar to previous years methods for the purpose of obtaining repeatable results. These processes were demonstrated in reports previously done by students, which were provided by the supervisor as a guide. Elements such as the materials, mould, and post curing were among the aspects kept constant. Production techniques have improved to give the best possible samples with the least possible defects. Production technique is something that can change, but the main aim of the specimen production was kept in sight.
3.2 Mould and Mould Preparation
The mould used in this project was the same as the mould used in previous year projects. This was to ensure the repeatability of results. The mould is made of Poly-vinyl chloride (PVC) which is essentially a plastic. The advantage of this is that it is tough, easy to construct, will hold its shape during curing, and has a slightly slippery surface allowing the cured mould to be removed with ease.
29 effect, represent the cracks in materials. The final mould (ready for sample production) is the combination of the mould, and the chevron sots.
Figure 3.1: Total mould assembly with chevron slots
30
3.3 Sample Production
During the casting process, a mould casts six specimens, all of the same percentage by weight of glass powder. These six specimens in the mould make up a sample. Therefore, eight samples are made, with each sample containing six specimens. The samples made will range from 0% glass powder to 35% glass powder, in increments of 5%.
3.4 Measuring materials
31
Table 3.1: Percentages by weight
Percentage Composite (g) Resin (g) MEKP (ml) Glass Powder (g)
0 900 882.0 18.0 0
5 900 837.9 17.1 45
10 900 793.8 16.2 90
15 900 749.7 15.3 135
20 800 627.2 12.8 160
25 800 588.0 12.0 200
30 800 548.8 11.2 240
35 800 509.6 10.4 280
3.5 Mixing the Materials
32 will actually start the curing process, making the mixture more viscous. When all three are mixed in together, the mixture can be poured into the mould.
Figure 3.2: Mixing the materials
The mixing was done in the ventilation chamber with the exhaust fan turned on. This allowed most of the fumes to escape the work environment. The windows were also opened to allow a flow of fresh air through the room.
33
3.6 Filling the Mould
Filling the mould can be a delicate process. Because the chevron slot in no rigid, it can move around when the mixture is poured into the mould, and slant toward one side of the mould. It is ideal for the chevron slot to remain fixed in the centre of the mould. This will give better, more reliable results from testing. To minimise this slanting, the mixture was poured in at an even rate from both sides of the slot. The mixture is also poured along the length of the mould at the same time, that is, all mould spaces are filled in at the same time, instead of one at a time. This is because the mixture seeped through the separating plates, into the next mould space. It was important not to overfill the moulds, as this would make it more difficult to remove the cured specimens. As well as this, it meant that the specimen‟s geometry would not be suitable for testing, and thus need alteration.
3.7 Curing and Sample Removal
The samples were left to cure in ambient conditions for three days. After this, they were removed from the mould. Removal from the mould, for some of the specimens, proved to be a bit hard. This was due to the fact that the resin had seeped through gaps in the mould assembly and had set. This made it hard to remove certain plates. The whole assembly had to be dismantled in order to remove the specimens. Once the specimens were removed, they were ready for post-curing.
3.8 Post-Curing
34 without interaction from anyone. It was observed however, to make sure the temperature did change after the prescribed time. All the specimens were able to fit into the oven at the one time, but care had to be taken to make sure they were evenly spaced. This meant the specimens could be evenly heated to the required temperature, without any uneven temperature regions.
Please note, care should always be taken when using the oven, as the temperature in the oven is high. The temperature on the controller was always checked before opening the oven door. The oven and specimens were allowed to cool before retrieving the specimens from the oven.
The oven was made by Steridium, which are commonly installed with Eurotherm controllers. The Eurotherm 3200 Series Controller user manual was used to program the controller to the desired requirements. The programming instructions may be seen in Appendix B.
35
Figure 3.5: Eurotherm programmer
3.9 Short Bar Tests
3.9.1 Preparation for Testing
36
Figure 3.6: Filing down a specimen to required length
3.9.2 Testing
The testing of the specimens was done using the MTS 810 Materials Testing System. The Machine was fitted with the appropriate parts to apply the load to a short bar specimen. The specimen was loaded into the machine as shown in Figure 4.7. The height of the fitting was adjusted so the edge of the specimen sat flush against it. Rubber bands were used to hold the specimens in place.
37
Figure 3.7: Specimen loaded onto MTS 810
38
3.9.3 Data Retrieved
Figure 3.9 Shows the raw data obtained from the testing. Looking at the figure, the point of interest is point F. This is the peak load, and will be used in the fracture toughness calculation.
Specimen Results: Name Value Units
Thickness 26.000 mm
Width 50.000 mm
Area 1300 mm^2
Peak Load 943 N
Peak Stress 0.73 MPa
Break Load 943 N
Break Stress 0.73 MPa
Elongation At Break 1.012 mm
Stress At Offset Yield 0.467 MPa
Load At Offset Yield 606.952 N
39
3.10 Microscopic Analysis
To further investigate the effects the glass powder had on the vinyl ester resin, the use of a scanning electron microscope was implemented. As USQ does not have a scanning electron microscope (SEM), the microscope analysis was done at Queensland University of Technology (QUT) in Brisbane.
3.10.1 Sample Preparation
The samples had to be prepped in order to fit into the SEM. They were prepared to the specifications for a dry, non-conductive sample without surface residue.
40
Figure 3.10: The required geometry for SEM analysis
Figure 3.11: Gold coated specimens after sputter coating
3.11 Improvements in Methodology
There are a number of aspects that can be improved in the methodology. The main improvement one can see is to do with the removal of the specimens from the moulds after they have been cured. In the current method, the wet mixture seeped through cracks and hardened, making the mould plates hard to remove. This could be
41 improved by making the mould from fewer pieces, or using a material that is more flexible. However, this will make it more expensive, and may not be worth investing in. Another solution would be to construct the mould, filling in the gaps along the plate slots with plasticine or something similar. This would stop the wet mixture from seeping through the gaps. The plasticine may react with or may be eaten away by the mixture, so this may not be suitable and would have to be investigated.
3.12 Conclusion
42
4 Consequential Effects
4.1 Introduction
In the project, risks are present which have to be identified and minimised. If the proper precautions are not taken, the consequences may include serious injury, damage to the environment, and damage to property. This chapter will analyse the potential dangers involved in the project, and steps taken to manage them.
4.2 Identification
In the production and testing of the samples, there are several risks that have to be identified in order to be eliminated or minimised. The materials used to create the samples themselves pose a danger. These materials can cause harm if not handled correctly. The samples require a chemical reaction to occur, hence heat may be involved. If the quantities used are incorrect, the reaction may prove violent or even explosive in an extreme case. The post curing process involves the use of an oven. The temperature will reach 100° Celsius; this can cause serious injury if negligence occurs. Finally, the testing of the specimens may cause injury. There are other dangers that are not so obvious that may cause injury or damage as well.
4.3 Preparation
Like any professional workplace, USQ takes measures to prevent injury occurring to people using its facilities; prevention of harm to people and damage to property is an important aspect. Before starting any practical work, a work permit must be granted. This will outline the work area, equipment, procedures, and special precautions. It may be revoked at any time. As well as a work permit, a material safety data sheet (MSDS) must be read and understood by the student. These provide all precautions to be taken, e.g. personal protective equipment (PPE), exposure limits, safe handling information, etc. As well, there is first aid information in case of an emergency. Students are also shown how to proceed when making samples. Correct techniques are demonstrated to eliminate any confusion.
43 mixing of the samples. The testing machine is fitted with a shield. This will protect form any flying chips resulting from the tensile testing.
4.4 Risks
Any activity that has risks involved has the potential to cause harm. After being identified, the appropriate action can be taken to minimise the likelihood of an accident occurring.
Resin Hazards
Hetron 922PAS and PAW will have adverse effects if in contact with eyes. Contact with skin will cause irritation and may also have adverse effects. Prolonged exposure to fumes will have adverse effects on respiratory system. Recommendations
Wear safety glasses. Wear rubber gloves.
Limit exposure time, wear respirator, open windows. Accelerator
Hazards
MEKP corrosive to eyes. Will cause blindness if not treated immediately. Corrosive to skin. Will cause burning if not treated immediately.
Harmful if swallowed. Recommendations
44 Hazards
Adverse effects on respiratory system if inhaled. Recommendations
Wear respirator when handling and filing. Reaction of resin and accelerator
Hazard
Reaction may be violent if wrong amounts of accelerator used. Recommendation
Consult MSDS for recommended amounts before mixing. Testing
Hazard
Chip may fly from specimen during testing. Recommendation
Close shield on testing machine when testing. Laboratory Dangers
Hazards
Risk of trip or slip in lab. Spills present on work areas. Recommendations
Keep laboratory.
45
Table 4.1: Risk Assessment
Tr
ip or sli
p in l
ab F lyi ng c hip fr om t est s pe cim en P otentially vi olent c he mi ca l re ac ti on R
esin and c
atalyst touchi ng e ye S kin conta ct wit h re sin a nd ca talyst Inha
lation of f
umes De sc rip tion o f Haz ar d
Low Low Low Medium Medium High L Risk
eve
l
P
eople in r
oom
P
eople in r
oom
P
eople in r
oom P erson mixi ng P erson mixi ng P
eople in r
oo m Pe op le at r isk W hole body All expose d pa rts B ody pa rts e xpose d to re ac ti on
Eye Skin
R espira tory syst em, br ain Par ts of B od y Ke
ep lab tidy
C
lose shield whe
n testi ng W ea r PP E, mi x be hind s hield W ea r s afe ty gl ass es W ea r glov es, we ar c ov er ed shoes, w ea r lo ng sl ee ve s hirt W ea r re spir ator, ope n wi ndows,
turn on e
46
5 Results and Discussion
5.1 Introduction
This chapter will analyse and discuss the results obtained from the short bar tests carried out. By using fracture mechanics with assumptions of linear elastic fracture mechanics, the fracture toughness was calculated. Comparison of the results to previous works will also be done. This will give an indication of whether the results are practical. Further to this, microscopic analysis will be done using Scanning Electron Microscopy (SEM). This will assist in determining reasons for failure as well as factors that improve fracture toughness.
5.2 Short Bar Test
Table 5.1 shows the raw data obtained from the short bar tests. Peak load was the only data obtained from the short bar test that was needed for the calculation of fracture toughness. From looking at the graphs, the peak loads are the highest point reached during the duration of the testing. The results of all the testing is given in Appendix A.
Table 5.1: Peak Load
F max (N)
Percentage 0 5 10 15 20 25 30 35
47
5.3 Fracture Toughness
The fracture toughness of the specimens is calculated using the formula,
KIcSB = W B
Y Fmax m*
Fmax is the peak force obtained from testing. The breadth, B, is given by design as 50 millimetres; the width, W, is determined to be 74 millimetres from actual measurements of the specimens. The compliance calibration, Ym*, is given by the formula,
Ym* = {-0.36 + 5.48ω + 0.08ω2 + (30.65 – 27.49ω + 7.46ω2) α0
+ (65.90 + 18.44ω + 9.76ω2) α 02}
2 1 0 0 1 ) -(1 ) -(
where ω =
H W
, α0 = W
a0 and α
1 = W
a1
. a0 and a1 (as shown in figure 2.2(b)) were measured as 72 and 26 millimetres respectively. The height, H, equals 38 millimetres. It was therefore determined that,
ω = H W = 38 74 =1.95
α0 = W a0 = 74 26 =0.35
α1 = W a1 = 74 72 =0.97
48
Table 5.2: Fracture Toughness
Fracture Toughness (MPa√m)
Percentage 0 5 10 15 20 25 30 35
Fracture
Toughness 31.12 31.71 31.63 38.62 33.49 33.23 31.53 31.61 (Standard
Deviation) (3.92) (1.06) (0.66) (0.76) (0.88) (0.46) (0.77) (0.85)
For visual representation, the results were plotted to provide a better comparison of the fracture toughness calculated. A five percent (5%) marker was included. This allowed unusually higher and lower measurements to be omitted from calculating fracture toughness. The fracture toughness of varying percentages of VE/Glass Powder post cured in a conventional oven is given in Figure 5.1.
Figure 5.1: Fracture toughness of glass powder reinforced vinyl ester resin.
49 for the different percentages of glass powder showed little variation. At neat resin (0% glass powder), gave the lowest fracture toughness, which was 31.12 MPa√m. For 5 % and 10%, the fracture toughness was 31.71 and 31.63 MPa√m respectively. From 0% to 10%, the fracture toughness remained steady and increased directly to 38.63 MPa√m at 15%. The fracture toughness then decreased to 33.49 MPa√m at 20%. It decreased slightly to 33.23 MPa√m at 25%. Again, the fracture toughness remained constant for these two readings. At 30% and 35%, the result again slightly decreased to 31.53 MPa√m and 31.61 MPa√m respectively. The results obtained showed little variation; apart from 15% glass powder, the fracture toughness remained between 31 MPa√m and 34 MPa√m for the other percentages of glass powder.
5.4 Comparison to Previous Works
Comparison of the results to previous work is a good indication of the viability of the fracture toughness measurements calculated. A previous study conducted investigated the fracture toughness of phenol formaldehyde composites. Ku et al. (2008) used envirospheres slg reinforced phenolic resin (PF/E-Spheres). The fracture toughness was determined using the same method (i.e. the short bar method) ensuring similar testing conditions for both studies. Table 5.3 shows the fracture toughness of PF/E-Spheres at varying percentages. Figure 5.2 shows a comparison of this and the previous studies results.
Table 5.3: Fracture toughness of different percentage by weight of SLG reinforced phenolic resin
Percentage by weight of
slg 0 15 20 25 30 35
Fracture toughness
MPa√m 8.72 10.5 12.5 9.62 8.82 8.12
50
Figure 5.2: Fracture toughness of PF/E-SPHERES with varying percentage by weight of slg
It can be seen that the results from both studies follow a similar trend. The fracture toughness starts low at neat resin before rising to a maximum at 20% by weight. It then drops back down.
5.5 Scanning Electron Microscopy (SEM) Analysis
SEM analysis made it possible to view the fracture surface of the specimens to determine the characteristics that contributed to their behaviour. Characteristics that influenced behaviour include voids, gaps around the glass powder, brittle/ductile zones. Apart from these, other features are to be observed; features such as elongation of fractured surfaces, signs of brittle and ductile fracture, fracture lines, and debris.
51
5.5.1 0% Glass Powder
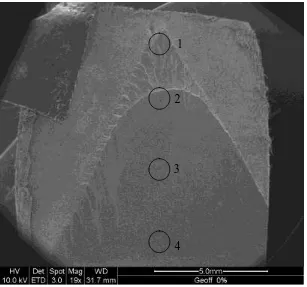
[image:65.595.166.473.261.548.2]Figure 5.3 is an image of a specimen of 0% glass powder, or neat resin. The four locations indicated (positions 1, 2, 3, and 4) were studied. No details can be seen yet, as this image is only 19 times magnifications.
Figure 5.3: Locations of SEM analysis, 0% glass powder
Figure 5.4 shows neat resin at position 1 at 200 times magnification. At this location, we can see fracture lines along which fracture occurs. The smooth straight lines indicate brittle fracture. Looking at Figure 5.3, we can see that this only occurs at the tip of the fracture surface where crack propagation is initiated.
Figure 5.5 shows neat resin at position 1 at 1000 times magnification. We can see more clearly the fracture line, and also smaller lines that represent the propagation of
1
2
3
52 the crack. We can also see that there is a considerable amount to debris on the surface.
Figure 5.6 shows neat resin at position 1 at 2000 times magnification. The debris can be seen more easily at this magnification.
Figure 5.7 shows neat resin at position 2 at 200 times magnification. This image shows the fracture line where failure of the specimen occurred. The top part shows the surface of the crack propagation, while the lower shows the surface of sudden catastrophic failure.
Figure 5.8 and 5.9 shows neat resin at position 2 at 1000 and 2000 times magnification respectively. It can be seen that the surface is mainly formless. There is however an area where there is an empty hole. There is also debris on the surface. Figure 5.10, 5.11, and 5.12 shows neat resin at position 3 at 200, 1000, and 2000 times magnification. The surface is mostly plain; however, as in position 2, there is an area with empty holes.
53
Figure 5.4: Position 1 at 200x magnification, 0% glass powder
Figure 5.5: Position 1 at 1000x magnification, 0% glass powder
Fracture Lines
[image:67.595.166.473.424.708.2]54
Figure 5.6: Position 1 at 2000x magnification, 0% glass powder
Figure 5.7: Position 2 at 200x magnification, 0% glass powder
[image:68.595.166.473.421.706.2]55
Figure 5.8: Position 2 at 1000x magnification, 0% glass powder
Figure 5.9: Position 2 at 2000x magnification, 0% glass powder
Debris
[image:69.595.165.471.424.710.2]56
Figure 5.10: Position 3 at 200x magnification, 0% glass powder
Figure 5.11: Position 3 at 1000x magnification, 0% glass powder
[image:70.595.165.472.426.709.2]57
Figure 5.12: Position 3 at 2000x magnification, 0% glass powder
Figure 5.13: Position 4 at 200x magnification, 0% glass powder
[image:71.595.166.473.423.708.2]58
Figure 5.14: Position 4 at 1000x magnification, 0% glass powder
[image:72.595.164.473.392.680.2]59
5.5.2 20% Glass Powder
[image:73.595.164.474.249.533.2]Figure 5.16 shows a specimen of 20% glass powder. As in the neat resin, four locations (positions 1, 2, 3, and 4) were studied using SEM. From this magnification, it can be see that there are air bubbles (or voids) on the fracture surface. These may have formed during the reaction of the resin and accelerator.
Figure 5.16: Locations of SEM analysis, 20% glass powder
Figure 5.17 shows a specimen of 20% glass powder at position 1, magnified to 200 times. From the image, it can be seen that the glass powder is of varying sizes. At this magnification, it is difficult to see in detail the interaction between the resin and glass powder.
Figure 5.18 shows a specimen of 20% glass powder at position 1, magnified to 1000 times. At this magnification, we can view the surface in more detail. The image shows that there are voids in the specimen. These generally appear to be larger than
1
2
3
60 the glass powder. The image also shows glass powder that has broken. We also see that there are gaps around the glass powder particles.
Figure 5.19 shows a specimen of 20% glass powder at position 1 magnified to 2000 times. At this magnification, it is possible to see the fracture surface.
Figure 5.20 shows a specimen of 20% glass powder at position 2 magnified to 200 times. In this image, we can see a large empty hole. We can also see the fracture line on the lower left of the image. The darker shadow indicates the direction the fracture line travels in.
Figure 5.21 shows a specimen of 20% glass powder at position 2 magnified to 1000 times. From the image, it can be seen that the glass powder particles range roughly from 5 microns to 80 microns.
Figure 5.22 shows a specimen of 20% glass powder at position 2 magnified to 2000 times. In this image, we can see that part of the surface seems to have been peeled before fracture. This could indicate some ductile behaviour did occur.
Figures 5.23, 5.24, and 5.25 shows a specimen of 20% glass powder at position 3 magnified to 200, 1000, and 2000 times respectively.
Figure 5.24 contains a number of voids, as well as fracture lines. We can see that some of the fracture lines run along the edges of the voids, suggestive of stress concentration areas.
Figure 5.25 shows an area containing a crevice. It also shows a surface that has cracks through it. This may be indicative of brittle fracture.
Figure 5.26 shows a specimen of 20% glass powder at position 4 magnified to 50 times. This image shows a considerable number of voids and holes. Further investigation will reveal these features influence the behaviour of the specimen.
61 Figure 5.28 shows a specimen of 20% glass powder at position 4 magnified to 1000 times. From this image, we can see the fracture lines. It can be seen that they occur between and around the glass powder and voids.
[image:75.595.165.472.313.591.2]Figure 5.29 shows a specimen of 20% glass powder at position 4 magnified to 2000 times. This figure gives a more detailed image of the fracture surface. This image gives conclusive evidence that the fracture lines originate from the glass powder particles as shown in the figure. We can see that in certain locations, cracks have originated from crevasses from dislodged glass powder particles.
62
Figure 5.18: Position 1 at 1000x magnification, 20% glass powder
Figure 5.19: Position 1 at 2000x magnification, 20% glass powder
Voids
Gaps Broken glass
powder particle
[image:76.595.166.473.424.710.2]63
Figure 5.20: Position 2 at 200x magnification, 20% glass powder
Figure 5.21: Position 2 at 1000x magnification, 20% glass powder
Empty hole
[image:77.595.165.473.424.709.2]64
Figure 5.22: Position 2 at 2000x magnification, 20% glass powder
Figure 5.23: Position 3 at 200x magnification, 20% glass powder
“Peeled” surface
[image:78.595.165.473.424.709.2]65
Figure 5.24: Position 3 at 1000x magnification, 20% glass powder
Figure 5.25: Position 3 at 2000x magnification, 20% glass powder
Fracture lines
Crevice
[image:79.595.165.473.420.706.2]66
Figure 5.26: Position 4 at 50x magnification, 20% glass powder
Figure 5.27: Position 4 at 200x magnification, 20% glass powder
Holes Voids
[image:80.595.165.472.425.708.2]67
Figure 5.28: Position 4 at 1000x magnification, 20% glass powder
Figure 5.29: Position 4 at 2000x magnification, 20% glass powder
Fracture lines
Crack origin
[image:81.595.166.472.423.710.2]68
5.6 Conclusion
The analysis of the results has given the fracture toughness of each sample. The use of SEM has allowed a detailed analysis at the fractured surfaces of two selected specimens. This allowed us to draw conclusions as to what influenced the behaviour of the samples.
A comparison to other studies has concluded that the results were comparable. Trends and values were particularly important, as well as materials used. Encouraging comparisons gave more confidence in my results.
69
6 Conclusion
6.1 Introduction
This chapter is the conclusion of the report. It will essentially answer what the project set out to investigate; that is, what percentage by weight of glass powder gives vinyl ester resin the highest fracture toughness? This chapter will briefly discuss the results, SEM analysis, the project on a whole, and outline any future work.
6.2 Fracture Toughness
After obtaining the results and analysis, it was concluded that the fracture toughness of glass powder reinforced vinyl ester resin was highest at 15 percent (by weight of glass powder). Comparison to other studies gave confidence in the results obtained, as trends and values were comparable, even for different combinations of materials.
6.3 SEM Analysis
70
6.4 Conclusion and Further Work
This project has comprehensively established that glass powder improves the fracture toughness of vinyl ester resin. The best percentage by weight of glass powder to vinyl ester resin was 15 percent.
71
References
Baker, L M, Compliance calibration of a family of short rod and short bar fracture toughness specimens 1983, Vol. 17, No. 4, pp. 289-312.
Barker, L M, Short Rod and Short Bar Fracture Toughness Specimen Geometries and Test Methods for Metallic Materials," Fracture Mechanics: Thirteenth Conference. ASTM STP 743 1981, pp. 456-475.
Blankenship, L T, White, M N, Puckett, P M, Vinyl ester resins: Versatile resins for composites 1989, pp. 234-245.
Bozzola, J J, Russell, L D, Electron Microscopy. Principles and Techniques for Biologists. (first edition 1992; second edition 1998) Jones and Bartlett Publishers.
Charalambides, M N, Williams, J G, Fracture Toughness Characterization of Phenolic Resin and Its Composite 1995, Vol. 16, No. 1, pp. 17-28.
Chemwatch, Material Safety Data Sheet for Methyl Ethyl Ketone Peroxide, 2000, pp.1-2.
Fu, S Y, Feng, X Q, Lauke, B, Mai, Y W, Effects of particle size, particle/matrix interface adhesion and particle loading on mechanical properties of particulate-polymer composites 2008.
Huntsman Composites, Technical Data Sheet, Hetron® 922PA vinyl ester resin, 2001, pp.1-2.
Juvinall, R C, Marshek, K M, 2001, Fundamentals of Machine Component Design, Fourth Edition 2006,Wiley and Sons Inc.
72 Ku, H, Rogers, D, Davey, R, Cardona, F, Trada, M, Fracture toughness of phenol formaldehyde composites: pilot study 2008, Vol. 17, No. 1, pp. 85-90.
Liang, J Z, Yang, Q Q, Mechanical properties of carbon black-filled high-density polyethylene antistatic composites 2009, Vol. 28, No. 3, pp.295-304.
Munz, D, Determination of fracture toughness of high strength aluminium alloys with chevron notched short rod and short bar specimens 1981, Vol. 15, No. 1-2, pp.231-236.
Potters Industries Inc, Material safety data sheet, Spherical hollow glass spheres 2007, pp. 1-4.
Robinette, E J, Ziaee, S, Palmese, G R, Toughening of vinyl ester resin using butadiene-acrylonitrile rubber modifiers 2004, pp. 6143-6154.
73
Appendix A – Project Specification
University of Southern Queensland Faculty of Engineering and Surveying
ENG 4111/4112 Research Project PROJECT SPECIFICATION
Project title: Fracture toughness of glass powder
reinforced vinyl ester resin post cured in a conventional oven using short bar tests.
Student: Geoffrey Korowa – 0050027542
Supervisor: Dr. Harry Ku
Co-Supervisor: Sponsorship:
Project Synopsis:
In this project, a number of samples of vinyl ester resin specimens will be made with each sample containing different percentages by weight of glass powder as a filler. The samples will be post-cured and tested to find fracture toughness. The results can then be analysed to develop behavioural trends and formulas that predict material behaviour in relation to filler composition.
Timelines:
1. Familiarization of equipment and literature reviews. Begin : 9th December 2008
Completion : 7th January 2009 Approx. Hours : 60 hours
2. Preparation of a cast/mould for short bar tests. Begin : 13th January 2009 Completion : 19th January 2009 Approx. Hours : 10 hours
3. Casting of components.
Begin : 20th January 2009 Completion : 10th February 2009 Approx. Hours : 25 hours
74 Approx. Hours : 15 hours
5. Carry out fracture toughness tests.
Begin : 24th February 2009 Completion : 26th February 2009 Approx. Hours : 15 hours
6. Analysis of results.
Begin : 15th March 2009 Completion : 1st May 2009 Approx. Hours : 60 hours 7. Outline conclusion.
Begin : 9th May 2009 Completion : 30th May 2009 Approx. Hours : 20 hours 8. Discuss thesis outline with supervisors.
Begin : 15th June 2009 Completion : 17thJuly 2009 Approx. Hours : 10 hours
9. Initial draft of thesis – draft form for supervisor to check over Begin : 1st August 2009
Completion : 13th September 2009 Approx. Hours : 60 hours
10.Final draft of thesis – to incorporate changes suggested by supervisor. Begin : 19th September 2009
Completion : 3rd October 2009 Approx. Hours : 15 hours
11.Complete the thesis in requested format. Begin : 3rd October 2009 Completion : 25th October 2009 Approx. Hours : 20 hours
AGREED:
75
Appendix B – Raw Data
24/02/2009 Sample ID: Geoff-0%G-1.mss
Specimen Number: 1 Tagged: False
Specimen Results: Name Value Units Thickness 35.000 mm Width 50.000 mm
76 24/02/2009 Sample ID: Geoff-0%G-2.mss
Specimen Number: 2 Tagged: False
Specimen Results: Name Value Units Thickness 26.000 mm Width 50.000 mm
77 24/02/2009 Sample ID: Geoff -0%G-3.mss
Specimen Number: 3 Tagged: False
Specimen Results: Name Value Units Thickness 26.000 mm Width 50.000 mm
78 24/02/2009 Sample ID: Geoff-0%G-4.mss
Specimen Number: 4 Tagged: False
Specimen Results: Name Value Units Thickness 26.000 mm Width 50.000 mm
79 24/02/2009 Sample ID: Geoff-0%G-5.mss
Specimen Number: 5 Tagged: False
Specimen Results: Name Value Units Thickness 26.000 mm Width 50.000 mm
80 24/02/2009 Sample ID: Geoff-0%G-6.mss
Specimen Number: 6 Tagged: False
Specimen Results: Name Value Units Thickness 26.000 mm Width 50.000 mm
81 Load At Offset Yield 654.622 N
Geoff-0%G
Report Date: 24/02/2009
Test Date : 24/02/2009
Method : MMT fracture toughness Test .msm
Specimen Results:
Specimen # Thickness mm Width mm Area mm^2 Peak Load N Peak Stress MPa Break Load N Break Stress MPa1 35.000 50.000 1750 557 0.32 554 0.32 2 26.000 50.000 1300 741 0.57 683 0.53 3 26.000 50.000 1300 505 0.39 505 0.39 4 26.000 50.000 1300 645 0.50 641 0.49 5 26.000 50.000 1300 615 0.47 606 0.47 6 26.000 50.000 1300 743 0.57 694 0.53
Mean 27.500 50.000 1375 634 0.47 614 0.45
Std Dev
3.674 0.000 184 96 0.10 74 0.09
Specimen # Elongation At Break mm Stress At Offset Yield MPa Load At Offset Yield N
1 0.854 0.262 458.907 2 2.276 0.370 480.560 3 0.958 0.264 343.089 4 1.611 0.354 459.914 5 0.684 0.470 610.981 6 1.524 0.504 654.622
Mean 1.318 0.371 501.345 Std
Dev
83 24/02/2009 Sample ID: Geoff-5%G-1.mss
Specimen Number: 1 Tagged: False
Specimen Results: Name Value Units Thickness 26.000 mm Width 50.000 mm
84 24/02/2009 Sample ID: Geoff-5%G-2.mss
Specimen Number: 2 Tagged: False
Specimen Results: Name Value Units Thickness 26.000 mm Width 50.000 mm
85 24/02/2009 Sample ID: Geoff-5%G-3.mss
Specimen Number: 3 Tagged: False
Specimen Results: Name Value Units Thickness 26.000 mm Width 50.000 mm
86 24/02/2009 Sample ID: Geoff-5%G4.mss
Specimen Number: 4 Tagged: False
Specimen Results: Name Value Units Thickness 26.000 mm Width 50.000 mm
87 24/02/2009 Sample ID: Geoff-5%G-5.mss
Specimen Number: 5 Tagged: False
Specimen Results: Name Value Units Thickness 26.000 mm Width 50.000 mm
88 24/02/2009 Sample ID: Geoff-5%G-6.mss
Specimen Number: 6 Tagged: False
Specimen Results: Name Value Units Thickness 26.000 mm Width 50.000 mm
89 Geoff-5%G
Report Date: 24/02/2009
Test Date : 24/02/2009
Method : MMT fracture toughness Test .msm
Specimen Results:
Specimen # Thickness mm Width mm Area mm^2 Peak Load N Peak Stress MPa Break Load N Break Stress MPa1 26.000 50.000 1300 757 0.58 757 0.58 2 26.000 50.000 1300 786 0.60 786 0.60 3 26.000 50.000 1300 829 0.64 829 0.64 4 26.000 50.000 1300 750 0.58 750 0.58 5 26.000 50.000 1300 783 0.60 783 0.60 6 26.000 50.000 1300 815 0.63 815 0.63
Mean 26.000 50.000 1300 787 0.61 787 0.61
Std Dev
0.000 0.000 0 31 0.02 31 0.02
Specimen # Elongation At Break mm Stress At Offset Yield MPa Load At Offset Yield N
1 0.787 0.429 557.100 2 0.665 0.501 651.265 3 0.779 0.496 644.551 4 1.758 0.311 404.859 5 1.611 0.509 661.504 6 1.272 0.476 619.037
Mean 1.146 0.454 589.719 Std
Dev
91 24/02/2009 Sample ID: Geoff-10%G-1.mss
Specimen Number: 1 Tagged: False
Specimen Results: Name Value Units Thickness 26.000 mm Width 50.000 mm
92 24/02/2009 Sample ID: Geoff-10%G-2.mss
Specimen Number: 2 Tagged: False
Specimen Results: Name Value Units Thickness 26.000 mm Width 50.000 mm
93 24/02/2009 Sample ID: Geoff-10%G-3.mss
Specimen Number: 3 Tagged: False
Specimen Results: Name Value Units Thickness 26.000 mm Width 50.000 mm
94 24/02/2009 Sample ID: Geoff-10%G-4.mss
Specimen Number: 4 Tagged: False
Specimen Results: Name Value Units Thickness 26.000 mm Width 50.000 mm
95 24/02/2009 Sample ID: Geoff-10%G-5.mss
Specimen Number: 5 Tagged: False
Specimen Results: Name Value Units Thickness 26.000 mm Width 50.000 mm
96 24/02/2009 Sample ID: Geoff-10%G-6.mss
Specimen Number: 6 Tagged: False
Specimen Results: Name Value Units Thickness 26.000 mm Width 50.000 mm
97 Load At Offset Yield 498.016 N
Geoff-10%G
Report Date: 24/02/2009
Test Date : 24/02/2009
Method : MMT fracture toughness Test .msm
Specimen Results:
Specimen # Thickness mm Width mm Area mm^2 Peak Load N Peak Stress MPa Break Load N Break Stress MPa1 26.000 50.000 1300 755 0.58 755