University of Southern Queensland
Faculty of Engineering and Surveying
Mapping Greens at City Golf Course
A dissertation submitted by
Mr Wade Reynolds
In fulfilment of the requirements of
Courses ENG4111 and ENG4112 Research Project
Towards the degree of
Bachelor of Spatial Science, Surveying
ABSTRACT
Golf clubs need to present information about their general golf course layout, distances, topography of greens, tee positions and hazards in a suitable format for all players, both professional and social. This dissertation will concentrate on mapping of the greens at Toowoomba City Golf Course to create a contour plan for each of the greens. This will update existing map information and add additional information to what is currently available through the Golf Club.
Mapping Greens at City Golf Course
University of Southern Queensland
Faculty of Engineering and Surveying
ENG4111 & ENG4112 Research Project
Limitations of Use
The Council of the University of Southern Queensland, its Faculty of Engineering and Surveying, and the staff of the University of Southern Queensland, do not accept any responsibility for the truth, accuracy or completeness of material contained within or associated with this dissertation.
Persons using all or any part of this material do so at their own risk, and not at the risk of the Council of the University of Southern Queensland, its Faculty of Engineering and Surveying or the staff of the University of Southern Queensland.
This dissertation reports an educational exercise and has no purpose or validity beyond this exercise. The sole purpose of the course pair entitled "Research Project" is to contribute to the overall education within the student’s chosen degree program. This document, the associated hardware, software, drawings, and other material set out in the associated appendices should not be used for any other purpose: if they are so used, it is entirely at the risk of the user.
Prof R Smith Dean
Certification
I certify that the ideas, designs and experimental work, results, analyses and conclusions set out in this dissertation are entirely my own efforts, except where otherwise indicated and acknowledged.
I further certify that the work is original and has not been previously submitted for assessment in any other course or institution, except where specifically stated.
Wade Stuart Reynolds
Student Number: 0050008843
Mapping Greens at City Golf Course
ACKNOWLEDGEMENTS
This research was carried out under the principal supervision of Mr Peter Gibbings and Associate Professor Dr. Frank R Young of the University of Southern Queensland, throughout the course of the research project.
Appreciation is also due to the Toowoomba City Golf Club for allowing access to the golf course to conduct this project and for the loan of a golf cart to transport equipment around the course. Also I would like to thank the players for their patience and understanding during periods of data collection.
TABLE OF CONTENTS
Contents
Page
ABSTRACT i
LIMITATIONS OF USE ii
CERTIFICATION iii
ACKNOWLEDGEMENTS iv
LIST OF FIGURES ix
LIST OF TABLES x
LIST OF APPENDICES xi
ABBREVIATIONS xii
CHAPTER 1 - INTRODUCTION
1.1 Introduction 1
1.2 Research Aim and Objectives 2
1.3 Justification 2
1.4 Scope and limitations of Research 3
1.5 Conclusions 3
CHAPTER 2 - LITERATURE REVIEW
2.1 Introduction 5
2.2 Analysing Golf Greens 6
2.2.1 Determining Ball Roll on Golf Greens 6
Mapping Greens at City Golf Course
2.4.1 Hope Island Golf Course 14
2.4.2 Club Pelican Golf Course 15
2.5 Conclusion 16
CHAPTER 3 - METHODOLOGY
3.1 Introduction 18
3.2 Data Capture 19
3.2.1 Global Positioning Systems 19
3.2.2 3D Digital Laser Scanning 20
3.2.3 Robotic Total Station 23
3.3 Data Processing 24
3.3.1 Data Reduction for Differential GPS 24
3.3.2 Data Reduction for Fast Static Survey 24
3.3.3 Data Reduction for Scanner 25
3.3.4 Data Reduction for RTK GPS 25
3.3.5 Data Reduction for Robotic Total Station 25
3.3.6 Contour Creation 26
3.4 Creation of Plans 26
3.4.1 Green Plan 27
3.4.2 Contour Plans 28
3.5 Conclusion 29
CHAPTER 4 – RESULTS AND DISCUSSION
4.1 Introduction 30
4.2 Accuracy Assessment 30
4.2.1 Base Station Creation 30
4.2.2 Check Observation Results 31
4.2.5 Area and Perimeter 37
4.3 Comparison of Survey Methods 38
4.3.1 Methods Compared 38
4.3.2 Time Comparison 39
4.3.3 Costs Comparison 40
4.3.4 Advantages and Disadvantages 41
4.4 Plans Created 43
4.4.1 Green Plan 43
4.4.2 Contour Plans 45
4.5 Conclusion 47
CHAPTER 5 – CONCLUSIONS AND RECOMMENDATIONS
5.1 Introduction 48
5.2 Discussion 48
5.3 Implications 49
5.4 Further Research and Recommendations 50
5.5 Conclusion 50
BIBLIOGRAPHY 51
APPENDICES
A: Project Specification 52
B: Technical Data for LMS Z210 Scanner 54
Mapping Greens at City Golf Course
4th Green 69
5th Green 70
6th Green 71
7th Green 72
8th Green 73
9th Green 74
10th Green 75
11th Green 76
12th Green 77
13th Green 78
14th Green 79
15th Green 80
16th Green 81
17th Green 82
18th Green 83
Number Title
Page
2.1 Phil Mickelson using his putter as a plumb bob to pick a line 7
2.2 Tiger Woods visualising the roll of his put. 7
2.3 The EyeLine Golf Green Reading Level. 8
2.4 An example of a map created with the Green Reading Level. 8
2.5 Riegl 3D-Laser Mirror Scanner LMS-Z210 10
2.6 GPS base station setup. 12
2.7 GPS and S6 prism attached to same pole 14
2.8 The first green layout at Hope Island Golf Club 15
2.9 The first green layout at Club Pelican 16
3.1 Scanner setup at the 1st green 21
3.2 Scan of second green 22
3.3 Screen capture of contour settings 26
3.4 Insert from original plan 27
3.5 Insert from updated plan 28
4.1 Height Variations on Check Observations 31
4.2 10th Green, 3 Methods Compared 35
4.3 6th Green, 2 Methods Compared 36
4.4 Direct Comparison of Points 37
4.5 New plan on display at Toowoomba City Golf Course 44
Mapping Greens at City Golf Course
LIST OF TABLES
Number Title
Page
2.1 GPS Accuracies Obtainable 11
4.1 Adjusted coordinated for the Golf Base Station 31 4.2 Check Observations Compared to S6 Surface 33 4.3 Check Observations Compared to Scanner Surface 34 4.4 Differences between S6 and GPS area and perimeter measurements. 38
4.5 Time comparison 39
LIST OF APPENDICES
Number Title
Page
A Project Specification 52
B Technical Data for LMS Z210 Scanner 54
C Network Adjustment Report 57
D Green Areas and Perimeters 63
E Contour Plans 65
1. 1st Green 66
2. 2nd Green 67
3. 3rd Green 68
4. 4th Green 69
5. 5th Green 70
6. 6th Green 71
7. 7th Green 72
8. 8th Green 73
9. 9th Green 74
10.10th Green 75
11.11th Green 76
12.12th Green 77
13.13th Green 78
14.14th Green 79
15.15th Green 80
Mapping Greens at City Golf Course
ABBREVIATIONS
The following abbreviations have been used throughout the text and bibliography:-
USQ University of Southern Queensland. TCGC Toowoomba City Golf Course RTK Real Time Kinematic
CHAPTER 1
INTRODUCTION
1.1
Introduction
Golf has become a popular past time for a wide cross section of the community irrespective of background with everyone equal on the golf course. Both professional and social golfers are always looking for a competitive edge to improve their game, whether that is a personal challenge to reduce their own handicap, to better their playing partner or the chance for prizes in all levels of competition. Specific details on the slopes and distances of the greens can be valuable in deciding how best to approach the hole and play the green to reduce the number of strokes needed to sink the ball.
The Toowoomba City Golf Course (TCGC) is currently undergoing some major course and green redesign work to lower the course rating from a par 72 to a par 71. The 18 hole golf course is limited with what can be done in the redesign work as the course is bound by residential allotments and main collection roads on all sides. Due to this the course can not be lengthened, therefore the course needs to be made harder through adding more hazards and changing the greens to include more undulations.
Mapping Greens at City Golf Course
1.2
Research Aim and Objectives
The aim of the project is to map the shape and slope of the greens at Toowoomba City Golf Course (TCGC) and provide a contour plan of each green. This will be achieved through completing the following stages:
• Undertake a review of the accuracy of various mapping techniques appropriate for the mapping of the greens.
• Establish and verify control points to use during the mapping process.
• The measurement of the greens and the surrounding hazards, bunkers, trees and water.
• The 3D mapping of greens using a combination of methods, (GPS (Global Positioning System), robotic total stations and digital scanner).
• Create a hard copy map of greens and adjacent features and a digital contour plan of each green at the TCGC.
• Analyse and compare the accuracies achieved in the mapping and contouring using the different methods.
The dissertation has two main objectives that will be met. These objectives are as stated below:
• Determine the best technique to map a surface such as golf green or lawn bowl green.
• Create a contour plan of each of the playing greens at TCGC.
1.3
Justification
Golf clubs are like any other business and are looking for a marketing edge to increase their membership and provide acceptable returns to all stakeholders. One way this can be done is by providing information to the playing members and social golfers that may assist in improving the handicap of players.
includes distance and slope information when putting as this is a crucial part of the game. This is currently evident with caddies required to map courses prior to competition play to be able to provide the best possible information on the best line and direction when putting as well as distances along each fairway as approach shots are played. By having this information, the correct club selection for approach shots can be made to assist in a low scoring round greens are no different. By having an accurate map of each green, the roll of the ball can be predicted to assist in putting. Good putting can make the difference between a low scoring round and failing to make the cut.
1.4
Scope and Limitations
This project is limited to the mapping of greens at TCGC and will not take into consideration any outside effects to a ball in play that may affect its the roll on the surface of a green. Contours will be created according to the green surface at time of mapping with the various methods.
Copies of the plans created will be provided to the Toowoomba City Golf Club to be used at their discretion, for the purpose of an information service to members, guests and social players of the course. The information is also available for their use as a marketing tool to promote the club and attract new members.
1.5
Conclusion
Mapping Greens at City Golf Course
Any additional information available to professional and social golfers can be used as a tool to lower a golfer’s score.
CHAPTER 2
LITERATURE REVIEW
2.1
Introduction
Golf is a game played by all age groups from social games through to professional competitions with large sums of money involved. The game can be extremely competitive as players look to either improve their own personal best scores or that of their playing partners. Golfers today look for any information which may assist them in lowering their score such as contour maps of greens. This chapter will review literature required to establish the need for mapping of golf green surfaces.
Different mapping systems will be reviewed and evaluated in the process of creating a contour plan with the required accuracy. Various survey techniques and methods are also covered in this chapter as their concepts can be used to map golf greens at any course.
Mapping Greens at City Golf Course
2.2
Analysing Golf Greens
2.2.1 Determining Ball Roll on Golf Greens
Reading the roll of putting greens is a major challenge to all golfers both professional and social. Not only is this a challenge, it is an important part of the game that can significantly influence the difference between a good low score and failing to make the cut.
Players and their caddies take their time in determining the roll of the putt across the playing surface. By reading the undulations and the speed accurately a golfer can make any putt look easy. Practice and experience is the only way to read greens effectively. Golfers and their caddies currently use a variety of methods to assist in determining which direction the ball will break, such as:
• Using the putter as a plumb bob to determine the line of sight. Figure 2.1 demonstrates this action.
• Viewing the line from as close to the ground as possible to try and visualise the slope of the green. Figure 2.2 shows Tiger Woods preparing for his putt using this method.
• External equipment to assist determining the roll (prior to play).
External devices are only allowed to measure distances during play. Local rules need to be checked before using such equipment, as variations to their use may apply. The international rules of golf do not allow for the use of any device designed to measure other conditions during play that might affect play. In an amendment issued by the governing body for golf rules and regulations, The Royal and Ancient Golf Club of St Andrews (R&A), in December 2005 the following is stated
“a player may obtain distance information by using a device that measures distance
only. However, if, during a stipulated round, a player uses a distance measuring device
that is designed to gauge or measure other conditions that might affect his play (eg,
gradient, windspeed, temperature, etc), the player is in breach of Rule 14-3, for which
Golf Australia also states “The R&A further advises that any such Local Rule must prohibit the use of a distance measuring device that is capable of gauging or measuring other conditions that might affect play, even if such a function is not used.” Golf Australia also endorses these positions.
[image:20.595.222.470.393.724.2]Mapping Greens at City Golf Course 2.2.2 External Device
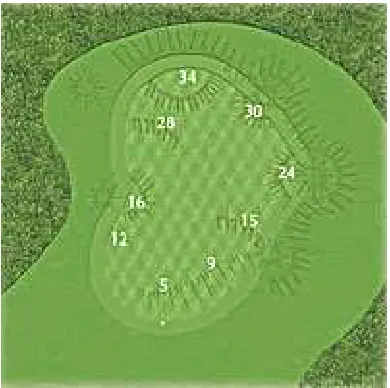
[image:21.595.206.477.211.425.2]The EyeLine Golf Green Reading Level as shown in Figure 2.3 is one external device that is used to enable golfers to roughly map the direction of fall on a green. This form of mapping provides limited information on a green and the accuracy of the information relates to the user’s ability to draw a plan and collect information around the green. An example of a map drawn using this method is shown in figure 2.4.
Figure 2.3 The EyeLine Golf Green Reading Level. Source: http://www.eyelinegolf.com/grl-tour.php
[image:21.595.189.497.469.718.2]2.3
Surveying Techniques
Various surveying techniques and methods are used in the surveying industry today for numerous types of projects. For this project three methods of surveying have been used. The methods of data collection used were digital laser scanning, GPS and robotic total station.
Mapping Greens at City Golf Course 2.3.1 Digital Laser Scanning
.
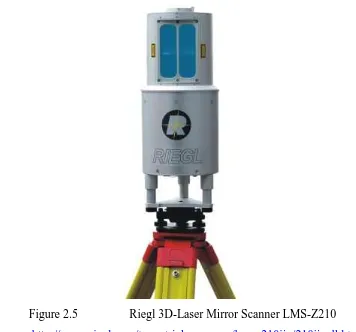
[image:23.595.150.506.235.567.2]The 3D Terrestrial Laser Scanner available for this project was the Riegl 3D-Laser Mirror Scanner LMS-Z210. This is a rugged and fully portable sensor designed for the rapid acquisition of high-quality three dimensional images. The RIEGL LMS-Z210 provides a wide field-of-view, high accuracy, and fast data acquisition. A laptop with I-Site software, enables the user to instantly acquire high-quality 3D data in the field.
Figure 2.5 Riegl 3D-Laser Mirror Scanner LMS-Z210 (Source: http://www.riegl.com/terrestrial_scanners/lms-z210ii_/210ii_all.htm)
Laser scanning can be used in a wide variety of applications for the quick capture of large volumes of data. Applications range from the engineering, civil, architectural, 3D modelling and more. Scanning offers some advantages over traditional surveying, which include:
• Time and cost savings during data capture
• Complete 3D modelling of structures and surfaces
The Riegl scanner operates on a time of flight measurement principle. This is where short laser pulses in the infrared wavelength region are emitted and the reflected signal is collected. The time difference between transmitted and received pulses is calculated to provide a distance (Riegl 2001). Further technical specifications are available in Appendix B.
2.3.2 Global Positioning System
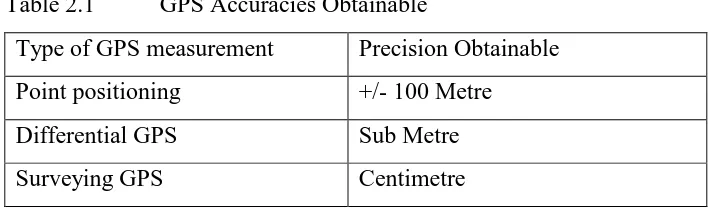
[image:24.595.147.504.388.494.2]Global Positioning Systems (GPS) are a method of acquiring positional information via a network of satellites orbiting the earth. There are different levels of accuracy available through GPS, depending on the method used. Generally GPS is divided into three main categories. These are listed below in table 2.1
Table 2.1 GPS Accuracies Obtainable
Type of GPS measurement Precision Obtainable
Point positioning +/- 100 Metre
Differential GPS Sub Metre
Surveying GPS Centimetre
Source: Trimble Navigation Limited (2003)
Differential GPS was the chosen method to capture the data for the initial green plan. This form of GPS measurement was chosen as the sub-metre accuracy obtainable was deemed to meet the requirements of a golfer for a green and hazard plan.
Mapping Greens at City Golf Course
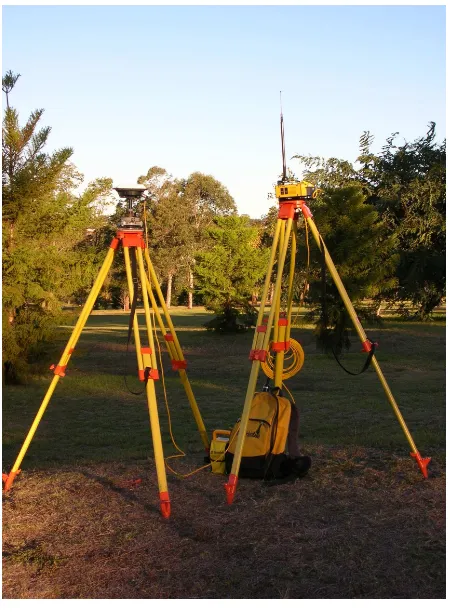
Figure 2.6 GPS base station setup.
The GPS data collection requires two receivers collecting data simultaneously from a minimum of four satellites. One of the receivers is fixed at known coordinates, this is known as a base station, and the second of the receivers is the rover used for collecting data at the required locations.
As with any survey technique, errors can occur through either human errors or instrument errors. Possible forms of human error include:
• Misreading antenna height measurement
• Incorrect data entry, transposing numbers, wrong datum’s, using incorrect coordinates
• Rushing observations and shortening observation times
• Poor levelling and centring over points GPS instrument errors include:
• Selective availability – Is a degradation of the GPS satellite signal. The US Department of Defence purposely introduced an artificial distortion of the satellites location and time. This was turned off on 1 May 2000 and can be turned on if required.
• Atmospheric effects – The troposphere and ionosphere can cause a delay in the GPS signal and can be eliminated by using short base lines.
• Multipath – Occurs when the GPS signal is reflected of a surface taking a longer path to reach the receiver and the receiver receives the signal from multiple paths. Surfaces that can cause multipath include trees, powerlines, buildings and the surface of the ground.
2.3.3 Robotic Total Station
The Trimble S6 is a Robotic Total Station that offers fully robotic operation enabling the user to work independently of the instrument as long as a line of sight is obtainable.
Mapping Greens at City Golf Course
Figure 2.7 GPS and S6 prism attached to same pole Source: Trimble
2.4
Golf Course Information Provided
2.4.1 Hope Island Golf Course
Figure 2.8 The first green layout at Hope Island Golf Club Source: http://www.hir.com.au/golf/holebyhole/hole1.asp
The symbols used to indicate slope can be confusing to those using the information as there is no indication as to the direction of slope or the high/low points, generally this can be determined once reaching the green. However subtle slopes and grades are not obvious or shown on the green plans. This plan does not show if the green, as a whole has any major slope such as front to back or left to right which could play a major role in the final resting place of an approach shot or affect a long putt across the direction of fall.
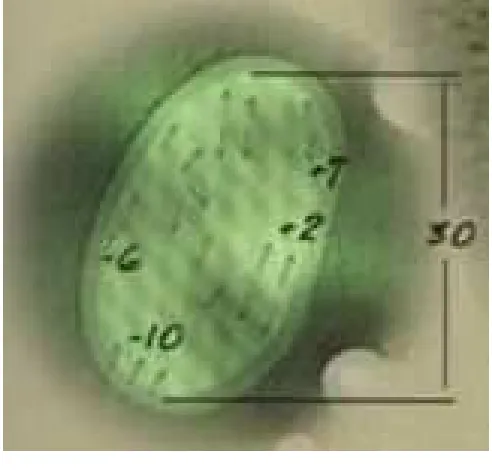
2.4.1 Club Pelican Golf Course
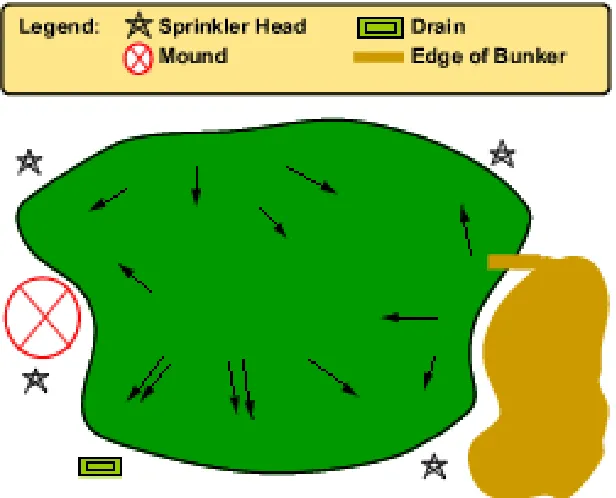
Club Pelican also provides green information on their web page. The Club Pelican format uses arrows and shading to indicate the direction and grade of the fall.
Mapping Greens at City Golf Course
Figure 2.9 The first green layout at Club Pelican Source: http://www.pelicanwatersgc.com.au/golf-course-layout.php#
2.5
Conclusion
Other factors that can influence the roll of a golf ball on a green include;
• Moisture
• Grass type and cut
• Direction and height of cut
• Wind speed and direction
• Plug marks
These are outside the scope of the project. This project focuses on the contouring of the existing surface by a number of methods to determine the most effective and efficient method for providing the service.
A lack of information was available on the specifics of mapping golf greens and other similar surfaces such as that of bowling greens. Some of the businesses that provide a green mapping service are reluctant to provide information as to their procedures for producing contour plans for golf greens other than to say it is a detail survey and no different from a large scale detail survey.
Mapping Greens at City Golf Course
CHAPTER 3
METHODOLOGY
3.1
Introduction
Providing 3D data to golfers will assist in improving their game through a better understanding of slope, distance, putting direction etc. The information needs to be in an easily accessible and readable format. To determine the best accuracy and most reliable mapping method, green maps will be created and compared using three survey techniques.
The aim of this chapter is to discuss the components used in providing a contour plan of the greens at TCGC. This will be achieved by discussing how the data was collected and processed through to how the plans were presented and created.
3.2
Data Capture
3.2.1 Global Positioning Systems
Differential GPS or mapping grade GPS was used initially to obtain an outline plan of each new green and surrounding hazards, bunkers, trees and water. This was used to update the existing green plan located outside the Pro shop at TCGC. The edges of the greens and any hazards in the immediate vicinity were mapped using Trimble’s Pro XR GPS receiver. From the data gathered the updated green plan was produced for display. The data collected was logged on a time interval basis, where a point was recorded every second as the receiver was walked around each feature to be mapped. By using the Pro XR along with a receiver in backpack allowed for real time corrections to be calculated reducing the processing required for the data.
For RTK GPS, a rover GPS unit was required along with a base station. The base station was a rover set up over a known mark with a radio emitting positional information as shown in figure 2.6.
Mapping Greens at City Golf Course
Once the base file had been reduced and the coordinates determined the collection of green information could commence through a RTK survey. The first of the RTK surveys was to establish control marks at each of the greens. The control marks used were sprinkler heads, hundred metre markers, signs located on the tee boxes and other fixed marks found around a green. Each of the points was collected as a control point requiring twenty epochs of data before the point could be stored. This file was then later used when importing the control points into the S6 to be used for setting up a station at each green.
Second of the RTK surveys was in conjunction with the S6 when the green information was collected. Both the S6 and RTK points were collected at the same point and time to allow for an effective comparison between the two surfaces.
3.2.2 3D Digital Laser Scanning
The scanner used for the data capture was the Riegl LMS-Z210. Due to the size and the weight of the scanner a golf cart was loaned from the TCGC to transport the scanner and all other required equipment around the course. The scanner was setup over a coordinated position, a sprinkler head, with two coordinated targets placed around each green to provide orientation of each scan onto the Map Grid Australia (MGA) coordinate system. In doing this, it enabled for a direct comparison between each method to be conducted. The marks were coordinated using an RTK GPS survey.
The Riegl scanner works on the principle of time of flight measurement of laser pulses in the infrared wavelength. Time of flight refers to the time interval between transmitting the infrared light pulse and receiving the pulse. Technical data for the Riegl LMS-Z210 can be found in Appendix B
In the scanning process, all the greens scanned were able to be captured with just the one set up. For each set up, the scanner was linked, via cable to a laptop running the I-SITE Studio software to operate the scanner and store the data. This can be seen in Figure 3.1, a target used is also shown in the background.
Figure 3.1 Scanner setup at the 1st green
Mapping Greens at City Golf Course
As well as limiting the angle of scan the minimum and maximum distances of scan were set to reduce the number of points collected. Due to the positioning of the scanner on each occasion, the minimum distance was set to the limit of instrument at two meters and the maximum was set to cover the length of the green plus an additional 5 to 10 meters to include the targets. This particular function of the scanner was not operational at time of use, causing a large volume of additional data to be collected. As a result the scanned images needed to be cropped to the limits of the green during processing.
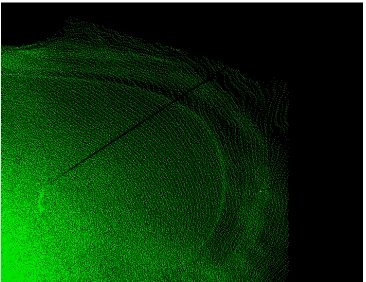
[image:35.595.144.510.423.705.2]To collect a scan the I-Site program provides a number of preset options as to the intensity of scan required. For the purpose of this project, the fine scan option was used as, at this intensity, the fringe of the green could be clearly seen in the scan. This allowed a boundary to be set as to the limits of the green. The other options from course through to ultra fine were determined to provide excessive data or not enough to show the fringe line. Figure 3.2 shows a screen capture of a scan at the second green where the fringe can be clearly seen.
After the data has been acquired, the information needs to be processed to filter out unnecessary points and align the scan onto the required coordinate system, MGA. Processing of the data will be discussed later in this chapter.
3.2.3 Robotic Total Station
To prevent additional marks being placed around each green, sprinkler heads were used to set up over with the one hundred metre markers used as a backsight. If a one hundred metre marker was not available, such as on the short par three holes, a sign located at the tee box was used for this purpose. These marks were coordinated using the RTK control survey.
The number of observations required for each green varied due to the size, shape and level of undulations over the green. To provide for accurate contours, between two hundred and four hundred points were collected at each of the greens.
The Trimble S6 was the instrument selected of this project, as the S6 has the capacity to be operated by a single person and was provided through the USQ. A topo plate was made to attach to the base of the range pole to replace the usual spike. The purpose of the plate was to prevent damage to the green and allow the measurement to give a true indication of the surface. By using a ball joint to attach the topo plate to the pole, it allowed the pole to be levelled no matter what the slope of the green.
Mapping Greens at City Golf Course
3.2.4 Check Observations
In order to provide a check of the accuracy of each of the survey methods used, a series of independent random points were collected over the 8th green using the S6 for horizontal positions and each point was levelled using a digital level. Twenty three points in all were collected independent of other data collection and imported into the 8th green file where the points were used to interpolate a height at each position onto each of the three surfaces. The results of the height differences are shown in Chapter 4.
3.3
Data Processing
3.3.1 Data Reduction for Differential GPS
Differential GPS or mapping grade GPS was used initially to obtain an out line of each green and any hazards in the immediate area. This data was downloaded into Trimble Geomatics Office (TGO) where the point data was checked to ensure it was on the correct coordinate system and datum. This data was then exported for use in AutoCAD for the use in the final plan.
3.3.2 Data Reduction for Fast Static Survey
3.3.3 Data Reduction for Scanner
On collecting the scan data each of the scans was registered using the coordinates of the scanner setup position and orientated using the coordinates of the targets. Targets were located using the option “locate reflectors”, this tool finds the most reflective surfaces in a scan and selects them allowing for their uses in the registration process. This placed the scans on to the MGA coordinate system. The point data was cropped to eliminate unnecessary points from the file. The data files for each green were too large to be transferred to Terramodel as the program was not able to cope with the large volume of data, with some scans having over one million points collected. To alleviate this problem, the data was filtered to a variety of distances from 0.1 m to 0.5 m between points. This dramatically reduced the number of points and enabled the files to be transferred into Terramodel where the contouring process could be completed.
3.3.4 Data Reduction for RTK GPS
As Real Time Kinematic surveying was used, the corrections are completed at the time of measurement. With the base station transmitting, via a radio link, the base observations, a solution is resolved at time of measurement. This minimises the processing required and enables the GPS files to be imported directly into Terramodel and have points automatically drafted and ready for contouring and plan creation.
3.3.5 Data Reduction for Robotic Total Station
Mapping Greens at City Golf Course 3.3.6 Contour Creation
[image:39.595.128.558.298.625.2]The contours from each method were created using the same program, Terramodel, so the same contouring method and algorithms were used for each surface. A DTM layer containing all points to be contoured from was created for each surface and these surfaces were contoured using the Generate Contours function. Contours were limited to the boundary string created by the fringe of each green. A contour interval was set at 0.05 metres as this was determined to provide the best representation of the surface. The contours were also smoothed using the B Spline option in the contour creation settings. Figure 3.3 shows a screen capture of the contour settings used.
Figure 3.3 Screen capture of contour settings
3.4
Creation of Plans
hazards and the second is individual contour plans of each green. The methods involved for creating and producing each will now be discussed.
3.4.1 Green Plan
The green plan prepared for display at the Pro shop is to display the daily hole placement. This plan is updated by the green keepers after the hole locations are changed.
The main body of the plan was created by D Baker (2003) and this project was aimed at updating the plan to show the new greens and modifications made to existing greens. A digital copy of the plan was obtained and the modifications were made to the original plan.
The original plan provided an area for distances to be shown, as shown in Figure 3.4. This information was not used by the Club, therefore was removed to increase the scale of each green diagram and allow space to be created for the addition of a temporary green that is used during maintenance or closures of holes.
Distance From Back Distance From Front
HOLE 4
HOLE 3
Distance From RHS Distance From LHS
[image:40.595.203.464.463.755.2]Mapping Greens at City Golf Course
This plan was modified using AutoCAD as the original plan was in an AutoCAD format and the ease of use and manipulation features of the program. As with the original plan each of the greens was rotated to the direction of plan up the page (refer Figure 3.5). The reasoning for this was to make the plan easy for all golfers to read and orientate, minimising confusion about which direction the player is approaching the green from.
[image:41.595.208.462.235.500.2]HOLE 4
HOLE 5
Figure 3.5 Insert from updated plan
The data for this plan was captured using the Trimble Pro XR, the mapping grade GPS receiver.
3.4.2 Contour Plans
The design of plans was influenced by the type of information provided by other golf courses, refer figures 2.8 and 2 9. In addition to providing the contours, arrows were also placed on each green on the plan to show a clearer indication of the direction of fall.
Each of the plans has been created using the Trimble S6 data for a consistent approach and outcome and once again each plan has been orientated towards the direction of play up the page. A one metre grid has been placed around each green and a two meter dotted grid through the middle of each green as a background to the plan to assist is determining distances from any position to the hole. The dotted grid was used so as not to clutter the plan. Directional arrows were used in addition to the contours to clearly indicate the direction of the fall and allow those players, who may not be able to read contours, a clearer picture of the slopes and direction of fall.
Additional information, such as the area in meters squared and perimeter of each green, was provided along with a directional arrow indicating the direction of play to assist with approach shots.
3.5
Conclusion
This chapter covered the methods this project undertook to create contour plans for each of the greens at the TCGC. In order to create the contour plans required, information needs to be obtained accurately to provide the best information possible to the Golf Club and all the golfers who wish to take advantage of the additional information.
Mapping Greens at City Golf Course
CHAPTER 4
RESULTS AND DISCUSSIONS
4.1
Introduction
In the methodology of this project, Chapter 3, the three methods of data acquisition, a terrestrial laser scan survey, a RTK GPS survey and a traditional survey, were discussed as to their role in creating contour plans for the greens at TCGC.
This chapter’s purpose is to provide an accuracy assessment of the contours
produced from the three different methods of data acquisition and provide a contour plan of each of the greens in a usable format for all golfers. Also a discussion as to the advantages and disadvantage of each method of survey has been conducted to provide assistance in determining the best method for producing accurate contour plans of golf greens.
4.2
Accuracy Assessment
4.2.1 Base Station Creation
To establish the base station for use during the project, a fast static survey was conducted using Ananga, the USQ base station and its known coordinates, along with a permanent survey mark located on Stenner Street, PSM 40382.
95% confidence interval. The results for golf base passed this test. Appendix C shows the full breakdown of the network adjustment report.
Table 4.1 Adjusted coordinated for the Golf Base Station
Point Name Easting Northing Reduced Level Golf Base 01 395501.397 6948785.123 645.318
4.2.2 Check Observations Results
As discussed in Chapter 3, a series of check observations were collected on the 8th green to use as control points to analyse the elevation differences between surfaces. The check observations, as outlined in Chapter 3 were collected with the Trimble S6 and levelled with a digital level. Each point was interpolated onto each of the surfaces to provide a height difference. Figure 4.1 shows the height differences obtained from each point.
Check Observations Variations
-0.01 0 0.01 0.02 0.03 0.04 0.05
1 2 3 4 5 6 7 8 9 10 11 12 13 14 15 16 17 18 19 20 21 22 23
[image:44.595.136.547.436.649.2]Mapping Greens at City Golf Course
0.033 m. These indicate the unreliability of the heights gained through the GPS measurements for the contouring of a surface such as golf greens where contours are to be created at small intervals.
Figure 4.1 also shows that both the scanner and the S6 measurements came in under 0.01 m and both methods recorded an average height difference of 0.003 m. This difference could be accounted for in the length of the grass as measurements were taken with a month break between scanner and S6 observations and a further month to the recordings of the check observations. Another possible reason for a difference is, the night the scanning was conducted, a heavy due had settled on the green.
Table 4.2 Check Observations Compared to S6 Surface
Point
Number Easting Northing RL S6 RL Difference
Pass/ Fail
Mapping Greens at City Golf Course Table 4.3 Check Observations Compared to Scanner Surface
Point Number Easting Northing RL GPS RL Diff Pass/ Fail
1 395978.337 6948869.895 618.163 618.160 0.003 pass 2 395977.781 6948865.781 618.153 618.148 0.005 pass 3 395971.893 6948865.121 617.774 617.771 0.003 pass 4 395963.959 6948867.275 617.458 617.452 0.006 0.006 5 395965.663 6948873.272 617.507 617.502 0.005 pass 6 395969.112 6948874.947 617.619 617.613 0.006 0.006 7 395975.505 6948874.902 618.056 618.052 0.004 pass 8 395976.285 6948877.939 618.059 618.055 0.004 pass 9 395973.343 6948878.908 617.981 617.978 0.003 pass 10 395969.806 6948878.697 617.787 617.786 0.001 pass 11 395965.673 6948878.772 617.513 617.508 0.005 pass 12 395966.084 6948882.580 617.674 617.670 0.004 pass 13 395970.674 6948883.993 617.854 617.854 0.000 pass 14 395974.488 6948882.656 617.978 617.980 -0.002 pass 15 395976.056 6948885.458 617.990 617.993 -0.003 pass 16 395975.261 6948888.628 617.931 617.937 -0.006 0.006 17 395974.176 6948892.146 617.877 617.880 -0.003 pass 18 395970.748 6948891.156 617.771 617.776 -0.005 pass 19 395967.491 6948889.379 617.695 617.698 -0.003 pass 20 395967.875 6948884.994 617.745 617.744 0.001 pass 21 395969.940 6948874.001 617.663 617.658 0.005 pass 22 395961.490 6948865.026 617.369 617.365 0.004 pass 23 395963.587 6948876.245 617.431 617.429 0.002 pass Average Absolute Difference = 0.004 metres
86% of Total Observations = 20 points Tolerance 0.1of 0.05 Contour Interval = 0.005 metres
The scanner and the S6 methods were deemed to meet the accuracy levels required for providing contour plans of golf greens. The GPS observations all fell outside the tolerance levels set.
4.2.3 Relative Comparison of Contours
When contours are created at a specific base elevation, the contours fall within 0.1 m of each respective line.
Figure 4.2 10th Green, 3 Methods Compared
The contours indicated in yellow represent the S6 surface, red represents the GPS surface and the scanner is shown in cyan. These colours represent the same surfaces in both Figures 4.2 and 4.3.
Mapping Greens at City Golf Course
Figure 4.3 6th Green, 2 Methods Compared
4.2.4 Direct Comparison
Direct Comparison of Points 0.000 0.010 0.020 0.030 0.040 0.050 0.060 0.070
Maximum Minimum Average Range
D if fe re n c e ( m e tr e s )
[image:50.595.137.549.93.348.2]Horizoltal and Vertical Horizontal only
Figure 4.4 Direct Comparison of Points
From the three hundred points collected from the surface of the 8th green, on average there was a difference of 0.041 m using horizontal and vertical information. Using only the horizontal components the difference equated to 0.027 m. As demonstrated previously the GPS heights were on average 0.030 m above the control marks, this accounts for the difference between the two figures. The reason for the difference in the horizontal readings could be explained by a number of factors. Firstly, human error, through poor levelling of pole as readings were taken, inaccurate setup over marks at either the GPS base or the S6 over a sprinkler head and inaccurate measurement of instrument height. Secondly, instrument error as outlined in Chapter 2 regarding possible sources of error in GPS measurement.
Mapping Greens at City Golf Course
Table 4.4 Differences between S6 and GPS area and perimeter measurements.
Surveyed Difference Green S6 GPS Area m²
Perimeter m
5 * * 0.46 -0.034 6 * * -0.46 -0.05 7 * * 0.79 0.079 8 * * 0.14 0.016 10 * * -0.01 -0.007 11 * * 0.06 0.037 12 * * -0.76 -0.057 13 * * -0.04 -0.016 14 * * -0.53 -0.066
As the figures have been rounded to whole numbers these differences became insignificant and did not affect the end figure.
4.3
Comparison of Survey Methods
4.3.1 Methods Compared
The GPS proved to be the most unreliable of the three methods used due mainly to the problems maintaining a fixed solution to the available satellites. This was caused in the most part by the number, location and size of trees located around many of the greens. Other structures that could have affected the signal at several greens were the powerlines and metal fencing.
A stronger radio signal or a second base station set up on the other side of the golf course could also have helped with the GPS measurements.
GPS may perform more efficiently in open areas where there is minimal tree coverage and where the area is free of other features that affect the GPS signal.
each of the greens enabled for quick and easy transfer between greens as a traverse was not required.
The Scanner was very efficient in collecting a large volume of data however proved very time-consuming for processing. This will be discussed in further detail in Section 4.3.2 Time Comparison.
4.3.2 Time Comparison
[image:52.595.122.547.337.557.2]Table 4.5 below shows a break down of the average times taken to perform each of the tasks.
Table 4.5 Time comparison
Task Scanner Robotic GPS
Set up 15 min each green 10 min each green 15 min initial base setup
Collection of data 5 min per scan 40 min dependant on number of points
40 min dependant on number of points
Pack up 10 min each green 5 min each green 10 min base pack up
Processing results 5 hours plus per green
1 hour per green 1 hour per green
Mapping Greens at City Golf Course
The setup and pack up of the instruments was very similar between methods. The exception was for the GPS that only required the one setup for the whole course rather than setting up at each green with the other two methods.
When it came to the processing of the data for each of the methods, the robotic total station and GPS provided the same information and file formats that the processing times were comparable.
The scanner required a lot more processing than the other methods. This is due to a number of reasons. Firstly, a lack of knowledge of the processing software, I-Site and many hours trial and error in order to achieve the desired results. Having to learn the program while processing data, is not an ideal situation. The processing power and the storage capacities of the computer used to run the I-Site software was not powerful enough to run and operate the program effectively. A lot of time was spent waiting for the program to execute a command.
4.3.3 Costs Comparison
For the cost comparison hourly rates and times are approximate and do vary between firms. The hourly rate for the scanner is based on the Trimble GX Series for which the daily hire rate as at October 2006 is $2600.00 + GST. This rate includes;
• Trimble GX Scanner
• Trimble GX Scanner accessories – batteries, tripods, targets etc.
• Trimble 3Dipsos and RealWorks software licenses
• Trimble GX Scanning specialist
As an experienced person is available for the operation of the scanner and processing software, the processing time for the scanner has been reduced to be equivalent to that of the other two methods. With a daily hire rate, the processing is therefore charged at the same hourly rate as the collection of data.
for one scan per green, this may not be possible due to the level of undulations in which case multiple scans may be required to acquire a complete coverage of the green. Control for the site was considered to be the same cost for each method and therefore not included in the breakdown.
Table 4.6 Approximate costs for conducting survey
Method Task
Time hours
Hourly
Rate Quantity Cost S6 Collection 1 $150.00 19 $2,850.00
Processing 1 $100.00 19 $1,900.00
Total
Cost $4,750.00
Method Task
Time hours
Hourly
Rate Quantity Cost GPS Collection 0.7 $200.00 19 $2,660.00
Processing 1 $100.00 19 $1,900.00
Total
Cost $4,560.00
Method Task
Time hours
Hourly
Rate Quantity Cost Scanner Collection 0.5 $325.00 19 $3,087.50
Processing 1 $325.00 19 $6,175.00
Total
Cost $9,262.50
[image:54.595.128.473.186.457.2]Mapping Greens at City Golf Course
project. The advantages and disadvantages of using a scanner for the collection of golf green surfaces include:
Advantages
• Large point cloud
• Quick acquisition time – Reduced field time.
• Minimum hazards to workers as data can be collected remotely as no prisms are required
• Can operate under all lighting conditions (24 hours a day)
• Map obscured areas (tree canopy, under bridges, culverts, tunnels, shadows) Disadvantages
• Can give a lot more data than required
• Longer processing times
• Can be more expensive
• Second method still required to coordinate scans onto a coordinate system. The advantages and disadvantages of using a Robotic Total Station system include:
Advantages
• One person operation – The S6 provides for easy operation for a single person when collecting point data. The instrument provides a smooth
tracking operation and the target can be easily located through a touch screen joystick control.
• Accurate coding of points is achievable as the surveyor is at the location of the point being captured not at the instrument some distance away. Not so much an issue on small featureless areas such as golf greens.
• Error minimisation – no communication errors between field party members as only the surveyor is required.
• High levels of accuracy obtainable – eliminates human sighting errors Disadvantages
• multiple setups required
• line of sight required
• Only one setup required – the base station when using RTK surveying
• Quick collection time – when the signal is fixed
• No line of sight required Disadvantages
• Many obstructions to signal on established golf courses – Trees, power lines, fences.
• Vertical heights are not as accurate as other methods.
4.4
Plans Created
A number of plans have been created throughout this project. Firstly a ‘map of greens’ was created and secondly individual contour plans were created for each green. The created plans will now be discussed and shown.
4.4.1 Green Plan
The map of greens is a plan showing the shape of each green and the location of any hazards in the immediate area. Hazards identified are trees, bunkers and water hazards. The plan created is an update on a plan created by Daniel Baker, 2003. A copy of the original file was obtained and modified to remove unused information and provide the new updated plan including the addition of a 19th green used as a spare during hole closures and maintenance. The purpose of this plan is to show players the daily hole placements. To achieve this the plan is printed at an A1 size and been laminated before being framed behind a sheet of Perspex to allow hole locations to be easily changed.
Mapping Greens at City Golf Course
4.4.2 Contour Plans
Mapping Greens at City Golf Course
4.5
Conclusion
The aim of the project is to map the shape and slope of the greens at Toowoomba City Golf Course (TCGC) and provide a contour plan of each green. Each of the greens has had a contour plan produced using conventual surveying techniques to capture the data. The reasoning behind the use of the S6 data to provide the contour plans is due to it proving to be the most efficient and easy to use method of the three used.
RTK GPS was the easiest of the three methods for data capture. With little in the way of setup required, GPS provided for easy transfer between green as a line of sight was not required. Although easy to operate and collect data, there were many problems maintaining a fixed solution due mainly to the number and size of trees located around the greens. Due to this and the unreliable height measurements GPS was determined to be not accurate enough for the purpose of mapping golf greens.
The scanner while the most efficient at collecting data the processing of the results was very time consuming. Scanning was also determined to be the most expensive and there was no gain in the level of accuracy obtained over the robotic total station.
Mapping Greens at City Golf Course
CHAPTER 5
CONCLUSION AND RECOMMENDATIONS
5.1
Introduction
There are a number of different methods and techniques used in the surveying industry today that can be adapted to perform most surveying jobs. In this project three different types of data collection were used to provide a contour plan of the greens at TCGC.
As stated throughout this project, the three methods used are GPS, robotic total station and digital scanner. Each of these methods has their own advantages and disadvantages that are used to determine the best instrument for particular project.
This chapter will discuss the outcomes and conclusions from this project and put forward further recommendations to expand on this project.
5.2
Discussion
The aim of the project, as stated in Chapter 1 “is to map the shape and slope of the
greens at Toowoomba City Golf Course and provide a contour plan of each green”.
Contour plans for the 19 greens in play at TCGC have been created and appear in Appendix E 1 to 19.
the control points collected with a range of 0.033 m. The height measurements were not as consistent as the other two methods and this caused for some of the contours created to cross a number of contour lines formed by the other methods. This returned an incorrect representation of the greens surface.
Scanning was the most efficient method at collecting data, providing large quantities of information for processing. This required a program specifically designed to handle these large volumes of data. The processing and filtering of the information was performed in I-Site Studio. Processing was very time consuming due to a lack of knowledge of the program. The time taken to process the files would only be reduced with some training and frequent use. Scanning was also determined to be the most expensive and there was no gain in the level of accuracy obtained compared the robotic total station.
While the most time consuming process was determined to be the most efficient method the capture data. The S6 is an easy to use instrument that provided the highest level of accuracy with 95% of check observations within 0.1 of a contour interval. This method was used to produce the contour plans as it provided the most accurate output, as well as user friendly operation of the instrument.
5.3 Implications
Mapping Greens at City Golf Course
5.4 Further research and recommendations
Further research can be carried out in the area of a slope analysis of each of the greens to provide details as to the gradients and further slope information. 3 dimensional
modelling of the course would also be possible, tying together the green details of this project and previously gathered course information. In creating this it would open up the possibility of creating a ‘fly through’ along each hole or even just over the green to provide a clearer picture of which direction the ball will roll.
The golf course may be able to provide digital information to players for his/her GPS mapping devices to accurately obtain a distance to the centre of a green from any location on the course.
5.5 Conclusion
This research has resulted in the conclusion that the most efficient and accurate method of collecting data for the purpose of producing contour plans of golf greens is through the use of a robotic total station. As stated the total station used for this project was the Trimble S6.
BIBLIOGRAPHY
Riegl Laser Management Systems 2006, 3D Imaging Sensor LMS-Z210
http://www.riegl.com/terrestrial_scanners/lms-z210ii_/210ii_all.htm
[Accessed 8 May 2006]
Riegl Laser Measurement Systems GmbH 2001, Laser Mirror Scanner LMS-Z210(-HT)
– Technical Documentation and Users Instructions, Austria, , [2006, May 2006].
Trimble 2006,
http://www.trimble.com/index.aspx
[Accessed 8 May 2006]
Hope Island Golf Club
http://www.hir.com.au/golf/holebyhole/hole1.asp
[Accessed 10 May 2006]
Club Pelican Golf Course
http://www.pelicanwatersgc.com.au/golf-course-layout.php#
[Accessed 10 May 2006]
The Royal and Ancient Golf Club of St Andrews
http://www.randa.org/index.cfm?action=randaclub.home&cfid=4100804&cftoken=113 09845 [Accessed 23 July 2006]
Golf Live
Mapping Greens at City Golf Course
APPENDIX A
University of Southern Queensland
FACULTY OF ENGINEERING AND SURVEYING ENG 4111/4112 Research Project
PROJECT SPECIFICATION
FOR: WADE REYNOLDS
TOPIC: MAPPING GREENS AT CITY GOLF CLUB
SUPERVISORS: Peter Gibbings
Frank Young
PROJECT AIM: The aim of the project is to map the greens at Toowoomba City Golf Course and provide a contour plan of each green.
PROGRAMME: Issue A, 14th March 2006
1. Undertake a review of literature on mapping with the various methods. 2. Establish and verify control points to use during the mapping process. 3. Map areas using a combination of method, (GPS, robotic total stations and
digital scanner) and create a hard copy map of greens and adjacent features and a digital contour plan of the greens at Toowoomba City Golf Course.
4. Analyse the accuracies achieved in the mapping and contouring using the different methods.
5. Report and document results
Mapping Greens at City Golf Course
APPENDIX B
Technical Data 3D Scanner Hardware RIEGL
LMS-Z210
Rangefinder Performance:
1)Eye safety class
according to IEC60825-1:1993+A1:1997+A2:2001
Measurement range 2) for natural targets, ρ≥ 80% for natural targets, ρ≥ 10%
up to 400 m up to 120 m Minimum range 4 m
Measurement accuracy 3) typ. ± 15 mm (averaged) typ. ± 25 mm (single shot) Measurement resolution 5 mm
Measurement rate
up to 12 000 pts/sec @ low scanning rate (oscillating mirror) 4) up to 8 000 pts/sec @ high scanning rates (rotating mirror) Laser wavelength near infrared
Beam divergence 5) 3 mrad
Scanner Performance:
Vertical (line) scan
Scanning range 0° to 80°
Scanning mechanism rotating / oscillating mirror Scanning rate 6) 1 scan/sec to 20 scans/sec @
80° scanning range Minimum angle stepwidth 0.01°
Mapping Greens at City Golf Course
Angular resolution 0.005°
Inclination Sensors optional (specification to be
found in seperate datasheet)
Internal Sync Timer
for external GPS/INS synchronization optional (specification to be found in seperate datasheet)
True Color Channel
The optional True Color Channel, integrated in the LMS-Z210i, provides the color of the target's surface as an additional information to each laser
measurement. Color data are included in the binary data stream of the LMS-Z210i. The color channel allows straightforward texturing of 3D models by unequivocal correspondence of color pixels and range measurement.
General Technical Data
Main dimensions 437 mm x 210 mm (Length x Diameter)
Weight approx. 13 kg Interface:
for configuration & data output for configuration
for data output
Ethernet TCP/IP, 10/100 MBit/sec
RS232, 19.2 kBd parallel, ECP standard (enhanced capability port) Power supply input voltage 12 - 28 V DC
Power consumption typ. 78 W max. 96 W Current consumption
@ 12 V DC @ 24 V DC
typ. 6.5 A max 8 A typ. 3.25 A max 4 A
Temperature range -10°C to +50°C (operation), -20°C to +60°C (storage)
Protection class IP64, dust and splash-water proof
1) First, last, or alternating target mode selectable from scan line to scan line.
2) Typical values for average conditions. Maximum range is specified for flat targets with size in excess of the laser beam diameter and near to normal incidence of the laser beam. In bright sunlight, the operational range is considerably shorter than under an overcast sky.
3) Standard deviation, plus distance depending error ≤±20ppm.
4) Without true color channel.
5) 3mrad correspond to 30 cm beamwidth per 100 m of range. 6) Scanning rates selectable via RS232.
APPENDIX C
Mapping Greens at City Golf Course
Network Adjustment Report
Project : Golf Course Base Setup
User name W0008843 Date & Time 4:27:08 PM 16/05/2006 Coordinate System Map Grid of
Australia (GDA) Zone Zone 56
Project Datum ITRF
Vertical Datum Geoid Model AUSGEOID98
(Australia) Coordinate Units Meters
Distance Units Meters Height Units Meters
Adjustment Style Settings - 95% Confidence
Limits
Residual Tolerances
To End Iterations : 0.000010m Final Convergence Cutoff : 0.005000m
Covariance Display
Horizontal
Propagated Linear Error [E] : U.S.
Constant Term [C] : 0.00000000m Scale on Linear Error [S] : 1.96
Three-Dimensional
Propagated Linear Error [E] : U.S.
Constant Term [C] : 0.00000000m Scale on Linear Error [S] : 1.96
Elevation Errors were used in the calculations.
Adjustment Controls
Compute Correlations for Geoid : False
Horizontal and Vertical adjustment performed
Error in Height of Antenna : 0.002m Centering Error : 0.002m
Back to top
Statistical Summary
Successful Adjustment in 2 iteration(s)
Network Reference Factor : 0.93 Chi Square Test (αααα=95%) : PASS Degrees of Freedom : 3.00
GPS Observation Statistics
Reference Factor : 0.93 Redundancy Number (r) : 3.00
Individual GPS Observation Statistics
Observation ID Reference Factor Redundancy Number
B4 0.91 0.95
B5 0.95 1.03
B7 0.93 1.02
Weighting Strategies
GPS Observations
Default Scalar Applied to All Observations
Scalar : 1.00
Back to top
Adjusted Coordinates
Adjustment performed in
WGS-84
Number of Points : 3
Number of Constrained Points : 0
Adjusted Grid Coordinates
Mapping Greens at City Golf Course
Point
Name Latitude
E
error Longitude
N
error Height
h
error Fix psm40382 27°35'35.78640"S 0.003m 151°56'59.12635"E 0.003m 698.046m 0.004m golf base
01 27°34'50.91439"S 0.003m 151°56'28.63955"E 0.003m 686.396m 0.004m ANANGA 27°36'05.21839"S 0.003m 151°55'54.57152"E 0.003m 761.769m 0.004m
Coordinate Deltas
Point Name ∆∆∆∆Eastin g ∆∆∆∆Northin g ∆∆∆∆Elevatio n ∆∆∆∆Heigh
t ∆∆∆∆Geoid Separation
psm40382 0.013m -0.071m N/A -1.011m N/A
golf base 01 -0.024m 0.180m N/A -0.129m N/A
ANANGA 0.012m -0.109m N/A 1.140m N/A
Control Coordinate Comparisons
Values shown are control coord minus adjusted coord.
Point Name ∆∆∆∆Eastin g ∆∆∆∆Northin g ∆∆∆∆Elevatio n ∆∆∆∆Heigh t psm40382 -0.013m 0.071m N/A 1.011m
ANANGA -0.012m 0.109m N/A 0.938m
Back to top
Adjusted Observations
Adjustment performed in
WGS-84
GPS Observations
Number of Observations : 3 Number of Outliers : 0
Observation Adjustment (Critical Tau = 1.72). Any outliers are in red.
Obs.
ID From Pt. To Pt. Observation
A-posteriori Error (1.96σσσσ)
Residual Stand. Residual
B7 ANANGA psm40382 Az. 62°54'11.7007" 0°00'00.4694"
-0°00'00.0394" -0.23
∆∆∆∆Ht. -63.724m 0.007m 0.004m 1.58
Dist. 1988.672m 0.004m -0.001m -0.65
B5 ANANGA golf base
01 Az. 22°13'20.6591" 0°00'00.3770" 0°00'00.0795" 0.58
Dist. 2470.656m 0.004m 0.001m 0.34 B4 psm40382 golf base
01 Az. 328°48'32.2891" 0°00'00.5689"
-0°00'00.1217" -0.60
∆∆∆∆Ht. -11.650m 0.006m 0.003m 1.57
Dist. 1614.588m 0.004m 0.000m 0.32
Back to top
Histograms of Standardized Residuals
Back to top
Mapping Greens at City Golf Course
Tick Size: 0.0010m Horizontal Bivariate Scalar: 2.45σ Vertical Univariate Scalar: 1.96σ
Back to top
Covariant Terms
Adjustment performed in
WGS-84
From
Point To Point Components
A-posteriori Error (1.96σσσσ)
Horiz. Precision (Ratio) 3D Precision (Ratio)
psm40382 golf base
01 Az. 328°48'32.2891" 0°00'00.5689" 1:361416 1:361416
∆∆∆∆Ht. -11.650m 0.006m
∆∆∆∆Elev
. ? ?
Dist. 1614.588m 0.004m
psm40382 ANANGA Az. 242°53'41.7953" 0°00'00.4694" 1:444884 1:444884
∆∆∆∆Ht. 63.724m 0.007m
∆∆∆∆Elev
. ? ?
Dist. 1988.672m 0.004m golf base
01 ANANGA Az. 202°13'04.8802" 0°00'00.3769" 1:553264 1:553264
∆∆∆∆Ht. 75.373m 0.007m
∆∆∆∆Elev
. ? ?
Dist. 2470.656m 0.004m