Handwritten Signature Verification Using
Complementary Statistical Models
Alan McCabe and Jarrod Trevathan
Discipline of Information Technology, James Cook University, Australia Email: [email protected], [email protected]
Abstract— This paper describes a system for performing handwritten signature verification using complementary sta-tistical models. The system analyses both the static features of a signature (e.g., shape, slant, size), and its dynamic fea-tures (e.g., velocity, pen-tip pressure, timing) to form a judg-ment about the signer’s identity. This approach’s novelty lies in combining output from existing Neural Network and Hidden Markov Model based signature verification systems to improve the robustness of any specific approach used alone. The system performs reasonably well and achieves an overall error rate of2.1%in the best case. The results of several other experiments are also presented including using less reference signatures, allowing multiple signing attempts, zero-effort forgery attempts, providing visual feedback, and signing a password rather than a signature.
I. INTRODUCTION
Handwritten Signature Verification (HSV) is a comput-erised method for verifying a person’s identity by exam-ining the characteristics of, and the manner in which s/he signs his/her signature. HSV is considered more natural and less intrusive than other forms of biometric verifica-tion such as finger printing and retinal scanning. Static HSV systems observe the general form of a signature looking at characteristics such as shape, size and slant. Dynamic HSV systems measure features specific to the way the person signs his/her name in real time including pen-tip pressure, velocity, duration, etc. The main goals for a HSV system are to reduce the False Acceptance Rate (FAR) – the number of forgeries accepted as genuine; and also to reduce the False Rejection Rate (FRR) – the number of genuine signatures that are rejected as forgeries. The Overall Error Rate (OER) = FAR + FRR. Statistical models such as the Neural Network (NN) and Hidden Markov Model (HMM) naturally lend themselves to be used as classifiers for HSV systems. Previous papers have dealt specifically with these two complementary approaches to HSV (see [21], [22]). For example, the NN approach from McCabe et al [21] is based largely on the analysis of global features of the handwriting, whereas the Hidden Markov Model (HMM) approach from McCabe and Trevathan [22] examines the local aspects. However, there has been limited research into the process of combining, or “fusing”, the two methods in order to improve the robustness and performance into a single, powerful HSV system.
Fusion of multiple classifiers is a sub-field of biomet-rics research that has recently gained in popularity. There
are a number of advantages to be gained by combining the output of multiple biometric systems:
• Improved performance: If the underlying systems are complementary and the fusion is done well, the per-formance of the resulting system will be better than that of the constituent systems. This is analogous to consulting a group of experts and making a decision based on multiple opinions, rather than consulting just one expert, and is the primary advantage of combining classifiers;
• Increased universality: The resulting system is gener-ally applicable in more situations. This comes about because if one classifier is confused, a decision may still be made using the other(s);
• Compromises: Use of multiple systems introduces the possibility of “compromises” if the classifiers disagree. For example, offering restricted access if one of the classifiers verifies a signature and the remainder do not.
The problem of fusing the output of multiple verifiers is not a simple one and is subject largely to the properties of the constituent systems. It is not valid to assume that the combination will always improve performance, for example it is known that a strong system is better used alone than in combination with a weak one [8]. The under-lying classifiers should be complementary and redundancy between classifiers may actually degrade accuracy [24].
This paper describes a system for performing HSV The system analyses both the static and dynamic features of a signature to form a judgment about the signer’s identity. This approach’s novelty lies in combining output from ex-isting NN and HMM based signature verification systems [21], [22] to improve the robustness of any specific ap-proach used alone. The system performs reasonably well and achieves a 2.1% OER in the best case. The results of several other experiments are also presented including using less reference signatures, allowing multiple signing attempts, zero-effort forgery attempts, providing visual feedback, and signing a password rather than a signature. It is worth noting that the two classifiers being com-bined in this paper are complementary in terms of the type of data captured (local versus global) and in terms of misclassifications. Many of the misclassifications by the individual systems occur on different signatures suggest-ing that the models capture some independent information that may be exploited.
previous work into the combination of multiple handwrit-ten signature classification algorithms. Section III presents the methodology and the experimentation performed by combining the models described in [21], [22]. Section IV presents some further results of interest obtained through-out testing of this final system. Section V provides some concluding remarks.
II. PREVIOUSWORK
There are limited studies into the combination of mul-tiple handwritten signature classification algorithms. The discussion in this section is centred around methods of classifier combination, or fusion, applied to biometrics other than handwritten signatures.
There are three phases in which classifiers can be combined: the feature extraction phase, the confidence phaseand thedecision phase[29]. The feature extraction phase generally involves the use of multiple sensors and is not relevant to this paper. The confidence phase is where most of the following discussion is based and involves combining the actual confidence values output by each of the classifiers. The decision phase involves combining the binary accept/reject decisions of each of the classifiers, and approaches dealing with this phase are also considered below.
One of the better designed and developed systems in the HSV literature is an approach combining both local and global information in multiple models [18]. Twenty-three global features were used in the study including total duration, pen-down ratio and velocity and acceleration details. The global feature comparison is done through the Euclidean distance metric applied between the feature vector extracted from the test signature and the reference (a vector of mean feature values taken from six sample signatures).
The local feature comparison is much more complex in that HMMs were used to compare feature vectors. Six sample signatures are used to train the HMM to model the user’s signature as a series of states with probabilistic transitions between them. Given a test signature, the Viterbi algorithm [27], [36] is used to search for the most likely state sequence corresponding to the given observa-tion sequence and give the accumulated likelihood score along the best path. That is, the algorithm obtained the likelihood that the test signature can be modelled by the HMM of the particular user. The difference between this score and the mean likelihood obtained during training is then used as an error measure to classify a test signature as valid or a forgery.
The authors combine the output of the global feature comparisons made using the Euclidean distance metric and the local comparisons using the HMM. Weights were associated with each technique and the two were com-bined using another Euclidean method by computing their root mean-square weighted combination. The authors only attempted a naive combination using equal weights. The global feature comparison (4.5% Equal Error Rate 1
1EER is the point at which the FAR and FRR are of equal value.
(EER)) had a better error rate that the local approach (about 5% EER) and the combination method improved the result to a 2.5% EER. This reduction in error rate is brought about due to the complementary information being captured by the two different models.
A number of interesting concepts are introduced in [1], [2] The main aspect of interest is the method by which the authors combined NNs and HMMs into a single handwriting recognition system. Specifically, they use a NN that spots and recognises characters and a HMM to interpret the network output by taking word-level constraints into account. The NN and the HMM are jointly trained to minimise an error measure defined at the word level. The HMM models the long-range sequential structure while the NN classifies characters using local spatial structure.
The NN used is a Multi-Layer Convolutional Neural Network [6], [7], which is a feed-forward NN designed to minimise the sensitivity to image transformations (trans-lation, rotation etc.). The network training is done using the back-propagation algorithm. Three-state HMMs with left-right transitions are used and the NN outputs observed for each character. The observation graph was obtained by connecting these character HMMs.
A later, independent system also attempted to combine the advantages of NNs and HMMs for handwriting recog-nition (see [28]). The approach was based on the use of a NN to model probability density functions. More specifically, the authors replaced the K-Means vector quantizations in a discrete HMM by a NN trained using the maximum mutual information principle (see [23]). This hybrid system was shown experimentally to outper-form regular discrete HMMs in this environment, slightly increasing maximum recognition rates from 94.6% to 95.0%.
Another study appears in [37] where the authors tried to fuseN decisions made about the author of handwriting samples. This method of fusion differs slightly from others reported in the literature in that it involves fusing the decisions made by the same classifier on a series ofN
words, known to be produced by the same author (what is not known is whether the author is a forger). That is, each word is verified separately and a probability is generated representing the level of belief that the writing sample is genuine. These N decisions are then fused to make one final decision. A one-dimensional feature vector is derived from each word to make individual assessments of authorship, and a modified randomised Neyman-Pearson test (a method of combining multiple simple hypotheses with individual likelihoods) is used to fuse the separate decisions. Using three words, the results were improved from the one-word non-fusion system error rate of 10% to 1.45% using the fused decisions.
by the same group with a slightly different approach [38]. These individual decisions are fused using the Bahadur-Lazarsfeld expansion, which is a method of incorporating multiple probabilistic confidences where independence is not assumed. As in the previous work, the writer identification was carried out using the words of a short sentence with each word being processed separately and used to verify the author of the writing. The average OER is again improved over the individual error rates.
The work in [25] explores cooperation of multiple clas-sifiers for character recognition in an attempt to combine two independent nearest-neighbour systems, one off-line and one on-line. The advantage of using both data types is that the on-line data are richer, as they supply temporal information, but more heterogeneous too as the same character can be made of a variable number of strokes that may be differently ordered (defining many character allographs). Sixty-two different character classes are used with more than 75,000 examples in the dataset, although the style of the handwriting (cursive, hand printed or mixed) is not described. The authors use naive weighting, cascading architecture and neural strategies. The weight-ing and cascadweight-ing architecture approaches both resulted in a 30% relative improvement over the most successful individual (dynamic) system and the neural approach (which involved using a Multi Layer Perceptron (MLP)) returned a 50% relative improvement.
More recent work in fusion of handwriting recognition systems appears in [35]. The authors compared four dif-ferent combination algorithms (Borda count and Choquet integral from [12] and majority rule and averaging from [34]) with their own approach called modified Borda count. They use these approaches to fuse three handwrit-ing recognition techniques that use different segmentation and NN algorithms.
When trying to recognise a single written string, con-ventional Borda count for a word in a lexicon (a dictionary of words the system is trying to recognise) is defined as the sum of the number of words with lower recognition scores in the different lexicons produced by the various techniques. A higher value for Borda count indicates a stronger belief that a particular word is correct. The problem with conventional Borda count is that it doesn’t take into account the confidence values produced by the various techniques (only the rankings). The authors modify this in [35] by essentially summing the product of the ranking and confidence for each technique. It is also possible to assign a weighting to each technique based on the observed recognition accuracy for that approach.
The testing of the individual and combined techniques was performed using cursive handwritten words taken from the CEDAR database [15]. The most successful of the individual techniques resulted in a recognition rate of 88%. When using the optimal weight values for the modified approach (calculated via brute force) the recognition rate improves to 91%.
It is possible to apply the modified Borda count ap-proach to the HSV problem, but it would be
computation-ally expensive (prohibitively so). It would be necessary to obtain verification scores for each signer in the database every time a signature is verified (the equivalent of per-forming signature identification rather than verification). This is impractical for a signature database of any realistic size.
The most popular area for fusion of multiple classifiers is that of multibiometrics, where the output values from multiple biometrics-based systems are combined to give a single result [3], [16], [29]. Systems that combine multiple different biometrics are very difficult for a forger to compromise. However, it is generally accepted that com-bining multiple representations and matching algorithms for the same biometric signal (the approach described in Section III) is the most cost-effective and convenient way of improving biometric performance [24].
The authors in [29] and [30] consider three separate approaches to combining information at the confidence level and report on the results obtained. Attempts are made at combining the output of three separate biomet-ric verification systems in face verification, fingerprint verification and hand geometry verification. The three approaches considered are the sum rule, decision trees andlinear discriminant functions. Fifty users contributed nine face images, nine fingerprint impressions (of the same finger) and hand geometry data. The best individual biometric is found to be fingerprinting at an 11% OER.
The sum rule approach involves taking the weighted sum of the individual output values from each classifier. The authors applied equal weight values to each combi-nation of inputs. Experimentation found consideration of two biometrics to be more successful than any individual biometric, and all three to be more successful than any two. This method resulted in a 1.78% FRR and a 0.03% FAR.
Decision trees are structures that take a set of properties as input, and through a process of discrete decision mak-ing arrive at a binary output (see [31]). The authors used the well known softwareC5.0 [26] to generate a decision tree from a training set of over 11,000 “imposters” and 225 genuine subjects. The result of this was a 9.6% FRR and a 0.04% FAR.
The final method investigated was the linear dis-criminant function approach. This involved transforming the three-dimensional output vectors (one dimension for each classifier) into a new subspace and maximizing the between-class separation. The results using this approach were better than for decision trees but worse than the sum rule.
for each user. The second method involves estimating user-specific weights by exhaustive search and using a common matching threshold. The authors found that their most successful approach consisted of using common thresholds, but user-specific weights for each classifier. Error rates are reduced by up to 3% of the overall error using this method.
Linear discriminant analysis was also explored in [10], along with linear methods and NNs as means of combining confidence measures in a speech recognition system. The specific application area was a command-and-control style system and the confidence measures were generated using HMMs. A database of 3,345 feature vectors (roughly half allocated to training and half to testing) was used, with the vectors including five different confidence measures computed from word hypotheses. The smallest error rate for speaker-independent classifi-cation using any of the individual confidence measures was 9.8%. Using linear discriminant analysis this was improved to 9.0% and further improved to 8.4% using a one-layer perceptron to combine the confidences. Slightly more substantial improvements were reported using data-dependent confidence measures. The authors also found that use of a non-linear network (one hidden layer) trained using the back-propagation algorithm did not generalise as well as the linear network.
The above findings with respect to the sum rule’s superiority over other forms of related fusion techniques are supported in [19] where several similar approaches are explored. These are further verified independently in [20] in an approach used for fingerprint analysis (another popular target area for fusion research). The authors also extended the approach to examine theproduct rule, which involved multiplying the weighted output values from each of two classifiers. The product rule is reported to significantly improve the performance over the best single algorithm (approximately halving the error rate), however, there was no direct comparison with the results using the sum rule.
The authors in [17] used a logistic transform to in-tegrate the output values from three different fingerprint matching algorithms into a single overall score. Given the discrete probability distribution functions obtained from each classifier, the author’s algorithm computes the set of tunable parameters of the combination classifier for a set of specified FARs. Testing of the combination algorithm was done using fingerprint images captured from 167 subjects (the first 83 subjects were used to train the system and the remainder were used in testing). Small reductions in the OERs were reported under ideal circumstances, but nothing that justified the extra overhead.
This approach is augmented by a scheme proposed in [24] involving the fusion of four different fingerprint matching algorithms. A large amount of theory is also pre-sented for selecting the most appropriate classifier (based on the “independence” of classifiers). However, there are often limitations to the availability of effective systems (e.g., there are very few easily available, effective HSV
algorithms). The experimental database consisted of 2,672 impressions taken from 167 subjects (four impressions of each of four fingers), however, 100 impressions were later removed from the database due to “rejection” by the matching algorithm or due to poor quality images.
Combinations of pairs of classifiers are made by esti-mating two dimensional genuine and imposter densities from the training data. The optimal setup was found to be the combination of the three most accurate individual algorithms (excluding the fourth and least accurate), and the authors claim a 3% overall improvement. However, the weakness with this approach for HSV is that a large amount of training data is required to obtain useful estimates (of the order of several thousand), along with forgery data.
Complex Bayesian sampling approaches to the decision fusion problem have been proposed in a small number of papers (see [4]). These approaches are more suited to higher dimensionality situations involving more classi-fiers, and also have a very high computational complexity less appropriate for HSV.
Finally, a similar approach to that described in this paper is presented in [11]. The authors examine a method for combining the output of HMMs and NNs. The HMM system models a signature using a feature vector consisting of seventeen parameters (eight dynamic and nine static) including velocity, pressure, pen-tilt and some spatial characteristics. The authors use a single discrete, left-right HMM for each user and train the models using fifteen genuine signatures. The HMM technique results in a 6.30% OER.
The NN used is a MLP featuring twenty-six inputs (one for each extracted feature), a hidden layer with five units and two sigmoidal outputs (one representing genuine signatures and the other forgeries). The MLP is used to model the global parameters of the signature and includes aspects such as the number of strokes, signature length and a number of velocity, angular and directional features. Training is done using fifteen genuine signatures and one random forgery from each of fifteen other users in the database. The MLP here is used mainly to combat the high FRR exhibited by the HMM, and far less effort is put into the MLP development.
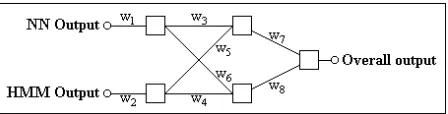
Fig. 1. The combination of models described in previous papers.
previous best case of 6.30% to 5.32% OER.
III. METHODOLOGY
This section presents the methodology and the experi-mentation performed in the combination of the models described in [21], [22]. The combination of the two classifiers essentially involves the development of a whole new classifier that has two input values: the confidence value output by the NN system and the normalized log-likelihood output by the HMM system. Figure 1 illustrates the basic approach.
A. Experimental Setup
The signature database used in experimentation is de-scribed in [21]. The type of the two input values differs in that the value provided from the NN is a confidence measure and the HMM value is a probability. However, the domains of the input values are similar in that they are both in the zero-to-one range with the same interpretation: a low score implies a low degree of confidence that a given signature is genuine, while a high score implies a high degree of confidence. What follows is a description of the different methods of combining the two models, grouped according to category.
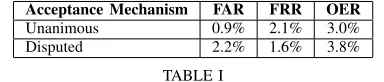
1) Voting Schemes: These are the simplest methods of combining the HMM and NN output and involve the combination being performed at the decision level. The only input taken in from the two models is the binary decision rather than the confidence values. With two different classifiers as input there are two meaningful schemes or verification scenarios than can be employed: 1) Unanimous acceptance: This means that the com-bined classifier should accept a test signature only if both constituent classifiers accept it. Put another way, the test signature should be rejected ifeither system classifies it as non-genuine. The ideal effect of this is that fewer forgeries will be accepted (as it is less likely that they will deceive both classifiers) without rejecting many more genuine signatures (as well-performed genuine signatures should be accepted by both classifiers). Table I presents the results obtained using this approach, which include the FAR, FRR and OER.
2) Disputed acceptance: This setup results in a signa-ture being accepted if it is accepted byeither classi-fier (or both). Ideally, forgeries are still rejected (as both of the constituent classifiers are quite adept at detecting forgeries) while slightly lower quality signatures from genuine users are still accepted (as they may still contain enough characteristic
Acceptance Mechanism FAR FRR OER
Unanimous 0.9% 2.1% 3.0%
[image:5.595.61.288.81.131.2]Disputed 2.2% 1.6% 3.8%
TABLE I
The results using the two different voting mechanisms to combine the classifiers.
information to be accepted by at least one of the classifiers). The results obtained using this approach are also presented in Table I. Unanimous rejection by both classifiers should obviously result in the signature being rejected.
When discussing the results presented in Table I it is useful to recall that the best OERs for our NN [21] and HMM [22] systems are 3.3% and 3.5% respectively. Relative to the individual system error rates the “Unani-mous Acceptance” results were an improvement over the most successful individual system, whereas the “Disputed Acceptance” approach actually degraded the overall per-formance. As expected, the unanimous approach resulted in a much lower FAR as it was far more difficult for a forgery to deceive both classifiers. Fortunately, there was not a greatly adverse affect on the FRR, which meant the OER was improved. The disputed approach results in the FRR slightly improving, however, the FAR increases substantially and the OER suffers as a result. Inspection of the rejected genuine signatures offers an explanation for the lack of significant improvement in the FRR in that these signatures are either poorly written or differed greatly from the signatures given as a reference for that user. As a result they tend to be rejected by both classifiers.
However, the results above do not give a definitive answer as to which acceptance mechanism is most suited to combining HSV systems. The approach to use depends largely on the environment in which the signatures will typically be provided. If the environment is casual as in a general purpose system, it is likely that the test signa-tures will be of slightly lower quality and the disputed approach is more forgiving and more appropriate. If the environment is a formal, high security one, then the added security of the unanimous approach is likely to result in more desirable performance. It is believed that the formal environment in which the handwritten signature database was captured contributed to the unanimous approaches superior performance.
A voting mechanism may also be used in granting different levels of access depending on the level of signature acceptance. That is, if both classifiers reject the test signature then no access is granted, if both accept the test signature then full access is granted or if the classifiers are in disagreement then partial or restricted access is granted.
2) Confidence-based Approaches: This section dis-cusses the various techniques used to combine the confi-dence outputs from each of the classifiers. All explored methods and resulting error rates are presented below.
referred to as simply the sum rule) involves taking the weighted sum of the individual scores from the classifiers to achieve the overall score for the combined system:
Scombined=WN N·SN N +WHM M·SHM M whereScombined is the final score for the combined model, WN N and SN N are the weight and score for the NN model andWHM M andSHM M are the weight and score for the HMM. The score values from each of the models are obtained independently and are a measure of the confidence that each model has in the test signature being genuine.
The weight and threshold values are the same for every user and are obtained in a joint training phase. This phase involves an exhaustive search that tests all weight values in the range [0,1] (with increments of 0.01) for each classifier, with the constraint that the sum of the weights is always 1. The combined scores are obtained for each weight combination and compared to a threshold. The test signature is accepted if the score is above this threshold and rejected otherwise. The threshold value and weight pairing that gave the lowest global (i.e., over all users in the database) OER are used for all further experiments. These values are 0.42 for the threshold and 0.62 and 0.38 for the HMM and NN weights respectively.
This approach worked quite well and improved the OER to 2.7% (1.5% FAR and 1.2% FRR).
• Product rule: The product rule is quite similar to the sum rule and involves taking the weighted product of classifier scores:
Scombined=WN N.SN N ×WHM M.SHM M Weight values and thresholds are obtained in the same way as they were for the sum rule approach. The product rule represents the joint probability distribution of the values extracted by the classifiers. This approach produces very similar results to that of the sum rule and obtained a 2.8% OER (1.3% FAR and 1.5% FRR).
• Mean transformation: The mean transformation is essentially a special case of the weighted sum with the weights set to 0.5 and is used in [20] to combine classifiers for fingerprint verification. This transfor-mation simply takes the mean of the two classifier scores for a test signature:
Scombined=
SN N+SHM M
2
The mean approach did not perform well in this instance, returning an overall error rate of 3.9% (1.8% FAR and 2.1% FRR), which is worse than both individual classifiers.
[image:6.595.312.536.80.137.2]• Decision trees: Results were obtained using theC5.0 program [26] to generate a decision tree from a training set of classifier score pairs. Five genuine
Fig. 2. The MLP structure that produced the lowest OER when combining the constituent systems. Each of the weight values Wi is
optimised via a learning algorithm.
score pairs were used as a reference and the score pairs from genuine signatures of twenty-five other users in the database were used as negative examples (the twenty-five users were selected in a similar way to training forgeries selected in [21]). The data seemed to be insufficient for accurate construction of decision trees andC5.0 did not perform well using only five genuine references, resulting in a 8.4% OER (5.5% FAR and 2.9% FRR).
• Multi-layer perceptrons: Multi-layer Perceptrons (MLPs) are used in [21] to build one of the constituent HSV systems. It was theorised that a non-linear classifier such as a MLP may be able to achieve better classification by capturing a more insightful relationship between the two confidence measures. The basic model structure consists of a three-layer network with two input units and one out-put unit. The back-propagation algorithm was used to train the model and experimentation was done with different numbers of nodes in the hidden layer, but the most successful structure found contained two hidden nodes. Figure 2 illustrates the structure (refer to [21], [22] for specific information regarding the type of activation functions used).
The makeup of the training set (in terms of positive and negative examples) was identical to that used for the decision tree approach described previously. The MLP’s performance over the training set was very good but did not generalise as well to the test set, most probably because of the small amount of input data. The OER using this approach was 3.0% (1.3% FAR and 1.7% FRR).
• User-specific weighted sum: This is the most success-ful of the approaches to combining model scores. The method here is similar to that used in the “weighted sum” approach, modified to apply to individual users. The basic algorithm for adjusting the user-specific weights is as follows:
1) For useri, vary weightsWN N,i andWHM M,i over the range [0,1] (with increments of 0.01) with the constraint that WN N,i+WHM M,i equals 1;
2) The overall score used for verification is then:
Si=WN N,i×SN N,i+WHM M,i×SHM M,i 3) Si is compared to a user-specific thresholdTi for each user and the test signatures is accepted if Si> Ti and rejected otherwise;
Combination Method FAR FRR OER Product rule 1.3% 1.5% 2.8% Mean transformation 1.8% 2.1% 3.9% Decision trees 5.5% 2.9% 8.4% Multi-layer perceptrons 1.3% 1.7% 3.0% Weighted sum 1.5% 1.2% 2.7% User-specific weighted sum 1.1% 1.0% 2.1%
TABLE II
The resulting error rates using the different confidence-based approaches to combining the classifiers.
minimises the total error rate associated with the overall scores.
Here WN N,i refers to the user-specific weight asso-ciated with the NN output for user i andWHM M,i refers to the user-specific weight associated with the HMM output for useri. SimilarlySN N,irefers to the score (i.e., output or confidence) from user i’s NN andSHM M,ithe score from useri’s HMM.Sirefers to the overall score value for useri. The total error ratereferred to in step 3 of the algorithm (not to be confused with theoverallerror rate) is the sum of the individual error rates calculated during the training phase. Details of the weight and threshold selection appear below.
The overall score Si is obtained for each weight combination in the range [0,1] (with increments of 0.01), with the constraint that the sum of the weights is always 1. In an extended training phase, error rates are calculated using the original reference signatures as genuine attempts (i.e., the training and testing databases remain separate) and a set of thirty-five forgeries (obtained from the other users in the database in the same manner as described in [21]). These error rates are calculated by exhaustive experimentation with threshold values, varying the threshold in the range [0,1] (with increments of 0.01) for each weight pairing. The threshold and weight values triple that produces the lowest OER is then fixed for that user. Often a range of weight values results in an OER of zero for a particular user - in this case the median of each weight range is used. Similarly, the median threshold is used when there is a range of threshold values resulting in the equal lowest error rate.
OERs for each user are then calculated using the fixed weight and threshold values with the previously unseen genuine signatures and skilled forgeries being used as test signatures. This approach improved the OER to 2.1% (1.1% FAR and 1.0% FRR) and returned an EER of 1.1%. All error rates quoted in following sections will be based on this user-specific weighted sum approach unless otherwise specified. Table II summarises the results of all of the confidence-based methods of combination.
A summary of all of the developmental models appears in Table III, including the NN alone, the HMM alone, both models combined via the weighted sum rule and
Model FAR FRR OER
Neural network 1.1% 2.2% 3.3% Hidden Markov model 1.2% 2.3% 3.5% Weighted sum 1.5% 1.2% 2.7% User-specific weighted sum 1.1% 1.0% 2.1%
TABLE III
The most successful results for each of the different model scenarios used during development. The weighted sum is shown for comparative
purposes.
both models combined via the user-specific weighted sum approach. As can be seen, the combination of models resulted in an increased performance over both individual models, with the user-specific weighted sum approach being most successful.
It is generally believed that MLP will outperform this method if enough training examples are used. However, in this paper we wish to base the MLP as a comparison for the user-specific weighted sum approach using the same set of test data. For this reason, we have not tested the MLP using more training data to verify this.
IV. FURTHERRESULTS
The lowest error rate obtained for any system described in this paper (the “User-specific weighted sum” version of the combined network) produced an OER of 2.1% when tested over the entire database. This section presents some further results of interest obtained throughout testing of this final system.
A. Removal of “Short Signatures”
Any methodology that includes the removal of “un-suitable” signatures from a database is dubious, but is done here for comparative purposes. Other researchers (e.g., [9]) have examined this aspect, purely for the sake of interest not through any attempt to artificially reduce the reported error rates of their systems. Short signatures (those with a duration less than some timet) are going to contain less information and be more variable than signatures of more significant length. Due to this lack of consistent information content it is more difficult to verify genuine short signatures and more difficult to reject attempted forgeries of these. As such, although these signatures constitute a small percentage of the database, they have a disproportionately large affect on the error rates. It can be argued that removing these signatures from the database gives a fairer description of the accuracy of the system in question.
Fig. 3. The average signature duration (in seconds) per signer.
Fig. 4. The OER versus the duration threshold. Signers with an average signature duration less thantseconds were removed from consideration. Error rates generally improve as signature duration increases.
weighted sum system reduces from 2.1% to 1.6% using this same limit (which excludes a total of seven users from consideration).
B. Contribution to Overall Error
For various reasons it is typical for a small proportion of signers to be responsible for a large proportion of the error rate. Reasons for this include small signature duration as discussed in the previous section, unusually large variation in signature style or in extreme cases signers may have more than one version of their signature (as was the case with one signer in the database used throughout this paper). These types of users are always going to be present in a large-scale realistic database, so it is not valid to exclude these users from calculations of error rate. However, it is insightful to examine individual user’s contributions to the OER.
Figure 5 is a plot of these individual contributions and illustrates that the majority of the error is contributed by a minority of the users. The entire error is contributed by eleven users, over 35% of the error is contributed by two users and over 45% is contributed by three. The verification is perfect for over 90% of the users (the exact weight and threshold values selected for these users is less important as small variations had no effect on the verification error rates).
C. Allowing Users Another Chance When Rejected This approach has been taken by other authors in the literature [13], [32] and is perhaps a realistic approach
Fig. 5. A plot of individual contributions to OER, sorted in order of increasing contribution.
to how HSV systems would function in a general usage scenario. If a test signature is rejected by the particu-lar HSV system, then this approach allows the signer to attempt verification again (typically a maximum of three attempts). This would be acceptable in a situation where more importance is placed on lowering the FRR and lessening the inconvenience to genuine users, rather than the emphasis being placed on security. Less false rejections will occur through this method, however, there will most likely be an increase in false acceptances.
Experiments conducted to evaluate the success of this kind of approach involve firstly training the system, then presenting test signatures to the system for each user (as with other testing approaches). The difference here is that if the test signature fails, the following signature is tested, and a third if the second also fails. Acceptance is deemed to occur as soon as one of the test signatures is verified, but if all three signatures fail the test signer is rejected. As expected, the FRR is improved dramatically using this approach to 0.1% with FAR suffering, rising to 1.5%.
There are a number of modifications that can be made in this sort of system, such as only allowing users to re-try if one of the constituent classifiers verifies the test signature.
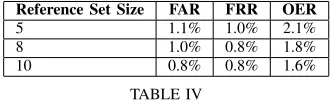
D. Varying the Size of the Reference Set
All results discussed so far involve the use of just five reference signatures. Many systems presented in the literature require more than five samples (typically ten) in order to build a reference (e.g., [5], [33]). Using more reference signatures will most likely lead to lower error rates as it allows further information to be extracted and more effective models to be built. The cost of using more reference signatures is extra computation, extra memory storage, greater inconvenience to users and the risk of them getting frustrated and refusing to use the system at all. There is also an issue with fatigue if a user is required to provide too many signatures in one sitting and a resulting loss of reference signature quality.
[image:8.595.58.287.82.354.2]Reference Set Size FAR FRR OER
5 1.1% 1.0% 2.1%
8 1.0% 0.8% 1.8%
[image:9.595.309.539.79.157.2]10 0.8% 0.8% 1.6%
TABLE IV
[image:9.595.90.257.80.130.2]A breakdown of the error rates for various reference set sizes, optimised to give the lowest OER.
Fig. 6. The OER versus the number of reference signatures used.
and Figure 6 show the affect of increasing the number of reference signatures on error rates.
Note that there are approaches that can be used to obtain larger reference sets without the inconvenience. One example is to take five reference signatures during the enrolment phase and adding any later verified signatures to the reference set and re-training the models. The obvious disadvantage with this kind of approach is that if a forgery is incorrectly verified then it will be added to the reference set, corrupting the model.
E. Zero-Effort FAR
The Zero-Effort FAR (ZEFAR) has been discussed in previous papers [21], [22] and is a measure of the “confusion” the system exhibits or the likelihood that a forger with no knowledge of the genuine signature will provide a successful forgery. ZEFAR is quoted in many HSV articles in the literature and is a useful measure as it illustrates the class separation obtained by the developed system. It is also useful as most successful forgeries in general signature verification environments are either zero-effort forgeries or are very poor attempts.
To arrive at a figure for ZEFAR, all signatures (genuine and provided forgeries) from other users in the database are used as test signatures. This means that there are 3,850 (approximately 35 signatures from each of the 110 other users) zero-effort forgeries for each user, totaling over 430,000 for the entire database. When testing the trained system, a total of 388 of these test signatures were accepted as genuine, resulting in a 0.09% ZEFAR.
Note that no re-training occurred specifically for these tests, and weight and threshold values were the same as those used in the “User-specific weighted sum” approach.
F. The Importance of Visual Feedback When Signing As part of the HSV system development a number of experiments were conducted to assess the importance of
Fig. 7. (a) A signature sample captured using a stylus to provide visual feedback to the signer. (b) A signature sample from the same author captured without the use of the stylus.
visual feedback when performing a signature. It is gen-erally accepted that the movements controlling signature production are stored in some kind of muscle or nerve “memory”. Further, once a signature has been practiced sufficiently the nerve impulses are controlled by the brain without any particular attention to detail [14].
Three experiments are conducted using the final version of the HSV system in an attempt to lend support to the hypothesis that no visual feedback is required when signing. The experiments involve thirty of the signers from the original database contributing a set of five signatures using a stylus that provided them with visual feedback as they wrote (i.e., it reproduced the pen-tip path). Visually, the stylus-based signatures appear very similar to the regular (produced without the aid of the stylus) signatures with one signer producing identical durations in two cases. An example of a more elaborate signature can be seen in Figure 7 where part (a) shows the signature sample captured using a stylus and part (b) shows a sample captured without the use of a stylus.
The first experiment involved using the stylus-based signatures to train the models. The genuine signatures previously provided by the signer (without the use of the stylus) were used as test signatures along with the previously provided forgeries (fifteen genuine signatures and five forgeries were available for testing). If the hypothesis is correct then the error rates, particularly the FRR, should be approximately the same as when there was no stylus used to produce the reference signatures. Without the use of the stylus in training the OER for these thirty users is 2.4% (1.1% FAR and 1.3% FRR). When the stylusisused the FAR remains the same and a single extra false rejection is recorded, resulting in an OER of 2.7% (1.1% FAR and 1.6% FRR).
The second experiment used the regular signatures (produced without the use of the stylus) to train the sys-tem and atsys-tempted to verify the stylus-based signatures. The FRR in this case was just 0.7% with only one of the stylus-based signatures being incorrectly classified. The FAR using this training mechanism is reported in Section III-A as 1.1%, giving an OER of 1.8% (note that the set of genuine signatures is much smaller in this experiment).
[image:9.595.60.289.170.302.2]This series of tests strongly supports the hypothesis that visual feedback is not required when reproducing practiced writings, particularly signatures.
G. Manually Adjusted Personal Thresholds
This section involves manual inspection of the class separation for comparative purposes. The “User-specific weighted sum” version of the system attempts to take into account personal weights and thresholds to maximise the verification accuracy. The approach worked quite well in most instances, however, it is very difficult to do this accurately with such a small training set. Manual calculations can be made to determine the ideal weight and threshold values and the resulting error rate. This error rate represents the maximum accuracy that can be achieved using the two models with this data. In other words, the optimal class separation obtained by the HSV system on the given data set. The OER when manually selecting the optimal weights and thresholds is 0.47% (0.16% FAR and 0.31% FRR). The system fails to achieve complete (manual) class separation on just four signatures, generated by just two signers.
H. Signing a Password
One of the issues with HSV is that an individual’s signature is generally not secret (not in the same sense that a password or personal identification number is). A potential forger may be able to obtain a copy of a genuine signature and then has the opportunity to practice (although error rates have proven to be quite good even for practiced forgeries).
In an attempt to build a variant of the HSV system that was not subject to these problems, experiments were conducted where users “signed” a password instead of their signature. Signing a password takes advantage of multiple security schemes in that a potential forger not only has to know (or guess) the user’s password, but also has to be able to reproduce the structure and style of the genuine writing.
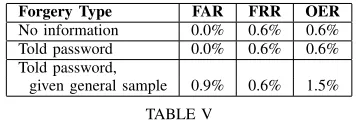
The first stage of the process involved forty-seven users being instructed to think of a password (one they could easily remember) and practice the writing over a period of one to two weeks until they felt comfortable with the writing style. The writers then provided five samples of their signed password (there was no stylus used here as to do so would have the undesirable effect of leaving a visual artifact that a potential forger can copy) on three separate occasions, totaling fifteen genuine samples per user (five of which were used in training). Three types of forgeries were gathered based on information that the forger was provided. The first type of forgery was produced by the forger where they were not given the password to be forged, so had to guess. With the second type, the forger was told the password but was not given access to the writing style. The third type of forgery involved the forger being told the password and being given a sample of the writer’s natural style, but no sample of the actual written
Forgery Type FAR FRR OER No information 0.0% 0.6% 0.6% Told password 0.0% 0.6% 0.6% Told password,
[image:10.595.333.512.79.140.2]given general sample 0.9% 0.6% 1.5%
TABLE V
The resulting error rates using different types of forgeries in the “signing passwords” variant of the HSV system.
password was given. Five of each type of forgery were gathered for each user in the database.
Table V presents the error rates using the three differ-ent forgery types. The approach works quite well with no false acceptances when the forger didn’t know the password or when the forger had no access to sample handwriting. In most cases the genuine users wrote their passwords with some originality or flair (making it very difficult to forge if this style is unknown). Conversely, forgers would sometimes try to fool the verification system by drawing straight lines or squiggles when the password was unknown.
This would be a useful general purpose standalone security system in many situations, for example in grant-ing access to a personal computer containgrant-ing sensitive information. The cost of the additional hardware is min-imal and the gain in the level of security is quite high. Personal data organisers or hand-held computers with a pen interface would also be potential environments that could benefit from this type of approach.
V. CONCLUSIONS
This paper describes a system for performing HSV using complementary statistical models. The system anal-yses both the static features of a signature (e.g., shape, slant, size), and its dynamic features (e.g., velocity, pen-tip pressure, timing) to form a judgment about the signer’s identity. This approach’s novelty lies in combining out-put from existing Neural Network and Hidden Markov Model based signature verification systems to improve the robustness of any specific approach used alone. The system performs reasonably well and achieves a 2.1%
OER in the best case. The results of several other exper-iments are also presented including using less reference signatures, allowing multiple signing attempts, zero-effort forgery attempts, providing visual feedback, and signing a password rather than a signature.
and size of the database, the verification results achieved are excellent when compared to similar research.
Future work involves the analysis of the independence of the two classifiers used in this study (and indeed the fusion classifier in general). The methodologies described in our previous papers [21], [22] present demonstrably different classifiers, both in terms of input features and learning/classification techniques. Further work would in-clude a detailed investigation as to the style of signatures that are correctly classified by both individual systems, and the tradeoff between individual classifier accuracy and independence of classifiers. In addition, it would be intuitive to investigate how the radial basis function per-forms against the multilayer perceptron structure in terms of reducing training complexity in HSV applications.
As noted in Section III-A, we have not tried to opti-mise the performance of the MLP approach using more training. An area for future research is to determine the comparative offerings when a larger training set is used for the MLP, and if and when the MLP surpasses the user-specific weighted sum approach for HSV.
REFERENCES
[1] Y. Bengio, Y. Le Cun, C. Nohl and C. Burges.LeRec: A NN/HMM Hybrid for On-Line Handwriting Recognition.Neural Computa-tion, Vol. 7, No. 5, 1995.
[2] Y. Bengio, R. Mori, G. Flammia and R. Kompe.Global Optimiza-tion of a Neural Network-Hidden Markov Model Hybrid.IEEE Transactions on Neural Networks, 3(2), pp 252-259, 1992. [3] R. Bolle, J. Connell, S. Pankanti, N. Ratha and A. Senior.Guide
to Biometrics.Springer Verlag, 2003.
[4] B. Chen and P. Varshney. A Bayesian Sampling Approach to Decision Fusion Using Hierarchical Models.IEEE Transactions on Signal Processing, Vol. 50, No. 8, 2002.
[5] H.D. Crane and J.S. Ostrem. Automatic Signature Verification Using a Three-axis Force-Sensitive Pen. IEEE Transactions on Systems, Man and Cybernetics, Vol. SMC-13, No. 3, pp 329-337, 1983.
[6] Y. Le Cun.Generalization and Network Design Strategies. Tech-nical Report CRG-TR-89-4, Department of Computer Science, University of Toronto, 1989.
[7] Y. Le Cun, O. Matan, B. Boser, J. Denker, D. Henderson, R. Howard, W. Hubbard, L. Jackel and H. Baird.Handwritten Zip Code Recognition with Multilayer Networks.IEEE Proceedings of the International Conference on Pattern Recognition, 1990. [8] J. Daugman. Biometric Decision Landscapes. Technical Report
No. TR482, University of Cambridge Computer Laboratory, 2000. [9] J.G.A. Dolfing. Handwriting Recognition and Verification - A Hidden Markov Approach.Ph.D. Thesis, Technical University of Eindhoven, 1998.
[10] J.G.A. Dolfing and A. Wendemuth. Combination of Confidence Measures in Isolated Word Recognition.Proceedings of the Inter-national Conference on Spoken Language Processing, pp 3237-3240, 1998.
[11] M. Fuentes, S. Garcia-Salicetti and B. Dorizzi.On line Signature Verification: Fusion of a Hidden Markov Model and a Neural Network via a Support Vector Machine.Proceedings of the Eighth International Workshop on Frontiers in Handwriting Recognition (IWFHR ’02), 2002.
[12] P. Gader, M. Mohamed and J. Keller.Fusion of Handwritten Word Classifiers.Pattern Recognition Letters 17, pp 577-584, 1997. [13] N.M. Herbst and C.N. Liu.Automatic Signature Verification Based
on Accelerometry.IBM Journal of Research and Development, pp 245-253, 1977.
[14] O. Hilton.Signatures - Review and a New View.Journal of Forensic Sciences, JFSCA, Vol. 37, No. 1, pp 125-129, 1992.
[15] J. Hull. A Database for Handwritten Text Recognition. IEEE Transactions on Pattern Analysis and Machine Intelligence Vol. 16, pp 550-554, 1994.
[16] A.K. Jain and A. Ross. Learning User-specific Parameters in a Multibiometric System. Proceedings of the International Confer-ence on Image Processing (ICIP), Rochester, New York, September 22-25, 2002.
[17] A.K. Jain, S. Prabhakar and S. Chen.Combining Multiple Match-ers for a High Security Fingerprint Verification System.Pattern Recognition Letters, Vol. 20, No. 11-13, pp 1371-1379, 1999. [18] R.S. Kashi, J. Hu, W.L. Nelson and W. Turin.On-line
Handwrit-ten Signature Verification using Hidden Markov Model Features.
Proceedings of International Conference on Document Analysis and Recognition, 1997.
[19] J. Kittler, M. Hatef, R. Duin and J. Matas. On Combining Classifiers.IEEE Transactions on Pattern Analysis and Machine Intelligence, Vol. 20, No. 3, pp 226-239, 1998.
[20] G. Marcialis, F. Roli and P. Loddo.Fusion of Multiple Matchers for Fingerprint Verification.Proceedings of the Workshop on Machine Vision and Perception, Italy, 2002.
[21] A. McCabe, J. Trevathan and W. Read. Neural Network-based Handwritten Signature Verification.Journal of Computers, Vol. 8, No. 3, pp 9-22, 2008.
[22] A. McCabe and J. Trevathan. Markov Model-based Handwritten Signature Verification.Proceedings of the IEEE/IFIP International Symposium on Trust, Security and Privacy for Pervasive Applica-tions, pp 173-179, 2008.
[23] C. Neukirchen and G. Rigoll. Advanced Training Methods and New Network Topologies for Hybrid MMI-Connectionist/HMM Speech Recognition Systems. Proceedings of the IEEE Interna-tional Conference of Acoustics, Speech and Signal Processing, Munich, pp 3257-3260, 1997.
[24] S. Prabhakar and A.K. Jain.Decision-Level Fusion in Fingerprint Verification.Pattern Recognition, Vol. 35, No. 4, pp 861-874, 2002. [25] L. Prevost and M. Milgram. Automatic Allograph Selection and Multiple Expert Classification for Totally Unconstrained Hand-written Character Recognition.Proceedings of the 14th Interna-tional Conference of Pattern Recognition, Brisbane, Australia, Vol. I, pp 381-383, 1998.
[26] R. Quinlan. Data Mining Tools See5 and C5.0.
http://www.rulequest.com/see5-info.html, 2002.
[27] L. Rabiner and B. Juang.Fundamentals of Speech Recognition.
Prentice Hall, New Jersey, 1993.
[28] G. Rigoll, A. Kosmala and D. Willett.A New Hybrid Approach to Large Vocabulary Cursive Handwriting Recognition.Proceedings of the International Conference on Pattern Recognition, Vol. II, pp 1512-1514, 1998.
[29] A. Ross, A.K. Jain and J. Qian.Information Fusion in Biometrics.
Proceedings Audio- and Video-Based Biometric Person Authenti-cation ’01, Sweden, pp 354-359, 2001.
[30] A. Ross and A.K. Jain.Information Fusion in Biometrics. Pattern Recognition Letters, Vol. 24, Issue 13, pp 2115-2125, 2003. [31] S. Russell and P. Norvig. Artificial Intelligence - A Modern
Approach.Prentice Hall, New Jersey, 1995.
[32] C.N. Liu, N.M. Herbst and N.J. Anthony. Automatic Signature Verification: System Description and Field Test Results. IEEE Transactions on Systems, Man and Cybernetics, Vol. SMC-9, No. 1, pp 35-38, 1979.
[33] H.E.S. Said, K.D. Baker and T.N. Tan. Personal Identification Based on Handwriting. Proceedings of the 14th International Conference on Pattern Recognition, Brisbane, Australia, pp 1761-1764, 1998.
[34] A. Verikas, A. Lipnickas, K. Malmqvist, M. Bacauskiene and A. Gelzinis.Soft Combination of Neural Classifiers: A Comparative Study.Pattern Recognition Letters, Vol. 20, pp 429-444, 1999. [35] B. Verma, P. Gader and W. Chen.Fusion of Multiple Handwritten
Word Recognition Techniques. Pattern Recognition Letters, Vol. 22, pp 991-998, 2001.
[36] A.J. Viterbi. Error Bounds for Convolutional Codes and an Asymptotically Optimal Decoding Algorithm.IEEE Transactions on Information Theory, IT-13, pp 260-269, 1967.
[37] E. Zois and V. Anastassopoulos. Decision Fusion for Writer Discrimination.Proceedings of the Thirteenth International Con-ference on Digital Signal Processing, 1997.