ACSBD Working Paper No. 6 Sustainable Investment: A Tool for Decision Makers
Sustainable Investment: A Tool for Decision Makers
ACSBD Working Paper No. 6
Nick Byrne & Julie Cotter
November 2012
ACSBD Working Paper No. 6 Sustainable Investment: A Tool for Decision Makers
National Library of Australia Cataloguing-in-Publication entry
Author: Byrne, Nick.
Title: Sustainable investment: a tool for decision makers / Nick Byrne & Julie Cotter.
ISBN: 978-0-9871398-5-6 (loose-leaf)
Series: ACSBD working paper: no. 6.
Subjects: Multiple criteria decision making. Decision making.
Investment. Sustainability.
Other Authors/Contributors:
Cotter, Julie.
Australian Centre for Sustainable Business and Development.
Dewey Number: 658.403
ISSN: 1839-0722 (Print) ACSBD Working Paper
ISSN: 1839-0714 (Online) ACSBD Working Paper
Australian Centre for Sustainable Business and Development University of Southern Queensland
PO Box 4196
Springfield Central, Queensland 4300, Australia Phone: (07) 3470 4451 Fax: (07) 3470 4199 Email: [email protected]
Website: http://www.usq.edu.au/acsbd
Copyright © Australian Centre for Sustainable Business and Development 2012
All rights reserved. Apart from fair dealing for the purposes of study, research, criticism or review as permitted under the Copyright Act, no part of this report may be
reproduced by any process without written permission from the publisher. Any enquiries should be directed to: [email protected]
Disclaimer
ACSBD Working Paper No. 6 Sustainable Investment: A Tool for Decision Makers 1
Sustainable Investment: A Tool for Decision Makers
Nick Byrne
Sustainable Ventures Group Pty Ltd Southport, Qld 4215
Australia
Email: [email protected]
and
Julie Cotter
Australian Centre for Sustainable Business and Development University of Southern Queensland
Toowoomba, Qld 4350 Australia
Email: [email protected]
Paper presented at the Twenty-second Asian-Pacific Conference on International Accounting Issues, 7-10 November 2010, Gold Coast, Australia.
ACSBD Working Paper No. 6 Sustainable Investment: A Tool for Decision Makers 2
Sustainable Investment: A Tool for Decision Makers
Abstract:
This paper presents the Multi Criteria Decision Making Analysis (MCDA) technique as a potential tool for the sustainable investment sector. MCDA is a tool that can be used to facilitate the incorporation of the sustainability performance indicators reported by companies adhering to the Global Reporting Initiative (GRI) Sustainability Reporting Guidelines into a sustainable investment decision making framework. The application of this tool to the sustainable investment setting is demonstrated using an illustrative example.
ACSBD Working Paper No. 6 Sustainable Investment: A Tool for Decision Makers 3
1. Introduction
The sustainability movement has seen a transformational change across many organisations that embrace its principles. The traditional decision making mentality, based almost solely on financial outcomes, has passed and we move now into a multidimensional decision making space. This space considers a range of environmental, social and governance (ESG) values in addition to financial considerations. Another important concept that has emerged is that of stakeholder engagement as an integral part of decision making. This move towards greater stakeholder engagement is in contrast to the attitude that the expert always knows best. In the context of the Global Compact (2000), sustainable development refers to economic, environmental and social sustainability and the interdependency of these three elements. Sustainable development is implemented through market mechanisms, of which sustainable investment is one example. Sustainable investors are not only guided by financial motives, but also by ecological, ethical and social principles (Vermeir and Corten, 2001). Sustainable investment has come a long way since its early “ethical” investment stage, when a negative screening approach was used to facilitate the exclusion of such business activities as tobacco, alcohol and defence.
The case for the inclusion of sustainability principles into investment decisions varies between commentators. However, proponents argue that the inclusion of sustainability principles into organisational and investment decisions have positive impacts on brand image, financial performance and organisational value (Kempf and Osthoff, 2007; Derwall et al., 2005; Hillman & Keim, 2001). The literature highlights the multidimensional nature of the decision making arena of sustainable investment. The academic literature tends to focus on the application of sustainability scoring to compare the performance of funds, indices or their constituents [Hillman & Keim, 2001; Schroder, 2003; Fowler & Hope, 2007; Gifford, 2004].
ACSBD Working Paper No. 6 Sustainable Investment: A Tool for Decision Makers 4 different organisations. For example, The Dow Jones Sustainability Index (DJSI) was devised through an idea of Sustainable Asset Management (SAM), a Zurich based fund management firm (Fowler & Hope, 2007; Knoepfel, 2001). To be considered in the DJSI, a company must be among the largest 2,500 companies in the Dow Jones Global Index (DJGI). SAM is responsible for administering the selection criteria into the DJSI. SAM research, along with feedback from third party consultants, NGOs, international bodies and academics is utilised to form the constituent components of the DJSI and their relative weightings. SAM compliments this process with a 'media and stakeholder' analysis, involving the review of internal and external company documents. SAM acknowledges that they do not see the need for a balance across the triple bottom line. As a consequence, economic performance indicators are given more emphasis through the index weightings than other indicators. Weightings within the DJSI are allocated as Economic (30.6%), Environment (9.2%), Social (20.4%) and Industry Criteria and Media/Stakeholder analysis (39.8%) (Fowler & Hope, 2007)
The sustainability scoring systems methodology has not removed entirely the need for subjective assessment from sustainable investment decision making. Two reasons for this is that expert analysis is required to assess risk and that there is an absence of avenues for external stakeholders to communicate their values about the different aspects of sustainability within the sustainability scoring system. These weaknesses in the sustainability scoring system can be articulated into at least three areas. First, Fowler and Hope (2007) claim that the SAM Methodology appears to meet the desirable traits of consistency, verifiability, logicality and replicability (Deutsche Bank, 2002), but the need for analyst interpretation means it is not entirely objective. Second, these authors point out that financial return is still weighted relatively strongly with respect to other sustainability performance indicators that has resulted in a bias amongst sustainability indices (author refers to DJSI), which emphasise larger organisations relative to their benchmark indices.
ACSBD Working Paper No. 6 Sustainable Investment: A Tool for Decision Makers 5 (AHP) was presented by Saaty (2008) as a “theory of measurement through pairwise comparisons and relies on the judgements of experts to derive priority scales”. Whilst this approach has merit it neglects to capture analytically the opinions and values of stakeholders and adopts a Socrates approach. That is, it focuses on expert opinion over popular opinion. When considering sustainability issues, especially social value, it would be difficult to imagine how expert opinion could appropriately capture the complexity of multiple stakeholder values.
The MCDA approach presented in this paper seeks to address some of the weaknesses identified above. Increasing the objectivity and transparency of the scoring will be achieved through the use of Global Reporting Initiative (GRI) sustainability performance indicators.1 These measures span a broad array of sustainability aspects and are
publically available for those companies choosing to report in accordance with the GRI Guidelines. Furthermore, shareholder values are incorporated into the investment decision making process by assigning weights to the various sustainability performance indicators through an investor survey process. This process allows shareholders to directly and objectively express their sustainability value preferences and trade-offs. Choosing among alternative investments in this multidimensional decision making space is a complex and difficult task. Finding a suitable way to incorporate information about a company’s ESG performance into investment decision making is not clear. This latter issue becomes more complex and difficult the greater the number of sustainability factors that are considered for each potential investee company and/or the greater the variation in investor preferences regarding sustainability factors.
ACSBD Working Paper No. 6 Sustainable Investment: A Tool for Decision Makers 6
2. The Global Reporting Initiative
Sustainable investment highlights the need for companies to manage and disclose their ESG performance in addition to their financial performance. This emerging reporting behaviour is commonly referred to as either Triple Bottom Line reporting or Sustainability Reporting. The GRI is a framework for this reporting. Its first Sustainability Reporting Guidelines were released in 2000 and were revised in 2002 and 20062. The GRI reporting framework encompasses both quantitative and
qualitative aspects that present the reader with information about an organisation’s ESG performance. Until now, there has been no quantitative and methodical process for comparing and assessing numerous organisations’ GRI reports.
The GRI was established as a framework for organisations to undertake sustainability reporting in a consistent manner and to increase corporate transparency. As business risks and opportunities increase, companies and shareholders require access to more comparable, credible and comprehensive data to make decisions (see Linstock Consultants and Imagination, 2004). The framework presents numerous performance indicators,
which can be adopted by various reporting organisations depending on their industries and behaviours.
The structure of the performance indicators within the GRI framework is as follows:
Indicator Protocols (Broad, eg. environmental, economic, society)
Performance Indicator Aspects (Broad but within protocols, eg. Market Presence, Biodiversity)
Performance Indicators (Measurable indicators, eg. Total environmental protection expenditures and investments by type)
ACSBD Working Paper No. 6 Sustainable Investment: A Tool for Decision Makers 7 be a lack of investor interest in the reports. This lack of interest could be attributed to difficulties related to incorporating performance indicators into an investment decision making framework. This leads to the scenario currently faced, where companies’ sustainability reports are published individually and viewed as a ‘tick box’ process, as opposed to the value adding process which it could be, through increased organisational value and the attraction of new investors. A potential method for using these performance indicators in sustainable investment decision making is presented in the next section.
3. Multi Criteria Decision Analysis
MCDA is a process that allows decision makers to “systematically structure and analyse complex decision problems with multiple, conflicting objectives” (Hyde, 2005). It has been widely used in the environmental engineering discipline and is well documented in that literature [Bell, Hobbs & Ellis, 2003; Greening & Bernow 2004; Linkov et al. 2006; Reichelt & Peldschus, 2005; to name a few]. It allows decision makers to analytically and objectively consider multiple conflicting objectives, and often incorporates the values of several stakeholders.
Alternative decision analysis models such as benefit-cost analysis (BCA) reduce problems to a single dimension objective function; whereas within the MCDA process, tradeoffs between criteria and stakeholders (depending on the problem) are the focus of the analysis. MCDA provides a method for ranking the alternatives based on how well they satisfy the criteria. MCDA has the potential to be applied in the sustainable investment sector, ranking GRI reporting companies based on GRI performance indicators and shareholder values and preferences.
The process presented by Hyde (2005) has been adopted and slightly modified for the development of the MCDA model to be utilised in this paper.3 The following process
ACSBD Working Paper No. 6 Sustainable Investment: A Tool for Decision Makers 8 a. Identification of the decision maker(s) (DMs), and stakeholders (anyone who
might be affected by the alternatives); b. Selecting the criteria;
c. Selecting an MCDA technique(s); d. Weighting the criteria;
e. Transforming the criteria performance values (PV’s) to commensurable units, if required;
f. Applying the selected MCDA technique(s) to obtain a ranking; g. Performing sensitivity analysis; and
h. Making the final decision.
4. Illustrative Example
To demonstrate a potential application of the MCDA technique in the sustainable investment sector, consider the scenario where a fund manager is required to select a portfolio of organisations in which to invest. As the sustainable investment fund manager is pooling many investors’ money together and investing into a portfolio of companies, she would like an approach for distributing funds across companies that allows the incorporation of investors’ sustainable investment preferences. We assume that the companies that are being considered for investment are those where GRI reports are available, since those that do not issue these reports are less likely to subscribe to sustainability objectives.
ACSBD Working Paper No. 6 Sustainable Investment: A Tool for Decision Makers 9 scenario have been assessed as suitable portfolio choices in regard to financial considerations prior to the MCDA process.
The MCDA technique is then applied to rank the companies being considered for investment. In our hypothetical example, the MCDA technique is applied to a portfolio of five GRI reporting organisations with similar performance indicators (A through E). Theoretical performance indicator values were assigned for five sustainability performance indicators and one financial performance indicator, expected return on investment (EROI). The Decision Maker (DM) in this case is assumed to be a sustainable investment fund manager who is seeking to invest across a broad range of companies – spreading the investment risk according to the sustainable investment preferences of her clients. Stakeholders are the investors or their representatives.
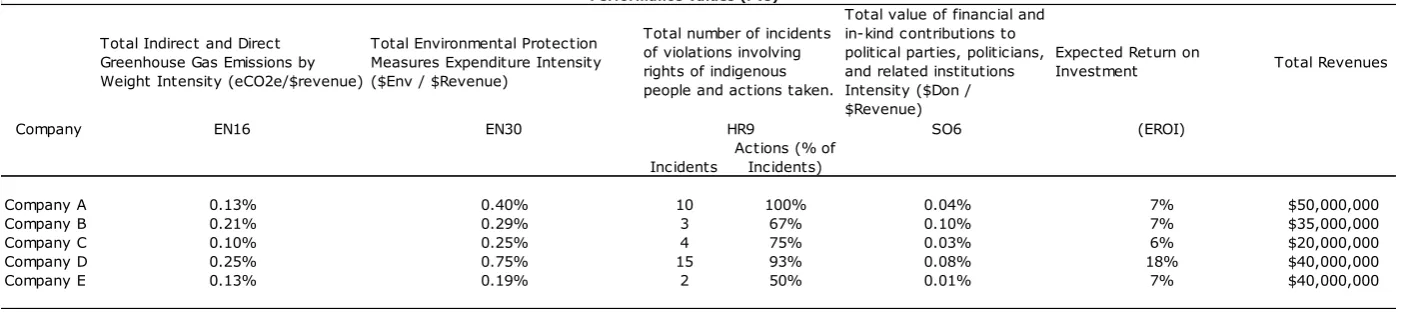
Table 1a presents the five hypothetical GRI reporting companies, and their theoretical performance indicator values. The sustainability performance indicators that have been chosen for this example capture greenhouse gas (GHG) emissions, overall environmental performance, indigenous rights, and contributions to political parties. The values for GHG emissions, environmental performance and contributions to political parties have been scaled by total revenues for the analysis. This was done to control for potential biases related to differences in firm size. The resulting intensity measures are shown in Table 1b.
Further, to prevent bias related to the use of diverse metrics within the MCDA calculation, performance indicators must be scaled to within a range of 0 and 1. Table 2 presents the scaled theoretical performance indicator values, a MCDA Score for each company, and its rank. The scaling is undertaken using the formulae 1a) or 1b) below, whichever is applicable to the particular performance indicator under consideration.
sij xij
max(xj) When a higher value is
preffered to a lower.
ACSBD Working Paper No. 6 Sustainable Investment: A Tool for Decision Makers 10
sij min(xj) xij
Where a lower value is preffered to a higher.
1b)
The MCDA scores and company ranks shown in Table 2 are based on the weighting across the six performance indicators shown in Table 3. An example illustrating how these weightings can be determined through a process of shareholder engagement is discussed below. There are several different MCDA techniques, however the most commonly used method, the weighted sum method is used for the purposes of this illustrative example. The weighted sum method is presented in equation 2. This method calculates an evaluation score for each alternative by multiplying each criterion performance value (xm,n) by its appropriate criteria weight (wm), followed by summing
the weighted scores for all criteria as follows:
Where
m is the criterion number M is the total number of criteria n is the alternative number
2)
The application of equation 2 is relatively simple. xm,n represents the scaled
performance value (see equation 1) of a particular indicator and wm is the shareholder
weighting given to that performance indicator. Once these two values are known, they are multiplied and summed with the next pair until all performance values are accounted for. The result is the MCDA score.
In this case, the scaled performance indicator values are the criterion performance values and the results of a shareholder survey are used to determine the criteria weights. It is likely that sustainable investors’ preferences are more heavily weighted towards some performance indicators than others. For example, consider an industry superannuation fund that offers its members an ESG option. Once per year the fund could invite members to complete an online survey to indicate preferences between
MCDA
score
(
w
m)(
x
m,n)
m1
M
ACSBD Working Paper No. 6 Sustainable Investment: A Tool for Decision Makers 11 various ESG and financial performance indicators. Those members choosing to complete the survey would have the ability to influence the selection of companies held on their behalf. This form of shareholder engagement allows the incorporation of shareholder preferences about ESG considerations into the investment decision making process.
The weightings shown in the final row of Table 3 are calculated on the basis of the results of a hypothetical survey of shareholders and/or their representatives. Assume that each investor was asked to distribute 20 points across each of the performance indicators. This information is then used to calculate the weights for the MCDA technique by summing each performance indicator’s total score and dividing by 200. Applying the MCDA process to each hypothetical company’s performance indicators reveals total MCDA scores. From this analysis, company A would be the preferred investment choice in a one company investment decision.4 However, the real benefit
from this technique would become apparent once hundreds of companies are involved in the MCDA scoring process. Sustainable investment fund managers may only want to invest across the top fifty performing companies, and the MCDA technique can be applied to reveal which companies these are.
There are a number of practical implementation issues related to the proposed approach that would need to be addressed by the fund manager. These include limiting the number of sustainability metrics to a manageable amount, the technical nature of some of the GRI performance indicators, the potential for survey fatigue, and the possibility for the views of a small number of shareholders to skew the weights away from the majority. While these implementation issues are not trivial, neither are the potential benefits of incorporating shareholder sustainability preferences into portfolio selection. We provide suggestions about how each of these could be addressed below.
ACSBD Working Paper No. 6 Sustainable Investment: A Tool for Decision Makers 12 sustainability metrics in the shareholder survey should be presented in a non-technical way to ensure that shareholders are capable of understanding them. It would also be the role of the fund manager to trade-off the potential for survey fatigue against the frequency of changes in shareholder knowledge and views. This could be achieved by limiting the survey to once per annum as in the ESG superannuation fund choice example outlined above. Further, shareholders could be given the option to register changes in their sustainability preferences during the year through a simplified online process. These changes could then be taken into consideration by the fund manager when rebalancing the portfolio throughout the year.
Sensitivity analysis can be undertaken as a final step in an attempt to better understand the uncertainty and potential biases within the outcome. By varying MCDA technique parameters by known percentages, the impacts on the outcomes can be observed and the certainty of the process confirmed or denied. It is possible that the survey responses of some shareholders could cause the weights to be skewed. Sensitivity analysis could be used to determine the impact of any such extreme responses. If necessary, extreme survey responses could be trimmed or winsorized to overcome any skewing of weights while still allowing shareholders’ investment preferences to be captured.
5. Conclusions
This paper has presented the Multi-Criteria Decision Analysis (MCDA) technique as a tool for the sustainable investment sector. This tool presents an opportunity for the GRI sustainability performance indicators or other suitable sources of sustainability data to be utilised as an aid to the selection of a portfolio of sustainable companies. This tool is suitable for use when the relative importance of various sustainability considerations varies amongst shareholders. That is, it allows the incorporation of shareholder engagement outcomes into the investment decision making process.
ACSBD Working Paper No. 6 Sustainable Investment: A Tool for Decision Makers 13 then this will further encourage and perpetuate the adoption of GRI reporting; thus increasing corporate transparency and ultimately global sustainability. Furthermore, there is a growing body of research supporting a positive correlation between the adoption of sustainability principles within organisations or across fund portfolios and financial return.
The use of MCDA appears to be particularly useful in the context of dedicated sustainable investment funds, where the selection of investments can be done in accordance with shareholder sustainability preferences. Potential applications include boutique investment funds catering to sustainable investors with a focus on particular sustainability aspects or superannuation funds with an ESG or ‘Eco’ fund option. MCDA is potentially also a useful tool for the development of sustainability indices that can be used by large sustainable investment funds and other institutional investors. We leave the exploration of this possibility to future research.
References
Bell, M. Hobbs, B. and Ellis, H. (2003) The use of multi-criteria decision-making methods in the integrated assessment of climate change: implications for IA practitioners, Socio-Economic Planning Sciences, 37(4), pp. 289–316.
Brown, H.S., de Jong, M. and Levy, D.L. (2008) Building institutions based on information disclosure: lessons from GRI’s sustainability reporting. Journal of Cleaner Production, 17, pp. 571-580.
Derwall, J., Guenster, N., Bauer, R. and Koedijk, K. (2005) The eco-efficiency premium puzzle, Financial Analysts Journal, 61(2), pp. 51-63.
Deutsche Bank AG (2002) Are SRI indices responsible?, Portfolio, Index and Futures Research, October.
ACSBD Working Paper No. 6 Sustainable Investment: A Tool for Decision Makers 14 Fowler, S.J. and Hope, C. (2007) A critical review of sustainable business indices and their impact, Journal of Business Ethics, 76, pp. 243–252.
Gifford, J. (2004) Measuring the social, environmental and ethical performance of pension funds, Journal of Australian Political Economy, 53, pp. 139-160.
GRI (2010) About GRI: Facts and Figures about GRI Reports, Available: http://www.globalreporting.org/AboutGRI/FactSheet.htm (Accessed: 2010, May 12)
Greening, L. and Bernow, S. (2004) Decision of coordinating energy and environmental policies: use of multi-criteria decision-making, Energy Policy, 32(6), pp. 721–735.
Hillman, A.J. and Keim, G.D. (2001) Shareholder value, stakeholder management, and social issues: what's the bottom line? Strategic Management Journal, 22(2), pp. 125–139. Hyde K.M. (2005) Uncertainty Analysis for Multi-Criteria Decision Analysis, PhD Thesis, School of Civil and Environmental Engineering, The University of Adelaide, Adelaide, Australia.
Kempf, A. and Osthoff, P. (2007) The effect of socially responsible investing on portfolio performance, European Financial Management, 13(5), pp. 908-922.
Knoepfel, I. (2001) Dow Jones Sustainability Group Index: A global benchmark for corporate sustainability, Corporate Environmental Strategy, 8(1), pp. 6–15.
Linkov, I., Varghese, A., Jamil, S., Seager, T.P., Kiker, G. and Bridges, T. (2006) Multi-Criteria Decision Analysis: A Framework for Structuring Remedial Decisions at
Contaminated Sites, Comparative Risk Assessment and Environmental Decision Making, Springer Netherlands
ACSBD Working Paper No. 6 Sustainable Investment: A Tool for Decision Makers 15 Morhardt, J.E., Baird, S. and Freeman, K. (2002) Scoring corporate environmental and sustainability reports using GRI 2000, ISO 14031 and other criteria, Corporate Social Responsibility and Environmental Management, 9, pp. 215–233.
Reichelt, B. and Peldschus, F. (2005) The Application of Multi-Criteria Decision Analysis (MCDA) in Risk Management of Civil and Environmental Engineering Projects, Poznan University of Technology, Poznan, Available:
http://www.ikb.poznan.pl/fcee/2005.06/full/fcee_2005-06_159-173_the_application_of_multi-criteria.pdf (Accessed: 2010, May 12)
Saaty, T. (2008) Decision making with the analytic hierarchy process, International Journal of Services Sciences, 1(1), pp. 83-98.
United Nations Environment Program Finance Initiative (2005) A legal framework for the integration of environmental, social and governance issues into institutional investment (The Freshfields Report), October.
United Nations Environment Program Finance Initiative (2009) Fiduciary
responsibility: Legal and practical aspects of integrating environmental, social and governance issues into institutional investment (Fiduciary II), July.
ACSBD Working Paper No. 6 Sustainable Investment: A Tool for Decision Makers 16
Endnotes
1. The model is not contingent on the use of GRI data. Alternative sources of sustainability data that meet the user’s needs could be used instead of GRI data.
2. The core guidelines are in their third generation “G3” and were released in October 2006 following a three year, innovative development period that engaged more than three thousand individuals from diverse sectors, worldwide.
3. When applied in the environmental engineering context, MCDA is generally only applied to a single project option at a time and then used to compare options using the MCDA score. For use in corporate decision making or the financial sector the method may take slightly different forms depending on the perception or type of the decision maker.
ACSBD Working Paper No. 6 Sustainable Investment: A Tool for Decision Makers 17
Tables
REPORTED PERFORMANCE VALUES
Total Indirect and Direct Greenhouse Gas Emissions by Weight (tonnes CO2e)
Total Environmental Protection Measures Expenditures by Investment and Type
Total value of financial and in-kind contributions to political parties, politicians, and related institutions by country.
Expected Return on
Investment Total Revenues
Company EN16 EN30 SO6
Incidents
Actions (% of Incidents)
Company A 65000 $200,000 10 100% $20,000 7% $50,000,000
Company B 75000 $100,000 3 67% $35,000 7% $35,000,000
Company C 20000 $50,000 4 75% $5,000 6% $20,000,000
Company D 100000 $300,000 15 93% $32,500 18% $40,000,000
[image:20.842.64.773.129.274.2]Company E 50000 $75,000 2 50% $2,500 7% $40,000,000
Table 1a: Reported Performance Values for potential investments
Performance Values (PVs)
Total number of incidents of violations involving rights of indigenous people and actions taken.
HR9
REPORTED PERFORMANCE VALUES AS INTENSITIES
Total Indirect and Direct Greenhouse Gas Emissions by Weight Intensity (eCO2e/$revenue)
Total Environmental Protection Measures Expenditure Intensity ($Env / $Revenue)
Total value of financial and in-kind contributions to political parties, politicians, and related institutions Intensity ($Don / $Revenue)
Expected Return on
Investment Total Revenues
Company EN16 EN30 SO6 (EROI)
Incidents
Actions (% of Incidents)
Company A 0.13% 0.40% 10 100% 0.04% 7% $50,000,000
Company B 0.21% 0.29% 3 67% 0.10% 7% $35,000,000
Company C 0.10% 0.25% 4 75% 0.03% 6% $20,000,000
Company D 0.25% 0.75% 15 93% 0.08% 18% $40,000,000
[image:20.842.73.783.327.483.2]Company E 0.13% 0.19% 2 50% 0.01% 7% $40,000,000
Table 1b: Reported Performance Values for potential investments
Total number of incidents of violations involving rights of indigenous people and actions taken.
HR9
ACSBD Working Paper No. 6 Sustainable Investment: A Tool for Decision Makers 18
STANDARDISED PERFORMANCE VALUES
Total Indirect and Direct Greenhouse Gas Emissions by Weight Intensity (eCO2e/$revenue)
Total Environmental Protection Measures Expenditure Intensity ($Env / $Revenue)
Total value of financial and in-kind contributions to political parties, politicians, and related institutions Intensity ($Don / $Revenue)
Expected Return on
Investment MCDA Score Rank
EN16 EN30 SO6 (EROI)
Incidents Actions
Weights 0.13 0.145 0.09 0.2 0.165 0.27
Company A 0.77 0.53 0.20 1.00 1.00 0.39 0.67 1
Company B 0.47 0.38 0.67 0.67 0.67 0.39 0.52 2
Company C 1.00 0.33 0.50 0.75 0.75 0.33 0.59 5
Company D 0.40 1.00 0.13 0.93 0.93 1.00 0.82 3
[image:21.842.73.778.108.252.2]Company E 0.80 0.25 1.00 0.50 0.50 0.36 0.51 4
Table 2: Reported Performance Values for potential investments - Scaled to remove bias between different peformance criteria Total number of incidents
of violations involving rights of indigenous people and actions taken.
HR9
SURVEY AND PERFORMANCE WEIGHT CALCULATIONS
Person ID EN16 EN30 SO6 EROI
1 4 4 1 4 4 3 20
2 1 2 2 4 5 6 20
3 3 3 2 4 3 5 20
4 3 3 2 4 3 5 20
5 2 4 1 4 4 5 20
6 2 3 2 4 3 6 20
7 3 2 2 4 3 6 20
8 3 3 2 4 2 6 20
9 2 2 2 4 3 7 20
10 3 3 2 4 3 5 20
26 29 18 40 33 54
0.13 0.145 0.09 0.2 0.165 0.27
Table 3: Stakeholder survey to determine weighting given to MCDA Performance Values
HR9
[image:21.842.70.826.299.434.2]