Official Statistics Release
Policy area: Maintained schools inspections and outcomes
Theme: Education, children’s services and skills
Published on: 9 September 2013
Coverage: England
Period covered: 1 April 2013 to 30 June 2013
Status: Provisional
Issued by:
Office for Standards in Education, Children’s Services and Skills (Ofsted)
125 Kingsway London
WC2B 6SE
Responsible director: Michael Cladingbowl
Statistician: Natalie Jakomis
Public enquiries: [email protected] Press enquiries: [email protected] Link to official statistics release
web page: www.ofsted.gov.uk/resources/20130012
Introduction
From 1 January 2012 inspections of maintained schools have taken place under a new framework, in accordance with section 5 and 8 of the Education Act 2005. The new framework reflects amendments made to this Act by the Education Act 2011.
This framework was revised on 1 September 2012 and under the revised framework:
schools cannot be judged as outstanding for overall effectiveness unless they have outstanding teaching
an acceptable standard of education is defined as a good standard of education
a school that is not yet good, but that is not judged inadequate, is a school that requires improvement
a school that is inadequate overall and that requires significant improvement, but where leadership and management are not inadequate, is a school with serious weaknesses
a school that is inadequate overall, and where leadership and management are also inadequate, is a school requiring special measures
Schools that were judged as outstanding at their last inspection remain exempt from section 5 inspection, unless there are concerns about their performance, as per the January 2012 school inspection framework. Good schools continue to be inspected within every five years.
The new judgement of requires improvement from September 2012 has replaced the satisfactory judgement that was in place under the January 2012 inspection framework. Schools that are judged as requires improvement will normally be monitored and re-inspected within a period of two years. Schools that were last inspected before September 2012, and judged to be satisfactory, are likely to be inspected by the end of the school year 2013/14. They may also receive a monitoring inspection.
A school that was last inspected before September 2012 and judged to be ‘inadequate’ and made subject to a notice to improve is treated, from September 2012, as a school that has been deemed to have serious weaknesses and will normally be inspected between 12 and 18 months of its last section 5 inspection. It may also receive a monitoring inspection.
This official statistics release reports on inspections and outcomes of maintained school inspections that occurred between 1 April 2013 and 30 June 2013. These statistics are based on provisional data and are subject to change as the inspection results for approximately 40 schools inspected in the quarter had not yet been published on 1 August 2013.
This release also includes the most recent inspection outcomes for all maintained schools that had been inspected at 30 June 2013. This provides a picture of the ‘state of the nation’s schools’ as indicated by inspection outcomes.
academies have been inspected by Ofsted subsequent to their conversion. For the purposes of these aggregated statistics, where an academy converter school has not been inspected, the inspection judgements of the predecessor school are included. However, it is important to recognise that the academy and the predecessor school are different legal entities.
Contents
Introduction ... 2
Key findings ... 5
State of the Nation ... 5
Inspection judgements for April to June 2013 ... 6
Impact of revisions on key points of previous release ... 7
Methodology ... 9
Chart 1: Overall effectiveness of maintained schools inspected between 1 September 2005 and 30 June 2013 (provisional) ... 12
Chart 2: Overall effectiveness of maintained schools inspected between 1 April 2013 and 30 June 2013, by phase (provisional) ... 13
Chart 3: Key inspections judgements for maintained schools inspected between 1 April 2013 and 30 June 2013 (provisional) ... 13
Chart 4: Most recent overall effectiveness of maintained schools inspected at 30 June 2013 (provisional) ... 14
Chart 5: Most recent overall effectiveness of maintained schools at 30 June 2013 compared to the most recent overall effectiveness at the end of the previous four academic years (provisional) ... 14
Table 2: Inspection outcomes of maintained schools inspected between 1 April 2013 and 30 June 2013 (provisional) ... 16
Table 3: Inspection outcomes for selected judgements of maintained schools inspected at their most recent inspection at 30 June 2013 (provisional) ... 17
Table 4: Number of maintained schools placed into, removed from and closed while in a category of concern between 1 April 2013 and 30 June 2013 (provisional) ... 18
Table 5: Most recent overall effectiveness for schools inspected at 30 June 2013 by region (provisional) ... 19
Key findings
1. Ofsted has inspected 98% (21,346) of all open schools in England.
2. Of the inspected open schools over three quarters (78%, 16,652) are currently judged to be good or outstanding.
3. There has been a nine percentage point increase since August 2012 in the percentage of schools judged at their most recent inspection to be good or outstanding. This means over 5.6 million pupils are receiving a good or outstanding standard of education, over 600,000 more than in August 2012.
4. The increase of nine percentage points in the proportion of schools judged to be good or outstanding at their most recent inspection represents a much more rapid improvement than that seen in previous years.
5. The East of England has improved the least since August 2012 (six percentage points) and now has the lowest percentage of schools judged as good or outstanding of all the regions (72%). The West Midlands showed the highest increase (11%) alongside the North East. 6. A third (7,179) of all open schools have been inspected under section 5 of the Education Act
2005 and their reports published since the introduction of the revised school inspection framework at the beginning of the academic year (September 2012).
7. In total, 7,226 section 5 inspections were conducted in the 2012/13 academic year to June 2013 and published by August 2013. Of these, 39% improved (2,789) since their last inspection, 41% remained the same (2,945) and 18% declined (1,314). In the 2011/12 academic year 32% of schools inspected improved.
8. During the latest quarter, the overall number of schools in a category of concern has decreased by 60.
9. The number of monitoring inspections (927) has increased by 16% compared to the previous quarter (798). This is largely due to an increase in the number of requires improvement monitoring inspections.
State of the Nation
In England there were 21,894 open schools on 30 June 2013, of these Ofsted has inspected 98% (21,346). Of the inspected open schools the majority (58%, 12,343) recently received an overall effectiveness judgement of good. A further 20% (4,309) are outstanding; meaning that over three quarters (78%, 16,652) of schools are currently judged to be good or outstanding.
There has been a nine percentage point increase in the proportion of schools judged as good or outstanding at their most recent inspection compared to August 2012 (70%, 14,976). This means that over 5.6 million pupils are receiving a good or outstanding standard of education, over 600,000 more than in August 2012.
Although a range of factors contributed to the increase in the proportion of good schools, the statistics suggest that schools have improved more quickly since the changes to inspection made in September 2012.
The earlier re-inspection of schools judged to be satisfactory at their previous inspection, and the less frequent inspection of schools judged to be outstanding at their previous inspection, means that some of the nine percentage point increase in the proportion of good and outstanding schools across the country reflects inspection selection practice. This is because more schools have improved at inspection than have declined.
During the autumn term, 66% of schools inspected had been judged satisfactory for overall effectiveness at their previous inspection. They were inspected because their next inspection was due. These schools are more likely to show improvement at inspection than good schools. In contrast, inspections during the summer term were predominantly of schools judged good or outstanding at their previous inspection and inspected because risk assessment suggests their performance has declined. They are therefore less likely to show improvement.
Regional variation in the most recent inspection outcome for all schools
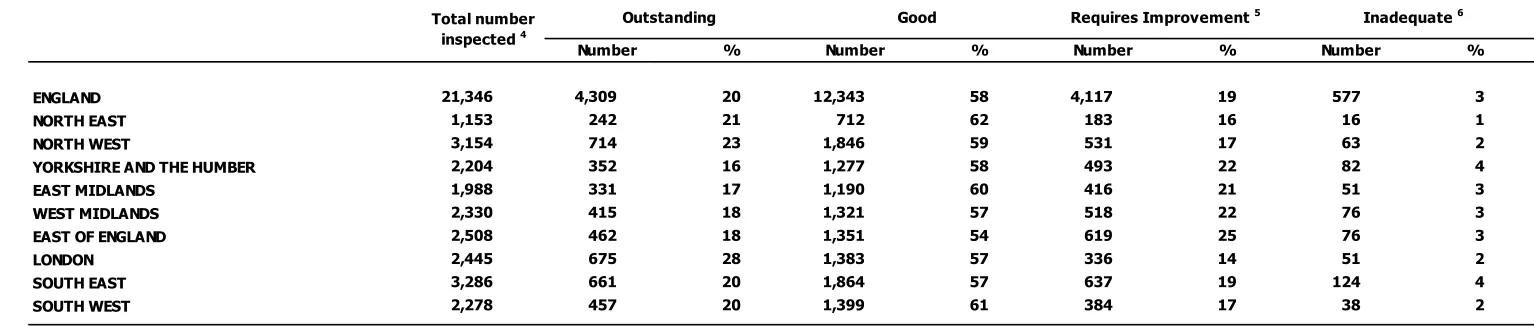
All English regions have seen an increase since September 2012 in the proportion of their schools judged good or outstanding for overall effectiveness at their most recent inspection. The increases varied between six and 11 percentage points. The lowest increase was in the East of England, this is now the region with the lowest percentage of schools judged as good or outstanding (72%). In August 2012 the lowest percentage of schools judged as good or outstanding was the West Midlands. The West Midlands showed the highest increase (11%) alongside the North East.
Inspection judgements for April to June 2013
Section 5 inspections
For these provisional statistics, Ofsted reports on 2,124 section 5 inspections between April and June 2013. This includes 1,542 inspections of primary schools, 448 inspections of secondary schools, 83 inspections of special schools, 27 inspections of pupil referral units and 24 inspections of nursery schools.
These inspections combined with those from earlier in the 2012/13 academic year mean that Ofsted inspected a third (7,179) of all open schools1 against the revised inspection framework
introduced in September 2012. Thirty-nine per cent (2,789) of these schools have improved their overall effectiveness judgement, 41% remained the same (2,945) and 18% declined (1,314). A further two per cent (178) had not previously been inspected.
Some 39% of schools inspected between April and June 2013 improved on their previous overall effectiveness judgement. This is a lower rate of improvement than for schools inspected between September 2012 and March 2013, when 48% of schools inspected improved. However it is still higher than in the previous academic year, 2011/12 when 32% of schools improved. This variation over time in the rate of improvement is consistent with the state of the nation changes, and the likely cause for the variation is explained above.
Schools causing concern
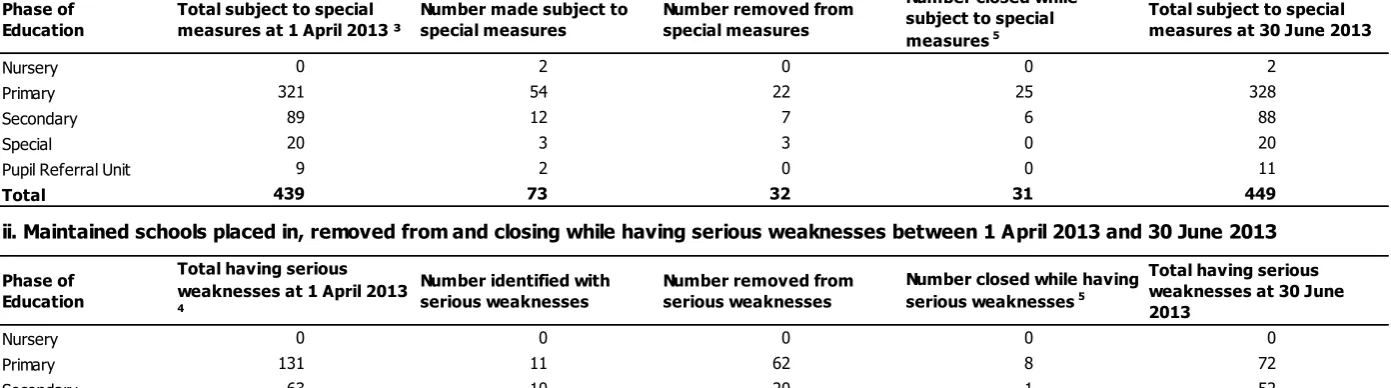
During the latest quarter, the total number of schools subject to special measures has increased by 10 schools to 449. However the number of schools subject to serious weaknesses has decreased by 70 schools to 128 in June 2013. Hence overall the number of schools in a category of concern has decreased by 60.
The number and percentage of schools judged to be inadequate or requires improvement is likely to increase in the revised version of these figures. Approximately 40 inspections took place in the period April 2013 to June 2013 but the reports were not published by August 2013. The majority of these are likely to be of inadequate schools because the process of moderation means inspections leading to this judgement take longer to publish. An equivalent change can be seen in the previous quarter’s results, as discussed below in the section on “Impact of revisions on key points of previous release”.
Section 8 inspections
Ofsted carried out 927 section 8 monitoring inspections between April and June 2013. The number of monitoring inspections has increased by 16% when compared to the previous quarter (798). This is largely due to an increase in the number of requires improvement monitoring inspections which formed 49% of section 8 inspections from January to March 2013 compared to 62% in the most recent quarter (April to June 2013). This illustrates that the new Ofsted Inspection Framework is being put into effect for those schools deemed to require improvement.
Impact of revisions on key points of previous release
Final data covering the period 1 January 2013 to 31 March 2013 have been released and can be found on the Ofsted website. This data contains the inspection outcomes of 40 section 5 inspections that took place during the period, which were published after 30 April 2013 and hence
1 Open schools data based Edubase at 11 July 2013. The number of open schools inspected under the amended
were not included in the provisional results published on 13 June 2013. Three of these inspections were of schools not previously inspected.
Thirty-two of these inspections resulted in an inadequate judgement for the school concerned; none of these schools had been judged inadequate at their previous inspection. Twenty-eight were judged to require special measures.
Methodology
1. Ofsted is required to inspect all schools subject to section 5 of the Education Act 2005 (see glossary). Ofsted selects schools for inspection on a proportionate basis, taking into account the schools most recent inspection outcome, through a system of risk assessment. Those schools that Ofsted judge would benefit most are selected for more frequent inspection. Therefore those inspected during the quarter may not be representative of all schools in England as a whole.
2. Data in this release are from inspections undertaken between 1 April 2013 and 30 June 2013 or most recent inspections of all open schools at 30 June 2013 under section 5 and 8 of the Education Act 2005 where the inspection report was published by 1 August 2013. Under exceptional circumstances Ofsted may withhold publication of an inspection report or withdraw a published inspection report; if an inspection report is withheld at the time the statistics are produced then it will also be excluded from the data reported on.
3. The impact of risk assessment on the sample of schools is that many fewer previously good schools are inspected than would be the case if a proportionate approach to inspection were not employed. Previously outstanding schools have had their inspections deferred and will not be re-inspected unless a complaint has been raised regarding the school or the risk assessment identifies these schools are at risk of declining performance.
4. Ofsted reports on various phases of education which include different types of establishment:
Nursery schools include local authority maintained nursery schools and miscellaneous nursery schools;
Primary schools include academy converter schools, sponsor academies, free schools and local authority maintained primary schools;
Secondary schools include academy converter schools, sponsor academies, free schools, studio schools, city technology colleges, university technical colleges and local authority maintained secondary schools;
Special schools include academy converter schools, sponsor academies and local authority maintained special schools. It also includes non-maintained special schools inspected under section 5 of the Education act 2005;
Pupil referral units include academy converter schools and local authority maintained pupil referral units.
5. The release contains key judgements and full details of published inspection outcomes which can be found in an underlying dataset in csv (comma separated value) and Microsoft Excel formats.
inspection framework and previous inspection frameworks and how Ofsted inspects maintained schools can be found on the Ofsted website at:
http://www.ofsted.gov.uk/resources/maintained-schools-inspection-documents-archive
7. Statistics relating to inspections undertaken in the most recent quarter are provisional and include inspections in the period where the inspection report was published within one month of the end of the quarter. When an inspection report is published later than one month after the end of the quarter in which the inspection took place, it is included in the final release of the statistics.
8. Ofsted undertakes moderation of all inspection reports where a school is judged to require special measures. The target time to complete the moderation process and publish the report is 28 working days. However, in some cases, this process may take longer. For schools judged as inadequate within a month of the end of the reporting quarter, they will be included in the final release for the quarter. Therefore, provisional statistics are likely to under-represent schools being placed in a category of concern.
9. Where the most recent inspection of a school took place during the reporting period, and the outcome has not been published, the school’s previous inspection outcome will be used to denote the school’s most recent inspection.
10.Revisions are published in line with Ofsted’s revisions policy for official statistics. For more information about the policy please visit the Ofsted website:
www.ofsted.gov.uk/resources/statistical-notice-ofsted-revisions-policy-for-official-statistics
11.Early years registered childcare provision is inspected under sections 49 and 50 of the Childcare Act 2006. Integrated inspection reports may also cover the requirements of the Children Act 1989 and the Care Standards Act 2000 for boarding provision. The inspection outcomes from these providers are included in this release. Where the provision is managed by the school, the inspection will not normally be carried out at the same time as the section 5 inspection. The quality of the childcare provision is evaluated and reported on in a
separate inspection report. Where registered provision on a school’s site is managed by a private, voluntary and/or independent provider, it is inspected separately under the
Childcare Act 2006. Where both inspections take place in the same timeframe the section 5 report and the childcare report will be published separately.
12.The welfare provision for boarding and residential special schools is inspected at the same time as the section 5 inspection, where possible. Inspections of this type are referred to as integrated inspections. The inspection of the residential/boarding provision has five principal judgements. The evaluation schedule for the inspection of boarding and residential provision in schools can be found at:
13.From 1 September 2012 inspection events and their outcomes for maintained schools are reported under a new framework in accordance with section 5 and 8 of the Education Act 2005 (as amended). Information regarding the current inspection framework can be found on the Ofsted website:
http://www.ofsted.gov.uk/resources/framework-for-school-inspection-september-2012-0
14.As a result of a proportionate inspection process, inspections of weaker schools take place more frequently. These weaker schools will no longer have the 2005 achievement
judgement: 'How well do learners achieve?' and will instead have the judgement:
‘Achievement of pupils at the school’ that came into effect in January 2012. 'How well do learners achieve?' judgement is therefore more positive.
15.The programme of grade 3 monitoring inspections (schools judged as satisfactory) came to a conclusion at the end of the academic year 2011/12. Therefore these monitoring
inspections will no longer appear in Table 1. All schools which were judged as satisfactory before September 2012 will be re-inspected under section 5 by the end of the academic year 2013/14. Schools judged as requires improvement may receive one or more requires
improvement monitoring inspections under section 8 and will be re-inspected under section 5 normally within 24 months from the last full inspection. In addition, notice to improve monitoring inspections have been replaced by serious weaknesses monitoring inspections. 16.The programme of academy monitoring inspections (of sponsor-led academies) was also
Charts and tables:
Aggregate data supporting the charts presented below is available in the excel format summary document “03_1309_Maintained_Summary_Jun13_(Provisional)” published as part of this release. The school level data for section 5 inspections in the quarter and the most recent inspection outcomes for all open schools as at 30 June 2013 is also available in excel and csv format
Chart 1: Overall effectiveness of maintained schools inspected between 1 September 2005 and 30 June 2013 (provisional) 1 2 3 4 5
11 14 15 19 13 11 12 10 48 47 49 50 43 46 49 54 34 34 32 28 37 38 31 30 8 6 5 4 8 6 8 6 2005/06 (6,128) 2006/07 (8,323) 2007/08 (7,867) 2008/09 (7,065) 2009/10 (6,171) 2010/11 (5,726) 2011/12 (6,139) 1 Sep 2012 to 30 June 2013 (7,226)
Overall effectiveness by academic year (percentage) 1 4
Outstanding Good Requires Improvement Inadequate
1. Percentages in the chart are rounded and may not add to 100.
2. These statistics exclude schools which were inspected during the quarter but where the inspection report had not been published by 1 August 2013 or where the report was withheld after publication.
3. Data based on Edubase at 1 August 2013.
4. The section 5 inspection framework was introduced on 1 September 2005. Subsequently amended frameworks have been introduced on 1 September 2009, 1 January 2012 and 1 September 2012.
Chart 2: Overall effectiveness of maintained schools inspected between 1 April 2013 and 30 June 2013, by phase (provisional)1 2 3
58 10 14 20 15 12 29 55 50 58 74 54 4 30 31 17 4 29 8 4 5 5 7 5 Nursery (24) Primary (1,542) Secondary (448)
Special (83)
Pupil referral unit (27)
All schools (2,124)
Overall effectiveness by phase of education (percentage)
Outstanding Good Required Improvement Inadequate
1. Percentages in the chart are rounded and may not add to 100. Where the number of inspections is small, percentages should be treated with
caution.
2. Based on Edubase at 1 August 2013.
3. These statistics exclude schools which were inspected during the quarter but where the inspection report had not been published by 1 August 2013 or where the report was withheld after publication.
Chart 3: Key inspections judgements for maintained schools inspected between 1 April 2013 and 30 June 2013 (provisional) 1 2 3
12 12 30 12 16 54 55 60 55 56 29 29 9 29 25 5 4 1 4 3
Overall Effectiveness (2,124)
Achievement of pupils (2,124)
Behaviour and safety of pupils (2,124)
Quality of teaching (2,124)
Leadership and management (2,124)
Key inspection judgements for inspected maintained schools (percentage) 1
Outstanding Good Required Improvement Inadequate
1. Percentages in the chart are rounded and may not add to 100. Where the number of inspections is small, percentages should be treated with caution. 2. Based on Edubase at 1 August 2013.
Chart 4: Most recent overall effectiveness of maintained schools inspected at 30 June 2013 (provisional)1 2 3 4
56 18 24 37 16 20 40 60 48 50 61 58 3 19 24 11 20 19 2 5 2 3 3 Nursery (418) Primary (16,431) Secondary (3,106) Special (1,018)
Pupil referral unit (373)
All schools (21,346)
Most recent overall effectiveness of schools inspected (percentage)
Outstanding Good Requires Improvement Inadequate
1. Percentages in the chart are rounded and may not add to 100. 2. Based on Edubase at 11 July 2013.
3. Data includes the most recent judgements for predecessor schools of academy converters that have not been inspected as an academy converter.
4. Prior to 1 September 2012 schools inspected in this category were judged as satisfactory. Since 1 September 2012 they are now judged as requires improvement.
Chart 5: Most recent overall effectiveness of maintained schools at 30 June 2013 compared to the most recent overall effectiveness at the end of the previous four academic years (provisional)1 2 3 4 5
16 18 20 21 20 50 50 50 49 58 32 30 28 28 19 2 3 2 3 3
at 31 Aug 2009 (22,171) at 31 Aug 2010 (22,008) at 31 Aug 2011 (21,845) at 31 Aug 2012 (21,548) at 30 Jun 2013 (21,346)
Most recent overall effectiveness of all schools 1
Outstanding Good Requires Improvement Inadequate
1. Percentages in the chart are rounded and may not add to 100.
2. Data from previous academic years based on Edubase at the end (or as close to) of each academic year. Data from this academic year based on Edubase at 11 July 2013.
3. Data includes the most recent judgements for predecessor schools of academy converters that have not been inspected as academy converters.
4. Prior to 1 September 2012 schools inspected in this category were judged as satisfactory. Since 1 September 2012 they are now judged as requires improvement.
Table 1: Number of maintained school inspections between 1 April 2013 and 30 June 2013, by inspection type (provisional)1 2 3 4 5
Number of schools
Inspection activity (section 5) All phases Nursery Primary Secondary Special Pupil referral unit
Section 5 inspection 2,090 24 1,520 440 80 26
Section 8 deemed section 5 inspection 34 0 22 8 3 1
Inspection activity (section 8) All phases Nursery Primary Secondary Special Pupil referral unit
Special measures monitoring inspection 278 0 203 57 12 6
Serious weaknesses monitoring inspection 47 0 25 21 1 0
Requires Improvement monitoring inspection 575 2 458 97 10 8
Section 8 No formal designation visit 27 0 14 10 3 0
Source: Ofsted inspections
1. Each phase of education includes different types of establishment; a more comprehensive list can be found in the Key Findings methodology section accompanying this release.
2. These statistics exclude approximately 40 schools which were inspected during the quarter but where the inspection report had not been published by 1 August 2013 or where the report was withheld after publication.
3. Data based on Edubase at 1 August 2013.
4. Grade 3 monitoring inspections, notice to improve monitoring inspections and academy monitoring inspections have been discontinued. Please refer to the 'Key findings' methodology section for more information.
[image:15.842.52.772.172.390.2]Table 2: Inspection outcomes of maintained schools inspected between 1 April 2013 and 30 June 2013 (provisional)1 2 3 45
1 April 2013 and 30 June 2013
Number % Number % Number % Number %
Overall Effectiveness 2,124 254 12 1,153 54 620 29 97 5
Achievement of pupils at the school 2,124 255 12 1,160 55 619 29 90 4
Behaviour and safety of pupils 2,124 639 30 1,266 60 200 9 19 1
Quality of teaching 2,124 258 12 1,167 55 614 29 85 4
Leadership and management 2,124 330 16 1,197 56 524 25 73 3
Overall effectiveness of the residential or boarding provision 6 1 17 2 33 1 17 2 33
Outcomes for residential or boarding pupils 6 2 33 2 33 2 33 0 0
The quality of residential or boarding provision and care 6 1 17 3 50 1 17 1 17
Residential and boarding pupil's safety 6 2 33 1 17 1 17 2 33
Leadership and management of the residential or boarding provision 6 1 17 2 33 1 17 2 33
Source: Ofsted inspections 1. Percentages are rounded and may not add to 100.
2. Each phase of education includes all types of establishment, for example LA maintained schools, academy converters and sponsor led academies.
3. These statistics exclude schools which were inspected during the quarter but where the inspection report had not been published by 1 August 2013 or where the report was withheld after publication. 4. Data based on Edubase at 1 August 2013.
Total number inspected 2 3
Inadequate Outstanding Good Requires Improvement
1. Percentages are rounded and may not add to 100.
2. Each phase of education includes all types of establishment, for example LA maintained schools, academy converters and sponsor led academies.
3. These statistics exclude schools which were inspected during the quarter but where the inspection report had not been published by 1 August 2013 or where the report was withheld after publication. 4. Data based on Edubase at 1 August 2013.
Table 3: Inspection outcomes for selected judgements of maintained schools inspected at their most recent inspection at 30 June 2013 (provisional)1 2 3 4
Outcome Number % Number % Number % Number % Number % Number %
Overall effectiveness 7 Outstanding 4,309 20 234 56 2,912 18 730 24 372 37 61 16
Good 12,343 58 168 40 9,938 60 1,500 48 509 50 228 61
Requires Improvement5 4,117 19 14 3 3,181 19 736 24 113 11 73 20
Inadequate6 577 3 2 0 400 2 140 5 24 2 11 3
Total 21,346 100 418 100 16,431 100 3,106 100 1,018 100 373 100
Outstanding 2,351 13 215 51 1,424 10 425 16 261 27 26 7
Good 11,386 62 187 45 8,942 64 1,420 52 578 60 259 71
Requires Improvement5 4,106 22 15 4 3,182 23 731 27 109 11 69 19
Inadequate6 557 3 1 0 386 3 139 5 20 2 11 3
Total 18,400 100 418 100 13,934 100 2,715 100 968 100 365 100
How well do learners achieve? 8 9 Outstanding 1,723 58 0 0 1,394 56 275 70 47 94 7 88
Good 1,218 41 0 0 1,102 44 114 29 2 4 0 0
Requires Improvement5 5 0 0 0 1 0 2 1 1 2 1 13
Inadequate6 0 0 0 0 0 0 0 0 0 0 0 0
Total 2,946 100 0 100 2,497 100 391 100 50 100 8 100
Aggregate achievement 7 8 Outstanding 4,074 19 215 51 2,818 17 700 23 308 30 33 9
Good 12,604 59 187 45 10,044 61 1,534 49 580 57 259 69
Requires Improvement5 4,111 19 15 4 3,183 19 733 24 110 11 70 19
Inadequate6 557 3 1 0 386 2 139 4 20 2 11 3
Total 21,346 100 418 100 16,431 100 3,106 100 1,018 100 373 100
Quality of teaching7 Outstanding 3,500 16 226 54 2,454 15 472 15 303 30 45 12
Good 13,240 62 176 42 10,463 64 1,772 57 580 57 249 67
Requires Improvement5 4,099 19 15 4 3,147 19 753 24 116 11 68 18
Inadequate6 507 2 1 0 367 2 109 4 19 2 11 3
Total 21,346 100 418 100 16,431 100 3,106 100 1,018 100 373 100
Behaviour and safety of pupils7 10 Outstanding 7,491 35 311 74 5,672 35 879 28 537 53 92 25
Good 12,189 57 101 24 9,687 59 1,773 57 406 40 222 60
Requires Improvement5 1,531 7 5 1 1,001 6 415 13 62 6 48 13
Inadequate6 124 1 1 0 62 0 37 1 13 1 11 3
Total 21,335 100 418 100 16,422 100 3,104 100 1,018 100 373 100
Outstanding 4,945 23 241 58 3,339 20 895 29 393 39 77 21
Good 12,487 58 162 39 10,015 61 1,578 51 508 50 224 60
Requires Improvement5 3,460 16 13 3 2,744 17 545 18 97 10 61 16
Inadequate6 454 2 2 0 333 2 88 3 20 2 11 3
Total 21,346 100 418 100 16,431 100 3,106 100 1,018 100 373 100
Source: Ofsted inspections Secondary
All phases Nursery Primary Special
Leadership and management7
Pupil referral unit
Achievement of pupils7 8
1. Percentages are rounded and may not add to 100. 2. Data based on Edubase at 11 July 2013.
3. Data includes the most recent judgements for predecessor schools of academy converters that have not yet been inspected as an academy converter.
4. These statistics exclude schools which were inspected during the quarter but where the inspection report had not been published by 1 August 2013 or where the report was withheld after publication. For these schools the previous inspection is included.
5. Prior to 1 September 2012 schools inspected in this category were judged as satisfactory. Since 1 September 2012 they are now judged as requires improvement.
6. Prior to 1 September 2012 schools inspected that were judged as inadequate included those which were given notice to improve or were subject to special measures. Since 1 September 2012 they are now judged as having serious weaknesses or are subject to special measures.
7. Inspections include pilot inspection outcomes occurring in the 2010/11 academic year.
8. Pupils' achievement and the extent to which they enjoy their learning judgement was introduced on 1 September 2009. Prior to this a different judgement, 'How well do learners achieve?', was made. While these judgements are not the same, they have been aggregated in the table to present the state of the nation.
9. As a result of a proportionate inspection process, inspections of weaker schools are brought forward. These weaker schools will no longer have the 2005 achievement judgement and will instead have the 2009 judgement: 'Pupils' achievement and the extent to which they enjoy their learning'. 'How well do learners achieve?' judgement is therefore more positive.
Table 4: Number of maintained schools placed into, removed from and closed while in a category of concern between 1 April 2013 and 30 June 2013 (provisional)1 2 3 4 5
i. Maintained schools placed in, removed from and closing while in special measures between 1 April 2013 and 30 June 2013
Phase of Education
Total subject to special measures at 1 April 2013 ³
Number made subject to special measures
Number removed from special measures
Number closed while subject to special
measures 5
Total subject to special measures at 30 June 2013
Nursery 0 2 0 0 2
Primary 321 54 22 25 328
Secondary 89 12 7 6 88
Special 20 3 3 0 20
Pupil Referral Unit 9 2 0 0 11
Total 439 73 32 31 449
ii. Maintained schools placed in, removed from and closing while having serious weaknesses between 1 April 2013 and 30 June 2013
Phase of Education
Total having serious weaknesses at 1 April 2013
4
Number identified with serious weaknesses
Number removed from serious weaknesses
Number closed while having
serious weaknesses 5
Total having serious weaknesses at 30 June 2013
Nursery 0 0 0 0 0
Primary 131 11 62 8 72
Secondary 63 10 20 1 52
Special 4 1 1 0 4
Pupil Referral Unit 0 0 0 0 0
Total 198 22 83 9 128
Source: Ofsted inspections
1. These statistics exclude schools which were inspected during the quarter but where the inspection report had not been published by 1 August 2013 or where the report was withheld after publication.
2. Six schools that previously had serious weaknesses were found to require special measures after re-inspection this quarter. No schools moved from special measures to serious weaknesses. 3. Schools subject to special measures are those that, when inspected, were failing to give their pupils an acceptable standard of education and in which the persons responsible for leading,
managing or governing the school were not demonstrating the capacity to secure the necessary improvement in the school.
Table 5: Most recent overall effectiveness for schools inspected at 30 June 2013 by region (provisional)1 2 3 4 5 6 7
Number % Number % Number % Number %
21,346 4,309 20 12,343 58 4,117 19 577 3
1,153 242 21 712 62 183 16 16 1
3,154 714 23 1,846 59 531 17 63 2
2,204 352 16 1,277 58 493 22 82 4
1,988 331 17 1,190 60 416 21 51 3
2,330 415 18 1,321 57 518 22 76 3
2,508 462 18 1,351 54 619 25 76 3
2,445 675 28 1,383 57 336 14 51 2
3,286 661 20 1,864 57 637 19 124 4
2,278 457 20 1,399 61 384 17 38 2
Source: Ofsted inspections SOUTH WEST
SOUTH EAST LONDON
EAST OF ENGLAND WEST MIDLANDS EAST MIDLANDS
YORKSHIRE AND THE HUMBER
Requires Improvement 5 Inadequate 6
NORTH WEST
Outstanding
NORTH EAST ENGLAND
Good Total number
inspected 4
1. Percentages are rounded and may not add to 100. 2. Data based on Edubase at 11 July 2013.
3. Data includes the most recent judgements for predecessor schools of academy converters that have not yet been inspected as an academy converter.
4. These statistics exclude schools which were inspected during the quarter but where the inspection report had not been published by 1 August 2013 or where the report was withheld after publication. For these schools the previous inspection is included.
5. Prior to 1 September 2012 schools inspected in this category were judged as satisfactory. Since 1 September 2012 they are now judged as requires improvement.
6. Prior to 1 September 2012 schools inspected that were judged as inadequate included those which were given notice to improve or were subject to special measures. Since 1 September 2012 they are now judged as having serious weaknesses or are subject to special measures.
20
Glossary
Section 5 Inspection
Under section 5 of the Education Act 2005 (as amended), Ofsted is required to inspect all schools to which section 5 applies. The frequency of school inspections depends on the findings of a school’s previous inspection(s). Further information on the frequency of inspections is available in ‘The framework for school inspections’:
http://www.ofsted.gov.uk/resources/framework-for-school-inspection The schools subject to section 5 inspection are:
community, foundation and voluntary schools
community and foundation special schools
pupil referral units
maintained nursery schools
academies2
city technology colleges
city technology colleges for the technology of the arts
certain non-maintained special schools approved by the Secretary of State under Section 342 of the Education Act 1996.
When conducting an inspection under section 5 Ofsted is required to report on the quality of the education provided in the school and must, in particular, cover:
theachievement of pupils at the school
thequality of teachingin the school
thebehaviour and safetyof pupils at the school
thequality of leadership in, and management of, the school.
In reporting, inspectors must also consider:
the spiritual, moral, social and cultural development of pupils at the school
the extent to which the education provided by the school meets the needs of the range of pupils at the school, and in particular the needs of disabled pupils3 and those who have special educational needs.
2 This includes the following academy family schools: sponsor-led academies, academy converter schools,
academy special schools, free schools, university technical colleges, and studio schools.
21
Categories of concern
Since September 2012 there are two categories of schools causing concern:
Serious weaknesses4 – where one or more of the key areas are ‘inadequate’
(grade 4), and/or there are serious weaknesses in the provision for pupils’ spiritual, moral, social and cultural development. However, leaders,
managers and governors are judged to be capable of securing improvement (this means that leadership and management are judged at grade 3 or above).
Special measures5 – where a school is failing to give its pupils an acceptable
standard of education, and, the leaders, managers or governors are not demonstrating the capacity to secure the necessary improvement in the school.
Interim assessment
The frequency of school inspections depends on the findings of a school’s previous inspection(s). Most schools judged to be good at their last inspection will be
inspected at five-year intervals. Regulations provide for certain types of outstanding schools to be exempt from routine inspection. However, Ofsted may decide to inspect outstanding schools if it has concerns about them. Both good and
outstanding schools are subject to a risk assessment process. For further information and guidance, please see:
http://www.ofsted.gov.uk/resources/risk-assessment-of-maintained-schools-and-academies
Schools judged as good at their last inspection are, initially, risk assessed as they approach the third year after the end of the academic year in which they were last inspected. If this risk assessment identifies that the performance of the school warrants an inspection, these schools are scheduled for inspection at some point during the third academic year after the end of the academic year in which they were last inspected.
For any schools not identified for inspection at that stage, a further risk assessment is undertaken in the third academic year after the end of the academic year in which the school was last inspected, when the latest performance data are available. If this analysis does not identify concerns, the school will receive, in the spring term, a letter explaining that the school will not be inspected within the next year unless
4 Under section 44(2) of the Education Act 2005 (as amended), a school judged to have serious
weaknesses requires significant improvement because it is performing significantly less well than it might in all the circumstances reasonably be expected to perform. Prior to September 2012 schools in this category were given notice to improve.
22
Ofsted receives information that indicates the need for inspection. Schools that do not receive such a letter will be inspected before the end of the academic year. For schools judged to be outstanding at their last inspection, the annual risk
assessment takes place in December and/or January, starting in the third year after the end of the academic year in which the school’s previous inspection took place, and then annually after that. Where a school has converted to academy status, the date of the risk assessment will depend on the date of the last inspection of the predecessor school.
If the annual risk assessment raises concerns about the performance of a school, it may be inspected at any time after the completion of the risk assessment. If no concerns are raised from the annual risk assessment, schools will not be informed.
Common terminology used by inspectors
Achievement the progress and success of a pupil in their learning and development taking account of their attainment.
Attainment the standard of the pupils’ work shown by test and examination results and in lessons.
Attendance the regular attendance of pupils at school and in lessons, taking into account the school’s efforts to encourage good attendance.
Behaviour how well pupils behave in lessons, with emphasis on their attitude to learning. Pupils’ punctuality to lessons and their conduct around the school. Capacity to improve the proven ability of the school to continue
improving based on its self-evaluation and what the school has accomplished so far and on the quality of its systems to maintain improvement. Leadership and management the contribution of all the staff with
responsibilities, not just the governors and head teacher, to identifying priorities, directing and motivating staff and running the school.
Learning how well pupils acquire knowledge, develop their understanding, learn and practise skills and are developing their competence as learners.
23
Progress the rate at which pupils are learning in lessons and over longer periods of time. It is often measured by comparing the pupils’ attainment at the end of a key stage with their attainment when they started.
Safety how safe pupils are in school, including in lessons; and their understanding of risks. Pupils’ freedom from bullying and harassment. How well the school promotes safety, for example e-learning.
© Crown copyright 2013
You may re-use this information (not including logos) free of charge in any format or medium, under the terms of the Open Government Licence. To view this licence, visit
http://www.nationalarchives.gov.uk/doc/open-government-licence/ or write to the Information Policy