Human Immunodeficiency Virus Antibody Avidity Testing to
identify recent infection among the newly diagnosed HIV-1
infected individuals and the effect of Antiretroviral Therapy on
the Avidity Antibodies – A pilot study
Dissertation submitted as part of fulfilment for the M.D.
(Branch-IV Microbiology) Degree examination of the Tamil
CERTIFICATE
This is to certify that the dissertation entitled, “Human Immunodeficiency Virus Antibody Avidity Testing to identify recent infection among the newly
diagnosed HIV-1 infected individuals and the effect of Antiretroviral Therapy on the Avidity Antibodies – A pilot study” is the bonafide work of Dr. Diviya Alex toward the M.D(Branch – IV Microbiology) Degree examination of the Tamil Nadu Dr. M. G. R. Medical University, to be conducted in April-2017.
Dr. Rajesh Kannangai Dr. V. Balaji
Guide Professor and Head
Professor and Head Department of Clinical Microbiology
Department of Clinical Virology Christian Medical College
Christian Medical College Vellore - 632004
Vellore – 632004
Principal
Christian Medical College
DECLARATION
I hereby declare that this M.D Dissertation entitled “Human Immunodeficiency Virus Antibody Avidity Testing to identify recent infection among the newly diagnosed HIV-1 infected individuals and the effect of Antiretroviral Therapy on the Avidity Antibodies – A pilot study” is the bonafide work done by me under the guidance of Dr. Rajesh Kannangai, Professor and Head, Department of Clinical Virology,Christian Medical College, Vellore. This work has not been submitted to any other university in part or full.
Dr. Diviya Alex
Department of Clinical Microbiology Christian Medical College
I thank the Lord Almighty for his wisdom, guidance and grace throughout my study and without whom all this would not have been possible.
I immensely thank my guide Dr. Rajesh Kannangai, Professor and Head of the Department of Clinical Virology, for his constant guidance, enormous patience and being the source of inspiration throughout my study period.
I thank my co guide Dr. John Fletcher G, Associate Professor of Department of Clinical Virology for his guidance and intellectual support during my study.
I am thankful to Dr. Balaji, Professor and Head of Department of Clinical Microbiology for his support and incitement.
I thank Dr. Priscilla Rupali and Dr. J V Punitha from the Departments of Infectious diseases and Medicine for their help from the clinical side.
I thank all the faculty from the Departments of Clinical microbiology, Clinical Virology and Parasitology for their valuable suggestions given for this study.
I am indebted toMr. Prasannafrom the Department of Clinical Virologyfor his tireless technical support throughout my study.I extend my gratitude toDr. Jaiprasath andassociate research officers Mr. John Paul Demosthenes andMrs.
the other way for helping me in times of need during my study.
A special thanks to all individuals who accepted to take part in the study.
I would like to acknowledge Mrs. Rekha for helping me with the statistical analysis. I thank Mr. Ben Chirag, technical officer Department of Clinical Virology for logistic support.
I thank the Institutional Review Board and Department of Clinical Virology for funding the study.
I am thankful to all my friends, juniors and seniors who were a constant help and support throughout my study.
My heartfelt gratitude to my loving parents and siblings for their sustained prayers, support and encouragement during my study.
S.No Content Page no.
1 Introduction 1
2 Hypothesis and objectives 6
3 Review of literature 7
4 Materials and methods 32
5 Results 49
6 Discussion 70
7 Summary and conclusion 84
8 Bibliography 87
1
1.
Introduction
Human Immunodeficiency Virus (HIV) is the causative agent of Acquired
Immunodeficiency Syndrome (AIDS) and was first isolated in 1983. It caused severe
deterioration of the immune system. These are transforming viruses belonging to the
family Retroviridae and genus lentivirus. Human immunodeficiency virus is of two
types – HIV-1 and HIV-2. Simian Immunodeficiency virus (SIV) is thought to have
crossed species barrier from chimpanzees and sooty mangabeys to human beings
resulting in HIV-1 and HIV-2 respectively. The sequence homology between HIV-1
and HIV-2 is about 40-60%(1).
HIV is a major health issue worldwide. According to WHO, 36.7 million people are
living with HIV worldwide. In 2015, 1.1 million people have died from HIV related
causes worldwide(2). Among the people living with HIV about 0.8% are adults
belonging to age group 15-49 years (3). The newly infected individuals with HIV were
about 2.1 million globally. Sub-Saharan Africa ranked first with 25.6 million people
living with HIV that is 70% of the global burden. Two thirds of the total new HIV
infections in the world are in Sub-Saharan Africa (2). People living with HIV in Asia
and the Pacific accounted for 5.1 million. There is an estimate of 300,000 new HIV
infections in this region(4). In Southeast Asia, the prevalence of HIV infections in adults
was 0.26% (3). New HIV infections have decreased by 35%. Death due to AIDS related
causes have decreased by 28% between 2000 and 2015(2). Towards end of 2015, 17
million people living with HIV were receiving antiretroviral therapy (ART)
2 India ranks third in the world with people living with HIV after South Africa and
Nigeria(5). As per India HIV Estimation 2015 report, HIV adult (15-49 years)
prevalence in India is 0.26%. Because of India’s large population this equated to around
2.1 million people living with HIV in 2015. Among the states and union territories,
Manipur had the highest adult HIV prevalence of 1.15%, Mizoram (0.80%) second in
line and followed by Nagaland (0.78%), Andhra Pradesh & Telangana, Karnataka, and
Gujarat (6,7). Andhra Pradesh &Telangana have the highest estimated number (0.3
million) of HIV infected individuals followed by Maharashtra, Karnataka, Gujarat,
Bihar and Uttar Pradesh. These states account for two thirds (64.4%) of total estimated
people living with HIV. According to HIV Sentinel Surveillance 2014-15, the
prevalence of HIV in ANC clinic attendees continues to be low at 0.29%. The highest
prevalence was seen in Nagaland (1.29%) followed by Manipur, Gujarat and
Chhattisgarh(8).
According to the National Integrated Behavioural and Biological Surveillance (IBBS)
2014-2015 report, among the high risk groups – Intravenous drug abusers had the
highest HIV prevalence of 9.9% followed by MSM 4.3% and Female Sex Workers
2.2% (9).
The various modes of transmission of HIV is sexual, parenteral by exposure to infected
body fluids and from mother to child(2). HIV-1 targets a subset of T lymphocytes
known as the CD4+T helper cells which serves as receptor for the virus. Entry of the
virus into the T helper cells is followed by rapid and persistent replication. This results
in dysfunction and depletion of CD4+T cell by various direct and indirect mechanisms.
3 individual is infected the body starts producing antibodies against HIV-1. It is estimated
that 50-70% of HIV infected individuals experience an acute syndrome approximately
at 3-6 weeks of infection. Clinical latency is the period during which HIV infected
individuals do not have any clinical symptoms. Clinical latency is defined as the time
period from initial infection to the development of clinical disease and differs in
different individuals. The median time for untreated HIV infected individual is 10 years.
If an HIV infected individual has high levels of HIV RNA in plasma, they develop
symptomatic disease faster than those individuals with low levels of HIV RNA. Thus
comes the importance of an early detection(11).
HIV incidence is known as the rate at which a population acquires HIV infection and it
can be used to measure the extent of current HIV transmission in the community(12).
It is important for partner notification, to establish the incubation period,
epidemiological surveillance. One of the methods of estimating the incidence is using
laboratory tests for recent infection. Laboratory based are recommended to estimate
HIV-1 incidence in cross sectional studies(13). This method provides direct measure of
incidence and does not require repeated testing(14). Laboratory methods avoids the
limitations of prospective studies such as bias, high cost and logistics.
Recent infection is the state that starts when an individual is infected with HIV for the
first time and biological process of HIV infection is initiated. The duration of recent
infection is usually defined as 6 months after initiation of the infection for first time.
Test for Recent HIV Infection (TRI) is defined as a laboratory test used to classify HIV
infection as long term or recent HIV infection. Many different assays have been
4 for identifying recent HIV infections while others are commercial assays used for HIV
diagnosis which have been modified to identify recent infection. Avidity testing is based
on fact that evolution and maturation of specific antibodies to HIV-1 occur within first
two years of seroconversion. Avidity is defined as the strength of antigen-antibody
binding when several epitopes on an antigen interact with several binding sites of an
antibody and is known as the binding capacity of a maturing antibody to an antigen.
The avidity of an antibody increases over time(15). The HIV-1 limiting antigen avidity
enzyme immunoassay (LAg-Avidity EIA) is a quantitative avidity assay for
differentiating recent HIV-1 infections from long-term HIV-1 infection. Individuals
with recent HIV-1 infections have HIV-1 IgG with lower avidity compared to
antibodies in HIV-1 infected individuals with long-term infections(16). This assay is
based on the observation that when an individual is exposed to HIV-1 virus, the immune
system initially produces HIV-1 antibodies with low avidity, and with progression of
time, the immune system matures and produces HIV-1 antibodies with high avidity.
More the amount of IgG antibodies with high avidity, the infection is more long term.
The limiting antigen avidity assay is based on the principle that at high concentrations
of antigen, antibodies with low avidity and antibodies with high avidity both can bind
and because of the high density of antigen, the binding can occur with both binding sites
of the antibodies. When the concentration of the antigen coated is lowered it permits
the binding of only high avidity antibodies. Moreover, limiting the concentration of
antigen prevents the binding with two sites simultaneously, so that the antibodies with
low avidity will not be able to bind strongly to antigen. So based on this method we
5 maturation and production of humoral immune response when HIV-1 infected
individuals are treated early with antiretroviral therapy (ART)(17). When there is viral
breakthrough that is the viral load is above 1000/ml in individuals who were on ART,
the immune system reacts by increasing the proportion of HIV-1 specific antibody
which may show changes in some of the tests for recent infection(18).
The main aim of this study was to determine the frequency of recent HIV-1 infections
among the volunteers who attended the Integrated Counselling and Training Centre
(ICTC) of a tertiary care centre by quantitative detection of matured HIV-1 IgG
antibody levels using Limiting Antigen Avidity Enzyme Immunoassay (LAg Avidity
EIA). We planned to compare the results obtained in LAg avidity assay with an
in-house avidity assay and with the antibody pattern obtained in Western Blot. Also to
study the avidity maturation of HIV-1 immunoglobulin among HIV-1 infected
6
2.
Hypothesis and Objectives
Hypothesis
The Limiting antigen avidity assay is a useful technique to determine the quantity of
matured immunoglobulin (IgG) to identify recent HIV-1 infection and ART leads to an
impaired production and maturation of IgG in HIV-1 infected individuals.
Objectives
1. To determine the frequency of recent HIV-1 infections among the volunteers
who attended the ICTC of CMC hospital by quantitative detection of matured
HIV-1 IgG antibody levels using LAg avidity assay.
2. To compare the performance of LAg avidity assay with an in-house avidity
HIV-1 antibody assay
3. To compare the normalized OD results obtained in the LAg avidity assay
with HIV Western Blot antibody pattern to different antigens
4. To study the impact of antiretroviral therapy on avidity maturation of HIV-1
7
3.
Literature Review
3.1. History
Acquired immunodeficiency syndrome was recognized in US in 1981 when there were
reports of pneumonia associated with rare organism like pneumocystis jirovecii among
previously healthy homosexual men in United States. The term "acquired
immunodeficiency syndrome," or AIDS was used first by public health officials in
1982. In 1983, Dr. Luc Montagnier in Pasteur Institute, Paris isolated the virus from an
patient with generalized lymphadenopathy and named it as
lymphadenopathy-associated virus (LAV)(19,20). Around the same time, Dr. Robert Gallo with his
scientists in National Institute of health (NIH), Maryland isolated and named the virus
as HTLV-III (human T-cell lymphotropic virus-type III), because it shared some
features with HTLV I and HTLV II(21,22). Scientists under Dr. Jay Levy in University
of California isolated the virus in 1984 and named it as AIDS associated Retroviruses
(ARV)(23). In 1985, the name was changed to HIV (human immunodeficiency
virus)(24). In 1986, the first case of AIDS in India was detected among commercial sex
workers in Tamil Nadu(25).
3.2.HIV
3.2.1.Structure
Human Immunodeficiency Virus belongs to the family Retroviridae and genus
lentivirus. The mature HIV particle is spherical and measures around 100nm. It has an
outer host-derived lipid envelope. The major envelope proteins are glycoproteins gp120
8 cylindrical or conical inner core containing two identical copies of single stranded
positive sense linear RNA. The core also contains enzymes that are required for
functioning and replication of the virus – integrase, protease and reverse
transcriptase(11,26,27).
3.2.2. Genome
The length of HIV-1 is 9.7kb. It has three structural genes that encode the structural
proteins and six non-structural genes that encode various proteins that are involved in
viral replication. The three main structural genes are the gag, pol and env genes. The
gag gene encodes the core and matrix proteins – p24, p17, p6, p7. The pol gene encodes
the enzymes – protease (p10), reverse transcriptase (p66/51) and integrase (p32). The
env gene encodes the outer (gp120) and transmembrane (gp41) envelope proteins. The
gag-pol-env genes are flanked by long terminal repeats which contain transcriptional
regulatory proteins for gene expression. The non-structural genes are further divided
into regulatory genes (tat, rev and nef) that encodes the regulatory proteins –
transcriptional activator (p14), regulator protein (p19) and negative regulator protein
(p27) respectively and the accessory genes (vif, vpr and vpu) that encodes the accessory
proteins – viral infectivity factor (p23), viral protein R (p18) and viral protein U
(p15-16) (11,27).
3.2.3. Molecular epidemiology
The phylogenetic clustering of HIV-1 viral isolates globally into clades or subtypes is
based on 20-50% differences in envelope nucleotide sequences(28). They are classified
9 (Outlier)(29). The env proteins of group M and O show as much as 30-50% variation.
Group N is phylogenetically equidistant from group M and O(29). Group M has 9 different genetic subtypes A-D, F-H, J and K with E and I being circulating
recombinants forms (CRFs)(28,30,31). The groups N and O are less frequent in human
infections(32). Currently, 99.6% of all human infections globally is caused by group M
of HIV-1 (32). The subtype C strains is prevalent in Africa, Latin America and
Asia(28,31). India has a high prevalence of HIV-1 subtype C. The prevalence of subtype
C varied in different parts of the country. In North India 78.4% and western India 96%
of HIV-1 strains were subtype C(33,34). HIV-2 subtypes recognized in the world were
A-H(35–37). When compared to HIV-1, HIV-2 strains were predominant in Africa. The
HIV-2 strains identified in India till date are subtype A(38). The subtype A strain is the
predominant in West African countries. Subtype A is estimated to cause 0.11% of all
HIV infections in humans(32).
3.3. Transmission
HIV-1 is predominantly transmitted through sexual contact (both heterosexual and
homosexual), by blood and blood products and from mother to child – intrapartum,
perinatal and through breast milk. Transmission largely depends upon the viral load and
the duration of exposure to that particular body fluid(10).
The common route of HIV transmission worldwide is through sexual contact and
accounts for 80% of adult HIV infection. Increased risk of HIV transmission is seen in
homosexuals and individuals with multiple sexual partners. The risk of HIV spread is
increased by 300 times when there is concomitant sexually transmitted infections (STI)
10 The probability of acquiring HIV from infected blood is about 90%(11). Transmission
of HIV through blood has reduced to a large extent after intense screening in transfusion
and transplant settings by HIV antibody testing and molecular detection. Intravenous
drug users acquire HIV infection through this route. The prevalence of HIV infection
in our country is 9.9% in intravenous drug users(6). The relative proportions of mother
to child transmission of HIV are 23-30% before delivery, 50-60% during delivery and
12-20% during breast feeding(11).
In India, the HIV epidemic is concentrated in two groups of people through whom it is
transmitted to healthy population – one group the high risk which includes male and
female sex workers, transgender and intravenous drug abusers. The second group is
bridge population which comprises a group of people who bridge the high risk groups
with general population, mostly they are clients or partners of male and female sex
workers include long distance truck drivers and migrants(39).
3.4. Replication
The primary targets of the HIV virus are the immune cells namely CD4+ T lymphocytes
and macrophages. Replication starts with the attachment of the gp120 protein of virus
to the CD4 receptors and co-receptors present on the surface of target cells which results
in conformational changes in gp120. The chemokine receptors, CCR5 and CXCR4
serves as the co-receptors for the macrophage trophic and non- macrophage trophic
strains respectively. This results in exposure of the transmembrane envelope
glycoprotein gp41 leading to fusion of the virion and target cells(40). Following fusion,
matrix and capsid proteins in the virus are digested and releases viral RNA and enzymes
11 by endocytosis. The HIV enzyme reverse transcriptase uses the host nucleotides and
converts the viral RNA into single-stranded DNA. During reverse transcription, random
errors are made commonly due to the poor proofreading by reverse transcriptase. The
double stranded DNA is synthesized from single stranded DNA by reverse
transcriptase. The enzyme integrase integrates the double stranded DNA into the host
DNA. Thus the virus replicates along with the DNA of the host cell. Following this,
transcription occurs to produce viral mRNA which is translated into viral proteins in
the cytoplasm. The final steps of HIV replication include assembly of the immature
virion to the cell surface which leaves the host cell by budding. The mature virion that
is released affects other immune cells thus continuing the process of replication(27,40).
3.5. Pathogenesis
The indicator of HIV disease is severe immunodeficiency due to progressive qualitative
and quantitative deficiency of helper T cells by direct and indirect mechanisms(11).
When the virus enters the body, there is massive multiplication of the virus in the target
immune cells which results in CD4+ cell damage. Regardless of the host’s active
immune response, the virus escapes the immunological clearance and releases the virion
from the destructed cells which are concealed within the regional lymph nodes, this
results in viremia. This occurs usually within 2-6 weeks when a threshold of replication
is reached(41). Primary viremia sets in, which is characterized by non-specific
symptoms that resembles any viral infection such as fever, fatigue, lymphadenopathy,
rash, sore throat, weight loss and muscle pain. Once the infection is established, it
persists lifelong(42,43). During the primary viremia phase, there is high plasma viral
12 there is profound immune activation by the T cells which results in release of various
proinflammatory cytokines like TNF-α and interleukins. This state along with the direct
viral effects leads to dramatic depletion, impaired production and dysfunction of the
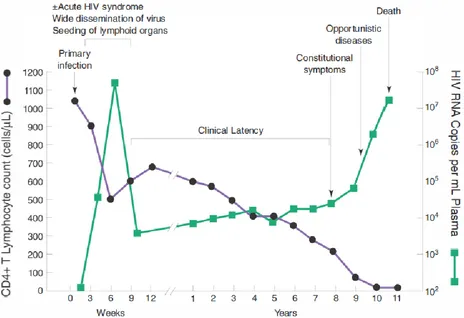
CD4 helper cells(44). The period and the duration of clinical latency after the primary
infection depends upon the individual’s immune system. Once the CD4 count falls
below 200 cells/μL, the infected individual is prone to get more opportunistic infections
and progress to an advanced stage of HIV known as AIDS(41). The relationship
between CD4 T lymphocyte count and viral load in an untreated HIV infected individual
[image:19.595.74.538.350.668.2]is depicted in Fig 1.
Figure 1: Graph depicting relationship between CD4 T lymphocyte count and viral load
in an untreated HIV infected individual. Adapted from Harrison’s Principles of Internal
13 3.6. Immune Response
After primary viremia, the HIV infected individuals normally mount a good immune
response that usually curtails the level of viremia and may delay the development of the
disease for 10 years. The immune response of the body to HIV infection includes
humoral and cell mediated immunity. The immune response is against antigenic
determinants of virion and also against viral proteins which is usually expressed on the
surface of infected cells(11).
3.6.1.Humoral immunity
HIV specific antibodies appear normally within 3-6 weeks of primary infection and
without fail within 12 weeks; exceptions include inability to produce HIV specific
antibodies in certain individuals(11). The detection of these HIV specific antibodies is
the foundation of most of the screening tests used for detection of HIV infection.
The antibodies detected by ELISA and Western Blot are HIV binding antibodies and
appear prior to the appearance of HIV neutralizing antibodies.
The neutralizing antibodies usually appear after the initial decrease in plasma viral load
and are more closely associated with the arrival of HIV -specific CD8+ T
lymphocytes(11). The first antibodies which appear are against the immunodominant
region of the envelope protein gp41. This is followed by antibodies to gag protein p24
and the gag precursor p55(11). The antibodies to gp120 (envelope), p17 (gag) and p31
and p66 (pol protein) appear after antibodies to p24. Envelope proteins gp120 and gp41
are the only proteins which can elicit neutralizing antibodies. These neutralizing
14 of HIV. The first neutralizing antibodies are against autologous infecting virus and
usually appear after 12 weeks of infection. The virus is able escape the neutralizing
antibodies because of the high rate of mutation. One important mechanism of immune
escape is formation of glycan shield by linking of the glycosylation sites which
interferes with envelope recognition(11).
There are 5 main sites in the HIV envelope that elicits the production of neutralizing
antibodies(11). They are
i. CD4 binding site of gp120
ii. Glycan dependent epitopes in V1/V2 region of gp120
iii. Near the base of V3 region of gp120
iv. gp120/gp41 bridge
v. Membrane proximal region of gp41
Some protective antibodies engage in antibody dependent cellular cytotoxicity (ADCC)
where natural killer cells have Fc receptors and Fc portion of anti HIV antibodies bind
to these Fc receptors. These armed natural killer cells bind to the cells which express
HIV antigens and destroys them. The antibodies against the envelope proteins which
participate in ADCC are highest early in infection(11).
Avidity is the functional affinity and is the overall strength of the bonds between antibodies and their corresponding antigens. In HIV-1 infection, avidity increases over
time following seroconversion. Maturation in antibodies against gp41 reflects the time
since seroconversion and remains high in individuals with long term infection and in
15 the avidity of antibodies against p24 falls. The avidity of antibodies against gp41 is of
value in identifying cases of recent HIV infection but not the avidity of antibodies
against p24 or p17 (45). In early stages of primary immune response usually low avidity
antibodies are produced. The hyper mutation in V region and the preferential selection
of the high affinity B cells by antigen leads to the increase in the overall avidity over
period of months. As this response matures usually when maximum antibody titers have
been reached. The maturation of the antibody response is useful in serodiagnosis of viral
infections for the timing of infection. Antibody maturation occurs in the presence of
active viral replication(46). Using paired sera from cases of primary infection with a
known date of onset of illness or seroconversion, an avidity maturation time course has
been determined. Such avidity studies are now used in risk assessment in cases of
rubella during pregnancy where it can confirm recent infections in the face of equivocal
IgM results and for some time after maximum IgG antibody titers have been
reached(45,47–49).
3.6.2. Cellular Immunity
T cell immunity can be mediated by inducer CD4+ T helper cells and immunoregulatory
CD 8+ killer T cells. CD4+ T helper cells specific for HIV can be detected using flow
cytometry to measure intracellular cytokine production or through lymphocyte
proliferation assay using HIV antigen p24. These cells help HIV specific B cells and
CD 8+ T cytotoxic cells in mounting an immune response. CD 4+ T cells may also
directly kill HIV infected cells. During generation of an immune response to HIV, the
16 presenting cells. When there is high viral load, CD4+ T cells responds to HIV antigens
by shifting from proliferation and IL-2 production to IFN-γ production(11).
HIV specific CD8+ T cells which are MHC class 1 restricted have been detected in the
peripheral blood samples of HIV-1 infected individuals. These cells include cytotoxic
T cells that produce perforins and T cells which can express an array of cytokines such
as IFN-γ, IL-2, MIP- 1β and TNF α. Cytotoxic T lymphocytes (CTL) have been
detected within weeks of HIV infection and before the appearance of virus in blood.
They exert a selective pressure on the evolution of the population of circulating viruses.
CD8+ T lymphocytes through their HIV specific antigen receptor bind to the target cells
and results in the lytic destruction of target cells having autologous MHC class 1
molecules presenting HIV antigens. Two types of cytotoxic T lymphocyte activity are
seen in HIV infected individuals. The first type is known as spontaneous CTL activity
where the cytotoxic T lymphocytes directly lyses appropriate target cells in culture
without prior in vitro stimulation. The second type of CTL activity indicates the
precursor frequency of CTLs (CTLp); this CTL activity can be demonstrated by
stimulation of CD8+ T cells in vitro using a mitogen such as phytohemagglutinin or
anti-CD3 antibody(11).
The ability of CD8+ T lymphocytes from an HIV infected individual to inhibit the
replication of HIV in tissue culture without killing infected targets is known as non
17 3.7. Classification of HIV infection
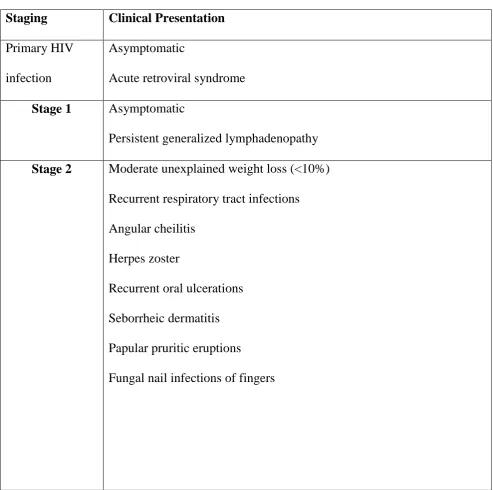
Two major systems of classification are used widely for HIV infection. The WHO
classification system has clinical staging and is used widely in low resource setting
where CD4 counts may not be available. The CDC staging system combines both CD4
[image:24.595.72.566.253.743.2]counts and clinical staging together(51).
Table 1: WHO classification of HIV
Staging Clinical Presentation Primary HIV
infection
Asymptomatic
Acute retroviral syndrome
Stage 1 Asymptomatic
Persistent generalized lymphadenopathy
Stage 2 Moderate unexplained weight loss (<10%) Recurrent respiratory tract infections
Angular cheilitis
Herpes zoster
Recurrent oral ulcerations
Seborrheic dermatitis
Papular pruritic eruptions
18 Stage 3
Unexplained severe weight loss (>10%)
Unexplained persistent fever for >1 month
Unexplained chronic diarrhea for >1 month
Persistent oral candidiasis
Oral hairy leukoplakia
Pulmonary tuberculosis
Severe presumed bacterial infections (Pneumonia, meningitis,
bacteremia, bone or joint infection)
Acute necrotizing ulcerative gingivitis, stomatitis or periodontitis
Anemia or Neutropenia or Chronic thrombocytopenia
Stage 4
Conditions where a presumptive diagnosis can be made on the basis of clinical signs or simple investigations
HIV wasting syndrome
Pneumocystis pneumonia
Recurrent severe bacterial pneumonia
Chronic herpes simplex infection (>1 month or visceral herpes at any site)
Esophageal candidiasis
Extra pulmonary tuberculosis
Cytomegalovirus infection (infection of retina or other organs)
Kaposi sarcoma
Toxoplasmosis of the central nervous tissue
19 Conditions where confirmatory diagnostic testing is necessary:
Extra pulmonary Cryptococcosis including meningitis
Progressive multifocal leukoencephalopathy
Disseminated non tuberculosis mycobacteria infection
Disseminated mycosis
Candida of the bronchi, trachea, or lungs
Recurrent non typhoidal Salmonella bacteremia
Chronic cryptosporidiosis or isosporiasis (with diarrhea)
Invasive cervical carcinoma
Atypical disseminated leishmaniasis
Lymphoma
Symptomatic HIV-associated cardiomyopathy or nephropathy
[image:26.595.70.564.552.765.2]Reactivation of American trypanosomiasis
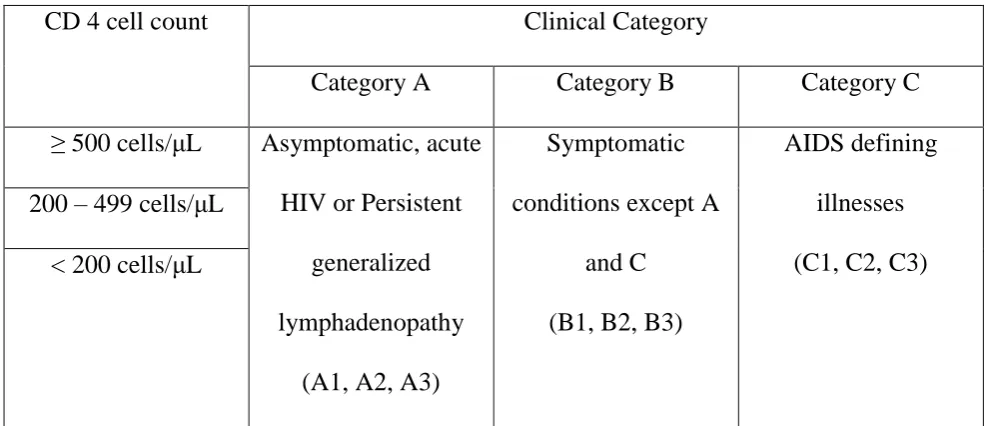
Table 2: CDC classification of HIV
CD 4 cell count Clinical Category
Category A Category B Category C
≥ 500 cells/μL Asymptomatic, acute
HIV or Persistent
generalized
lymphadenopathy
(A1, A2, A3)
Symptomatic
conditions except A
and C
(B1, B2, B3)
AIDS defining
illnesses
(C1, C2, C3) 200 – 499 cells/μL
20 3.8.HIV Testing Strategies
National AIDS Control Organisation (NACO) is a section of the Ministry of Health and
Family Welfare (MOHFW) responsible for formulating policies and executing
programmes for the prevention and control of the HIV in India. National AIDS control
programme (NACP) was first established in 1992, which aimed at controlling the spread
of HIV infection. NACP-IV (2012-2017) is the current programme. and it aims to
reduce annual incidence of HIV infections by 50% (5,52).
Safety of blood and blood products is of prime importance because of the huge risk
involved in the transmission of HIV through blood and blood products. The positive
predictive value is low in populations with low HIV prevalence so the
WHO/Government of India evolved strategies. There are three different strategies to
detect HIV infection in the different population groups and different situations. The
various strategies designated involve the use of categories of tests in many permutations
and combinations(53).
1. ELISA or Rapid tests are used in strategy I, II, & III
2. Confirmatory tests with high specificity like western blot and line
immunoassays, are used in cases of indeterminate/discordant result of ELISA or
Rapid tests
Recommendation by NACO for HIV testing
ELISA kits with a sensitivity of ≥99.5% and a specificity of ≥98%.
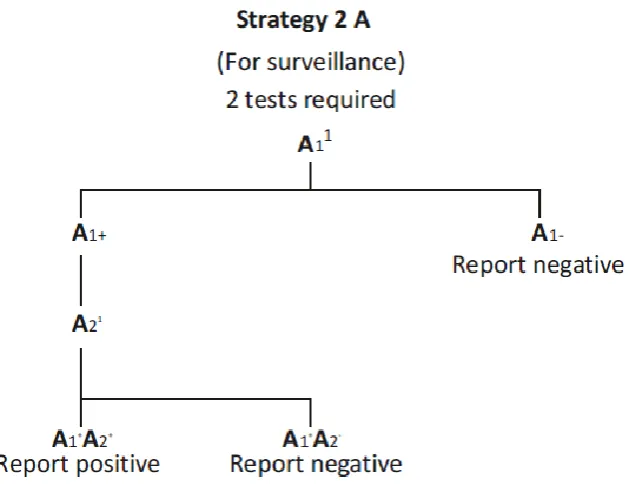
21 The different strategies for HIV testing used in different situations are shown in Fig 2, 3, 4 and 5
Figure 2: Strategy 1 – For blood transfusion/transplant safety
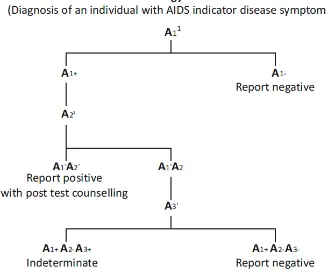
22 Figure4: Strategy 2 B – Used for diagnosis in symptomatic individuals
23 The assays A1, A2, A3 are 3 different assays which are based on different principles or
different antigenic compositions. A1 should be of high sensitivity. A2 and A3 should be
of high specificity to minimize false positive reactions. A2 and A3 should also be able
to differentiate between HIV 1 & 2 infections. In case of indeterminate, testing should
be repeated on a second specimen taken after 14-28 days. If results continue to be
indeterminate, then the specimen is to be subjected to Western Blot /PCR(53).
3.9. Recent infection
There are many developed laboratory tests which differentiates recently acquired HIV
infections from long term infection based on the principle that the immunological
response to HIV infection takes a few months to evolve after infection. The indicator of
recent infection is usually a marker which is present during the initial period but later
disappears. In such tests, “recent” usually means the duration of up to one year after an
individual has acquired the infection (14).
HIV incidence is the rate at which a population acquires HIV infection. It is a
quantitative indicator that measures the magnitude of current HIV transmission in a
community.
Estimation the HIV incidence is done for population surveillance, for evaluating of the
impact of preventive interventions and for evaluating the efficacy of early treatment or
a new preventive intervention. Surveillance helps in identifying the incidence patterns
between different population groups and over time. Surveillance may monitor HIV
infection in the general population or in the high risk groups and advices governments
24 Incidence ratios evaluates the outcome of an intervention by comparing the incidence
between two populations or across two time periods. Only after approximating the
absolute incidence with some accuracy are populations selected for early treatment or
prevention cohort. The feasibility of population selection depends on detecting a
specific number of new HIV infections in the population.
Estimation using laboratory tests for recent HIV infection includes estimating the
number of individuals with newly acquired HIV-1 infection in a population using a test
for recent HIV infection and using a mathematical formula to derive HIV incidence.
It does not require repeated test in individuals so can be used in samples collected in
cross sectional studies. Its disadvantages are biases that arise in sample selection and
chance of misclassifying long term infection as recent infection (false recent rate –
FRR). Another limitation is the difference in assay performance across different
population groups and different HIV subtypes. The incidence derived from multiple
methods is more reliable than when it is based on a single method (12).
3.9.1. Tests available for recent infections
Majority of the Tests for Recent (HIV) Infections (TRI) are based on principle that
maturation and evolution of HIV-1 specific antibodies occur within first two years of
seroconversion(15).
Till date, there are 8 types of assays as tests for recent HIV infection. Among these
assays , some have been specifically developed for identifying recent infection, while
25 1. Less-sensitive enzyme immunoassay – Majority of the antibody assays for HIV infection can be modified for use as a test for recent infection utilizing the
principle that antibody titers rise for few months after acquisition of the infection
Majority of the standard antibody assays for HIV infection can be altered for use
as a test for recent infection utilizing the principle that antibody titers rise for
several months after acquiring the infection. Janssen et al described this method
first. It is based on the enzyme immunoassay (EIA) produced by Abbott
laboratories and which was modified to create a less-sensitive HIV antibody
test(57). The enzyme immunoassay was made less sensitive by diluting the
plasma and reducing the incubation time. Confirmed HIV-1 positive samples
were tested again using the less sensitive EIA. Individuals with recent HIV
infection and an early immune response had lower level of HIV antibodies and
therefore they tested negative in the less-sensitive EIA.
Many other assays have also been modified in a similar manner way to estimate
incidence. Two immunoassays which have been commercially modified as
less-sensitive EIAs were the Avioq HIV-1 Microelisa and Abbott 3A11. For detection
of recent HIV infection even rapid antibody tests have been modified. The
limitation of these assays were that they used HIV-1 subtype B alone as antigen
so it could not be used in other parts of the world where there is prevalence of
other subtypes of HIV (12)
2. Proportional assay – This assay measures the proportion of all the immunoglobulin G in an individual’s serum which is specifically against HIV.
26 term infection. The commercial assay based on this principle is the IgG antibody
capture BED-enzyme immunoassay (BED-CEIA). BED CEIA was developed
particularly for the identification of recent HIV infection(58).BED capture EIA
uses a synthetic antigen and this assay can be used against HIV subtypes B, E
and D (12).
3. Avidity assay – Avidity is the strength of the bond between an antigen and an antibody. These assays are based on the principle that individuals with recent
have antibodies of low avidity. After measuring the total anti-HIV response, a
denaturation agent is added which separates the antibodies with weak bonds.
Then avidity index is calculated as optical density (OD) of the well treated with
denaturation agent divided by OD of well washed with phosphate buffered
saline. Avidity index of ≤ 0.80 is considered as recent infection and avidity index
> 0.80 is considered as long term infection(59,60).
4. p24 antigen – It is possible to detect p24 antigen within a few days after the presence of virus in the blood and before HIV antibodies can be detected. When
the body initiates an immune response to the infection the level of p24 antigen
falls. The presence of p24 antigen in absence of HIV specific antibodies is
suggestive of recent infection. The use of this test is limited for detecting recent
infection as the presence p24 antigen is brief (1-2 weeks) and unreliable (12).
27
Immunodominant epitope (i.e. IDE) of envelope protein gp41 comprising
of two oligopeptides of 30 amino acids; and one of the oligopeptide is
from group M and the other oligopeptide is from HIV-1 subtype D
Conserved sequence from the V3 loop of glycoprotein120. It contains
oligopeptides from HIV-1 subtypes A, B, C, D and E.
The assay uses a formula to calculate the combination of quantitative
responses to the antigens from each region to differentiate recent infection
from long term infection. The IDE-V3 assay has low sensitivity (12,61).
6. HIV RNA – The HIV RNA detection in the absence of HIV antibody is also utilized to identify recent HIV infection. Compared to p24 antigen, HIV RNA
can be detected much earlier (62). If pooled HIV RNA is used, it can increase
the accuracy of RNA amplification assay and lower the cost of testing. The
limitation is, it requires very large sample population size for determining HIV
incidence.
7. IgG3 anti-p24 – During the course of an infection, the IgG isotypes formed in response to the infection varies. Isotype IgG3 is present transiently during the
initial few months of HIV-1 infection. IgG3 response is most reliable against p24
antigen. An enzyme immunoassay was developed where IgG3 to p24 antigen
was typically detectable only during the first four months of infection. The
results from the initial studies of this assay have not been generalized to different
groups with different subtypes of HIV infection (12).
28 diagnostics it confirms the presence of HIV specific antibodies. Inno-Line
immunoassay HIV 1/2 score is utilized to interpret results as either long term
infection or recent infection (63). It is an expensive assay.
9. HIV-1 LAg-Avidity EIA
It is a quantitative limiting antigen (LAg) avidity enzyme immunoassay (EIA)
for differentiating between long term and recent HIV-1 infections. Individuals
with recent HIV-1 infections normally have HIV IgG with lower avidity than
those with established HIV-1 infections. It measures avidity of the HIV-1
antibodies in both serum and plasma samples(16,64).
The earliest tests were desensitized or “less sensitive” commercially available
HIV immunoassays (57,65–71) based on the principle that lower titers of HIV
antibodies were typical of recent infections. All the less sensitive commercial
immunoassays were a modification of HIV immunoassay that used HIV-1
subtype B as antigen so the assay was unreliable in populations in other parts of
world (70,71). The subtype bias was overcome by the utilization of synthetic
antigen which had sequences from different subtypes and a capture format
helped to measure the proportion of HIV-1 antibodies which increased after
seroconversion. The BED capture enzyme immunoassay utilizes a synthetic
antigen with sequences from HIV-1 subtype B, E and D (58). But BED CEIA
used in several studies (72–77) showed a high false recency rates which gave an
overestimation of HIV-1 incidence being reported (78–81) and consequently
adjustments were proposed to improve the accuracy of the incidence estimates
29 have shown low false recency rates in studies in US populations (84,85). In order
to overcome the biases of the previous assays, the wells were coated with a
recombinant protein (rIDR-M) that had divergent sequences from
immunodominant region of gp41 from all the major subtypes and recombinants
of HIV-1 group M. Also limiting the concentration of the antigen in the wells
detected only antibodies with high avidity. Studies done in Africa using this
assay showed a false recency rate of less than 1%(86). As this assay is based on
the binding strength of the antibodies or functional avidity, it is less likely to be
affected by disease state compared to previous assays. Normalized optical
density (ODn) cutoff of this assay is 1.5 to classify recent and long-term
infections. In LAg avidity assay, ODn value = 1.5 denotes a mean duration of
recent infection (MDRI) of 130 days (95% CI, 118-142)(87). The limitations of
this assay is that the usefulness of this assay at individual level has not yet be
assessed particularly when ODn values are close to the cutoff.
10.Limiting-Antigen Avidity Dot Immuno-Gold Filtration Assay
It is a rapid membrane based immunodiagnostic technique. Compared to the
enzyme immunoassay, they are more suitable for onsite testing because it is
rapid, economical and convenient and has visual characteristics. This is based on
avidity of antibody between long-term and recent infection. This assay increases
the sensitivity and accuracy by adding a silver staining technique. Its agreement
with LAg avidity assay was 95.36% (κ = 0.75) and 92.10% with BED assay (κ
30 3.10. Avidity and Antiretroviral therapy
HIV-1 infected individuals who were administered antiretroviral therapy (ART)
showed impaired production and maturation of IgG compared to before administration
of ART. ART seems to prevent the appearance of IgG antibodies(46). It can be due to
suppression of viral replication by ART as HIV replication results in production of
antibodies directly because of stimulating antigens or indirectly, due to release of
cytokines like Interleukin-6 and interferon which stimulate the B lymphocytes. Western
blot analysis has shown only limited number of recently HIV-1 infected individuals
showing high reactivity to pol and gag proteins. Administration of ART prevents
increase in avidity index and discontinuation of ART results increase in avidity
index(17). ART in primary HIV infection partially prevents the emergence of HIV-1
IgG antibodies(89). Viral suppression naturally induced and due to ART have
misclassified as recent infection those who have had long term HIV-1 infection when
tested using the BED capture EIA. Also viral breakthrough that is when an individual
on ART has an emergence of viral load >1000 copies/ml, such individuals showed an
increased proportion of IgG measured using BED capture EIA(18).
3.11. HIV Drug resistance
In 2004, WHO and CDC, along with HIVResNet, developed a global strategy for the
assessment and prevention of HIV drug resistance. And one of the components of the
strategy was to check for transmitted drug resistance in recently infected HIV-1
31 HIV drug resistance is of two type – transmitted drug resistance and acquired resistance
associated with treatment failure.
Primary or Transmitted drug resistance
Transmitted drug resistance is defined as an occurring when individuals are newly
infected with an already resistant virus(92,93). The increased use of antiretroviral drugs
has resulted in an increase in the incidence of drug resistance and eventually a large
pool of resistant virus strains becoming available to establish new infections. The
transmission of drug resistant viruses does not depend on a particular route of infection
(94).
Acquired Resistance occurs when HIV-1 infected individual on ART and was
responding initially but later develops resistance to the antiretroviral drugs. That is, they
acquired resistance following administration of ART.
Drug resistant HIV-1 can interfere with successful treatment and management of
therapy in HIV-1 infected individuals. So when an individual has drug resistance, the
treatment options available is limited and it affects our efforts to slow down the
progression of the disease. Furthermore, this can lead to increased rates of transmitted
drug resistance because of the pool of drug resistant strains available to infect more
32
4.
Materials and Methods
The study was done in the Departments of Clinical Virology and Infectious Diseases,
Christian Medical College and Hospital, Vellore. It was approved by the Institutional
Review Board (Reference IRB Minutes No: 9527 dated 07.07.2015).
4.1.
Materials
Study subjects:
The study participants were classified in 5 different groups
Group 1: Consecutive positive samples (using NACO strategy 3) of HIV-1 infected individuals from ICTC, CMCH. The study was explained to all the participating
individuals and was recruited in the study only after getting a written informed consent.
This cross sectional study was done during a period of 1 year (August 2015 – July 2016).
Inclusion criteria for samples from ICTC:
1. Adults >18yrs of age
2. HIV-1 infected individuals
3. Treatment naive
4. Individuals willing participate in the study by signing informed consent
Group 2: First negative sample from ICTC volunteers of each week who are negative for HIV infection to serve as controls.
Inclusion criteria for control from ICTC:
33 2. Negative for HIV infection
3. Individuals willing participate in the study by signing informed consent
Archived samples – Paired sera
Group 3: Archived paired sera of HIV-1 infected individual prior to treatment and after 6 months to 1 year of treatment and showing response to treatment.
Inclusion criteria for archived samples
1. Adults >18yrs of age
2. HIV-1 infected individuals
3. Sufficient volume of sample- treatment naïve and following 6 to 12 months’
treatment with CD4 counts and HIV-1 viral loads available
4. Individuals who have given informed consent for additional studies and wavier
towards this study
Group 4: Archived paired sera of HIV-1 infected individual on ART for a minimum of one year, showing response to treatment and after developing drug resistance
Inclusion criteria for archived samples:
1. Adults >18yrs of age
2. HIV- 1 infected individuals on treatment for at least 1 year initially showing response
to treatment and later showing treatment failure with CD4 counts and HIV-1 viral loads
34 4. Individuals who have given informed consent for additional studies and wavier
towards this study
Group 5: Archived samples (n = 3) positive by 4th generation assays were also used
These samples were tested using multiple 3rd and 4th generation assays, those samples
which tested positive by 4th generation assays and negative by 3rd generation assays
were assumed to be negative for IgG antibody and positive for HIV-1 antigen. All these
were characterized samples positive only for antigen and negative for antibody. Hence
we assumed that the sample will be negative for the avidity assay. So it was used to
check the specificity of the assay.
Exclusion criteria for all groups
1. Individuals who haven’t given consent for additional studies
2. Individuals < 18years of age
3. Pregnant women
4. HIV-2 infected individuals
5.1.1. Sample size:
Group 1 and 2
In our ICTC, 15-20 positives cases of HIV-1 come every month. Of these, based on
history, 40-50% are recently infected. Based on this data, taking a prevalence (p) of
45% recently infected individuals among HIV-1 infected individuals with precision (d)
35 Here p (prevalence) = 45%, q (100-p) =55%
A precision (d) of 10, with 95% confidence interval (alpha error (Zα) of 1.96)
𝑆𝑎𝑚𝑝𝑙𝑒 𝑠𝑖𝑧𝑒 (𝑛) =𝑍2×𝑝× (100−𝑝) ÷𝑑2
Sample size (n) = (1.96 x 1.96) x 45x 55/ 100 ≈ 96
Even though the calculated sample size was 96, blood samples were collected from 117
consecutive treatment naïve HIV-1 infected individuals who attended the ICTC,
CMCH. The samples were collected from those who gave consent for the study.
For controls (Group 2), we collected the first sample of the week which tested negative
for HIV in ICTC with written informed consent from the volunteer (n = 40)
For the group 3 the sample size was calculated in the following way,
Study by Re et al showed decrease in the avidity antibodies in approximately 80% of
HIV-1 infected individuals(17).
With a precision d=15%. Prevalence (p1) = 82%, q1= (100-p) =18
𝑆𝑎𝑚𝑝𝑙𝑒 𝑠𝑖𝑧𝑒=𝑍2 ×𝑝× (100−𝑝) ÷𝑑2
Sample size = 1.96x 1.96 x 82x 18/225 ≈ 26
In group 4 all the available pairs were taken (n=7)
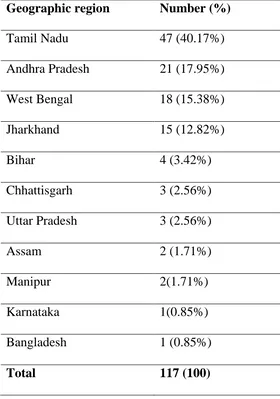
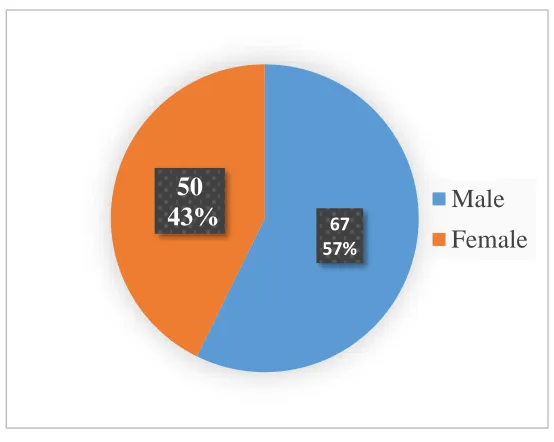
Information collected from the study recruits included the individuals’ age, sex,
regional identification, marital status, occupation, history of exposure and any high risk
36 Samples tested
1. Serum samples from treatment naïve HIV-1 infected individuals (n = 117)
2. Serum samples from HIV negative individuals (n = 40)
3. Archived paired sera of HIV-1 infected individual prior to treatment and after 6
months to 1 year of treatment and showing response to treatment (n = 25 x 2 =
50)
4. Archived paired sera of HIV-1 infected individual on ART for 1year, showing
response to treatment and after developing drug resistance (n = 7 x 2 = 14)
5. HIV-1 infected individuals who tested positive by 4th generation assays and
negative by 3rd generation assays (n = 3)
Specimen
A total of 2ml of blood sample was collected in a sterile red capped BD vacutainer (New
Jersey, USA) in ICTC. After testing was done in ICTC, the remaining sample was
obtained for the study with written informed consent. Serum was separated and stored
in multiple aliquots of 200 μL at -60°C until testing.
For group 3, 4 and 5 the specimens were aliquots of plasma/ serum sample stored at
37
5.2.
Methods
5.2.1.
HIV-1 limiting antigen avidity assay
The LAg Avidity enzyme immunoassay (Sedia Biosciences Corporation, Oregon,
38 The wells of this assay are coated with recombinant proteins containing the HIV-1
immune dominant region (IDR) of gp41.
1. The assay had four types of controls - the negative control, the calibrator, the low
positive control and the high positive control. All the controls were tested in
triplicates as per manufacturer’s instruction and during the initial testing all
specimens were tested singly.
2. Serum specimens was diluted 1:101 that is 500 μL of sample diluent and 5 μL of
sample. The sample diluent contains phosphate buffered saline, blocking agents,
detergent and preservatives. The Eppendorf tubes were marked with the sample
ID and 500 μL sample diluent was added in each tube and 5 μL of each control,
calibrator, and sample was transferred to respective Eppendorf tubes.
3. After mixing properly, 100 μL of diluted negative control was added to wells
A1, B1 and C1 of the avidity plate; 100 μL of diluted calibrators was added to
the wells D1, E1 and F1; 100 μL of diluted low positive controls was added to
wells G1, H1 and A2 and 100 μL of diluted high positive control was added to
wells B2, C2 and D2. After addition of controls, the samples were added in the
respective wells. The plate was sealed and incubated for 1 hour at 37°C (±2°C).
4. After 1 hour, the avidity plate was washed 4 times with 1X wash buffer. To each
well, 300 μL of wash buffer was added and allowed to soak for 10 seconds. After
washing, residual buffer was removed by gently tapping the plate upside down
on absorbent paper.
5. Then 200μL of dissociation buffer was added to each well. Plate was sealed and
39 6. During this time conjugate working solution was prepared, 12 ml of sample
diluent was transferred to sterile clean petri dish and 12 μL of the goat
anti-human IgG conjugated to horse radish peroxidase (HRP) concentrate was added
to it and to prepare a 1:1001 dilution. The petri dish was closed and contents
were mixed gently.
7. After the incubation, the plate was washed with 4 times with 1X wash buffer and
residual buffer was removed by gently tapping the plate on an absorbent paper.
8. After this, 100 μL of the conjugate working solution was added to each well. The
plate was sealed and incubated at 37°C (±2°C) for 30 minutes.
9. After the incubation period, the plate was washed 4 times with 1X wash buffer
and residual buffer removed by gently tapping the plate on an absorbent paper
10.Then 100 μL of tetramethyl benzidine (TMB) substrate was added to each well.
The plate was incubated for exactly 15 minutes at 25°C (±2° C) avoiding
exposure to light.
11.After 15 minutes of TMB incubation, the reaction was stopped by addition of
100μL of stop solution (dilute acid) to each well.
12.The plate was read at 450 nm and 620-650 nm using a spectrophotometer
(μQuant™, BioTek Instruments Inc. Vermont, USA) immediately after the
addition of stop solution
13.Run validation and results were calculated according to the manufacturer’s
instruction. The median OD values of controls and calibrator must be within the
40
Table 3: Acceptable OD ranges for Controls and Calibrator in LAg avidity assay used in the study
Negative control
Calibrator Low positive control
High positive control
Minimum OD 0.000 0.400 0.190 0.830
Maximum OD 0.175 0.950 0.520 1.820
The normalized OD (ODn) was calculated for each control, calibrator and
sample. Normalization of the OD value using an internal calibrator decreases the
assay variability and increases the reproducibility(16,83). For the test to be valid
the ODn of controls and calibrators must within range.
ODn value of control and calibrator must fall within the acceptable range. Table 4.
Table 4: Acceptable ODn ranges for the Controls and Calibrator in LAg avidity assay used in the study
Negative control
Calibrator Low positive control
High positive control
Minimum ODn 0.000 1.000 0.370 1.500
Maximum ODn 0.240 1.000 0.700 2.400
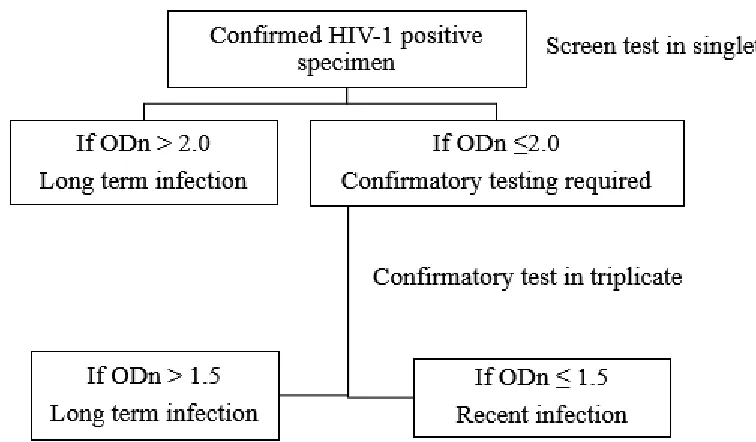
14.During screening mode, if ODn was > 2.0, then long term infection and if ODn
41 15.During confirmatory testing, if the ODn was ≤1.5 then recent infection. If ODn
was > 1.5, then long term infection. Confirmatory testing of the samples was
done in triplicates. That is the controls, calibrators were tested as for the
screening test but the difference is that all samples with ODn ≤ 2.0 were tested
in triplicates. When samples are run in triplicate the mean OD is used to calculate
the ODn. The algorithm and interpretation for LAg avidity assay is shown in Fig 6.
16.The avidity of the antibody was measured as normalized optical density value
adjusted by calibrator and controls. Samples with ODn value below 1.5 was
[image:48.595.100.478.303.524.2]42
5.2.2.
In house avidity assay
The in house avidity assay was a modification of Microlisa HIV ELISA (Second
generation ELISA using HIV envelope proteins gp41, gp120 for HIV-1 and gp36 for
HIV-2) from J. Mitra (New Delhi, India) diagnostic products. The manufacturer’s
instruction was followed for addition of controls and sample to micro wells. The
treatment of the duplicate wells with 7M urea solution (pH=3.0) is the modification
used.
Preparation of 7M urea solution
o Urea was obtained from Fisher Scientific, Product No: 20885
o The molecular weight of urea = 60.06 g/mol
o 1M Urea solution = 1mole in 1L of distilled water (DW) = 60.06g in 1000ml
of DW
o 7M Urea solution = 7 x 60.06 g in 1000ml DW= 420.42 g in 1000 ml of DW
o For preparation of 100 ml of urea solution 42.04 g of urea was added in 100ml
of DW
o The initial pH of the prepared solution was 6.4 and it set to 3.4 using pH
meter CyberScan pH 1500 (Thermo Scientific).
o The prepared urea solution was filtered and then stored at 4°C until use
Procedure
1. The controls were ready to use and required no dilution. 100μL of sample diluent
was added to first well as blank, and 100μL of negative control was added in
43
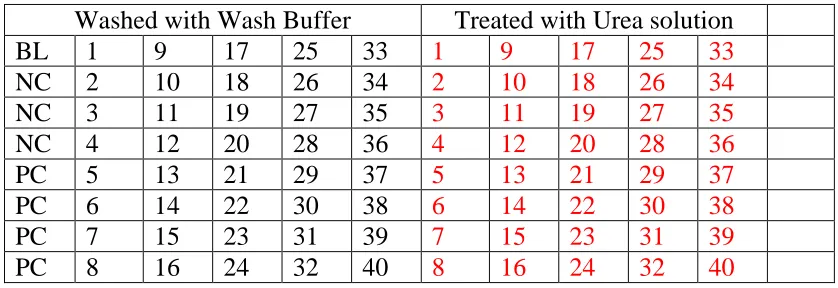
Table 5: The plate configuration used for the in-house avidity assay
Washed with Wash Buffer Treated with Urea solution
BL 1 9 17 25 33 1 9 17 25 33
NC 2 10 18 26 34 2 10 18 26 34
NC 3 11 19 27 35 3 11 19 27 35
NC 4 12 20 28 36 4 12 20 28 36
PC 5 13 21 29 37 5 13 21 29 37
PC 6 14 22 30 38 6 14 22 30 38
PC 7 15 23 31 39 7 15 23 31 39
PC 8 16 24 32 40 8 16 24 32 40
2. The sample was diluted in sample diluent 1:11, that is 10μL of sample and 100μL
of sample diluent. For a sample which was tested, 10 μL each was added in two
different wells, that is, one well which was washed with wash buffer and second
well which was washed with 7M urea solution as shown in Table 5. It was incubated at 37°C for 30 minutes.
3. After incubation, the entire plate was washed once with wash buffer (Phosphate
buffered saline, included in the kit) using an automated strip washer (ELx50 strip
washer, Bio-Tek Inc. USA). After wash, residual buffer was removed by gently
tapping the plate over an absorbent paper.
4. Subsequently 300μL of wash buffer was added to the wells which had the
controls and the samples. To the duplicate wells, 300μL of 7M urea solution with
pH=3.0 was added and the plate was incubated for 15 minutes at room
temperature. Urea solution was used as a dissociation agent and it has effective
separation at pH=3.0(16).
44 5. After incubation, the plate was washed 5 times with wash buffer.
6. The concentrate of anti-human IgG conjugated with horse radish peroxidase was
diluted with conjugate diluent in the ratio 1:100 and 100 μL of working conjugate
was added to each well and the plate was incubated at 37°C for 30 minutes.
7. After incubation, the plate was washed 5 times with wash buffer.
8. Tetramethylbenzidine (TMB) substrate was diluted in TMB diluent in the ratio
1:1 and 100μL of working substrate was added to all the wells and plate was
incubated at room temperature for 30 minutes avoiding exposure to light
9. After 30 minutes, the reaction was stopped using the stop solution (1N sulfuric
acid).
10.The plate was read at 450nm using a spectrophotometer (μQuant™, BioTek
Instruments Inc. Vermont, USA) after blanking the blank well within 30 minutes
of adding the stop solution.
Test was valid when the controls were within limits as shown in Table 6.
Table 6: Acceptable limit for controls in house assay based on manufacturer’s instruction for the commercial assay
Blank Negative Control Positive Control
OD value < 0.100 ≤ 0.150 ≥ 0.50
The Avidity Index (AI) is calculated by formula as previously described(45)
To be considered as recently infected the AI value cutoff was ≤ 0.80(60,59) and all
45 When the AI values were ≤ 0.80, the samples were tested in duplicates. In cases where
there was discrepancy with AI and ODn. The samples were also tested in duplicates.
And the median value was considered as the avidity index.
5.2.3.
Western Blot
The assay used for the Western Blot was HIV BLOT 2.2 (MP Diagnostics, Singapore). It is a qualitative EIA for the detection of antibodies to HIV-1 and HIV-2 in human
serum or plasma. It is a supplementary test used for specimens found repeatedly reactive
using screening procedures like ELISA.
The nitrocellulose strips were blotted with separated antigenic proteins from inactivated
HIV-1 by electrophoretic blotting procedures, combined with a specific HIV-2
synthetic protein on the same strip. Each strip was included with an internal sample
control to reduce the risk of false negatives due to technical errors and to ensure that the
sample has been added. The serum samples to be tested were inactivated at 56°C in
water bath for 30 minutes.
Procedure
1. The individual nitrocellulose strips were removed from the tube and placed in
trough with the numbered side of strip facing up
2. To each trough, 2ml of wash buffer (tris buffer with tween 20) was added and
incubated at room temperature on a rocking platform for 2 minutes.