Segmentation of
Adults by Attitudes
Towards Learning
and Barriers to
Learning
DIUS Research Report 08-01
ISBN 978 1 84478 982 5
© Queen’s Printer and Controller of HMSO 2008
The views expressed in this report are the authors’ and do not necessarily reflect those of the Department for Innovation, Universities and Skills.
Segmentation of Adults by
Attitudes Towards Learning and
Barriers to Learning
Table of Contents
1. Executive Summary
2. Introduction
2.1. Background to National Adult Learning Survey (NALS) 2005
3. Methodology
3.1. Data cleaning
3.2. Data reduction
3.3. Cluster Analysis
3.4. Discriminant analysis
4. Segmentation results
4.1. Segment 1 - Enthusiastic and Enlightened – 29.2% of the population
4.2. Segment 2 - Fulfilled and Family-focused – 14.5% of population
4.3. Segment 3 - Hampered Hard Workers – 7.1% of population
4.4. Segment 4 - Looking for Learning – 4.9% of population
4.5. Segment 5 - Trapped on a Treadmill – 5.9% of population
4.6. Segment 6 - Older into Other Things – 11.1% of the population
4.7. Segment 7 - Too Late to Learn – 10.6% of the population
4.8. Segment 8 - Sceptical but Scraping by – 5.5% of population
4.9. Segment 9 - Unfulfilled and Unhappy – 8.6% of population
4.10. Segment 10 - Disaffected and Discouraged – 2.6% of population
5. Using the segmentation results
5.1. Implications for policy and communications strategy
1. Executive Summary
Meeting the government’s stated intention for the UK to become a world leader in skills requires large numbers of adults to upgrade their qualifications. To encourage this, we need to understand the range of motivations that might increase levels of adult learning.
The Department for Innovation, Universities and Skills (DIUS) recognises that different strategies may be required to encourage different segments of individuals to participate in adult learning. To this end, DIUS has developed a ten group segmentation which divides up the adult population according to their attitudes to learning and the range of obstacles that they feel deter them from taking part. These ten segments can be portrayed on an axis from the most positive to the most negative.
At one extreme are individuals who need no prompts to further learning during their lives. This segment fully recognises the need for lifetime learning and has found its own
solutions. At the other extreme are two segments which have considerable learning needs, but which will be very difficult to encourage into adult learning. There are also two segments of predominantly older individuals who feel that learning is not appropriate for them at their late stage in life.
In between these extremes are five segments with different obstacles to learning and with different attitudes and demographics, which offer perhaps the greatest
opportunity to improve skills by 2020. As the different segments have different obstacles to overcome, segment specific communication and service development strategies are likely to be necessary for each.
2. Introduction
The Leitch Review of Skills which was endorsed by the Chancellor of the Exchequer in the pre-Budget Report 2006 has set the intention for UK to be a world leader on skills by 2020. To deliver this vision we need a great many adults to upgrade their levels of qualifications. Many of these adults will not have undertaken much learning since they left compulsory education and we need to understand how they might be encouraged to learn.
To this end, the Department for Innovation, Universities and Skills1 (DIUS)
commissioned Continental Research to develop a segmentation analysis of attitudes to learning and barriers to learning amongst adults. This report presents the results of that segmentation. The analysis was undertaken using data from the National Adult Learning Survey (2005) dataset. The purpose was to understand what segments of adults could be recognised based on their attitudes and barriers to learning. Once these segments of adult learners have been identified then it may then be easier to design policies which meet the needs of particular segments which would attract them to improve their level of qualifications.
The methodology assumes that whether or not people will learn depends on their attitudes towards learning, and on their barriers to learning. It is widely agreed that socio-demographics factors affect attitudes, but the cluster analysis was based purely on attitudes and barriers to learning. However, once the segments had been
established, the socio-demographics were examined to see what sort of people held particular attitudes.
2.1. Background to National Adult Learning Survey (NALS) 2005
The National Adult Learning Survey (2005) was carried out by the National Centre for Social Research on behalf of the DfES. The survey was conducted between October 2005 and February 2006 and involved face to face interviews with adults aged 16 or over in England, Scotland and Wales. However, the dataset used for the
segmentation analysis was only those adults aged 19-69 living in England and Wales – a total of 3,173 respondents.
The survey asked a number of questions about a variety of learning experiences in the previous three years or since leaving continuous full-time education.
3. Methodology
3.1. Data cleaning
A number of data cleaning and data reduction analyses were undertaken prior to the segmentation analysis. The data cleaning analyses involved replacing any missing values for the 22 attitude statements with mean scores for the sample as a whole. This is necessary to allow all data to be used in the segmentation analysis. No such cleaning was required for the “obstacles to learning” question, as this was a
multicoded question converted into a series of binary variables – one for each of the 27 possible codes in the original question. Respondents, who had not undertaken any adult learning, as defined in the survey, were asked which of these were
obstacles and those that had taken part in adult learning were asked which of these were obstacles to any additional adult learning.
Each of these 49 variables was then standardised to have zero mean and variance of unity. This is achieved by a transformation of each variable, subtracting the mean from the observation and dividing the resultant figure by the standard deviation. The rationale for standardising variables is to remove any scale effects from the questions, so that each variable is measured on a consistent basis.
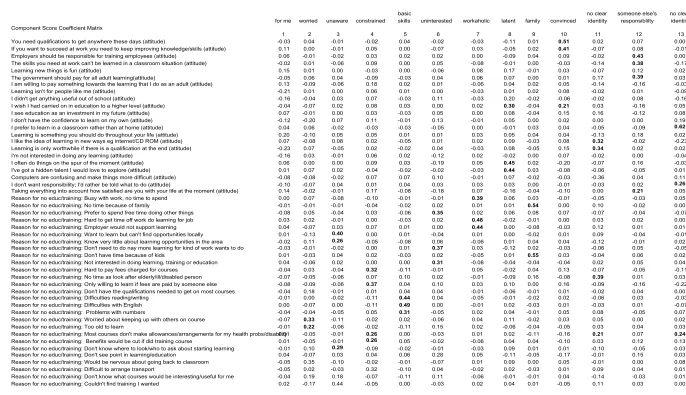
3.2. Data reduction
Table 1 - results of factor analysis
for me worried unaware constrained basic
skills uninterested workaholic latent family convinced no clear identiity someone else's responsiblilty no clear identiity Component Score Coefficient Matrix
1 2 3 4 5 6 7 8 9 10 11 12 13
You need qualifications to get anywhere these days (attitude) -0.03 0.04 -0.01 -0.02 0.04 -0.02 -0.03 -0.11 0.01 0.51 0.02 0.07 0.00
If you want to succeed at work you need to keep improving knowledge/skills (attitude) 0.11 0.00 -0.01 0.05 0.00 -0.07 0.03 -0.05 0.02 0.41 -0.07 0.08 -0.01
Employers should be responsible for training employees (attitude) 0.06 -0.01 -0.02 0.03 0.02 0.02 0.00 -0.09 0.04 0.09 -0.02 0.43 0.00
The skills you need at work can't be learned in a classroom situation (attitude) -0.02 0.01 -0.06 0.09 0.00 0.05 -0.08 -0.01 0.00 -0.03 -0.14 0.38 -0.17
Learning new things is fun (attitude) 0.15 0.01 0.00 -0.03 0.00 -0.06 0.08 0.17 -0.01 0.03 -0.07 0.12 0.02
The government should pay for all adult learning(attitude) -0.05 0.06 0.04 -0.09 -0.03 0.04 0.06 0.07 0.00 0.01 0.17 0.39 0.03
I am willing to pay something towards the learning that I do as an adult (attitude) 0.13 -0.09 -0.06 0.18 0.02 0.01 -0.06 0.04 0.02 0.05 -0.14 -0.16 -0.03
Learning isn't for people like me (attitude) -0.21 0.01 0.00 0.06 0.01 0.00 -0.03 0.01 0.02 0.08 -0.02 0.01 -0.09
I didn't get anything useful out of school (attitude) -0.16 -0.04 0.03 0.07 -0.03 0.11 -0.03 0.20 -0.02 -0.06 -0.02 0.08 -0.16
I wish I had carried on in education to a higher level (attitude) -0.04 -0.07 0.02 0.08 0.03 0.00 0.02 0.30 -0.04 0.21 0.03 -0.16 0.05
I see education as an investment in my future (attitude) 0.07 -0.01 0.00 0.03 -0.03 0.05 0.00 0.08 -0.04 0.15 0.16 -0.12 0.08
I don't have the confidence to learn on my own (attitude) -0.12 -0.20 0.07 0.11 -0.01 0.13 -0.01 0.05 0.00 0.02 0.00 0.00 0.19
I prefer to learn in a classroom rather than at home (attitude) 0.04 0.06 -0.02 -0.03 -0.03 -0.05 0.00 -0.01 0.03 0.04 -0.05 -0.09 0.62
Learning is something you should do throughout your life (attitude) 0.20 -0.10 0.05 0.05 0.01 0.01 0.03 0.05 0.04 0.04 -0.13 0.18 0.02
I like the idea of learning in new ways eg internet/CD ROM (attitude) 0.07 -0.08 0.08 0.02 -0.05 0.01 0.02 0.09 -0.03 0.08 0.32 -0.02 -0.23
Learning is only worthwhile if there is a qualification at the end (attitude) -0.23 0.07 -0.05 0.02 -0.02 0.04 -0.03 0.08 -0.05 0.15 0.34 0.02 0.02
I'm not interested in doing any learning (attitude) -0.16 0.03 -0.01 0.06 0.02 -0.12 0.02 -0.02 0.00 0.07 -0.02 0.00 -0.04
I often do things on the spur of the moment (attitude) 0.06 0.00 0.00 0.09 0.03 -0.19 0.05 0.45 0.02 -0.20 -0.07 0.16 -0.03
I've got a hidden talent I would love to explore (attitude) 0.01 0.07 0.02 -0.04 -0.02 -0.02 -0.03 0.44 0.03 -0.08 -0.06 -0.05 0.01
Computers are confusing and make things more difficult (attitude) -0.08 -0.08 -0.02 0.07 0.07 0.10 -0.01 0.07 -0.02 -0.03 -0.36 0.04 0.11
I don't want responsibility; I'd rather be told what to do (attitude) -0.10 -0.07 0.04 0.01 0.04 0.03 0.03 0.03 0.00 -0.01 -0.03 0.02 0.26
Taking everything into account how satisfied are you with your life at the moment (attitude) 0.14 -0.02 -0.01 0.17 -0.08 -0.18 0.07 -0.16 -0.04 -0.10 0.00 0.21 0.05
Reason for no educ/training: Busy with work, no time to spend 0.00 0.07 -0.08 -0.10 -0.01 -0.01 0.39 0.06 0.03 -0.01 -0.05 -0.03 0.05
Reason for no educ/training: No time because of family -0.01 -0.01 -0.01 -0.04 -0.02 0.02 0.01 0.01 0.54 0.00 0.10 -0.02 0.00
Reason for no educ/training: Prefer to spend free time doing other things -0.08 0.05 -0.04 0.03 -0.06 0.35 0.02 0.06 0.08 0.07 -0.07 -0.04 -0.07
Reason for no educ/training: Hard to get time off work do learning for job 0.03 0.02 -0.01 0.00 -0.03 0.02 0.48 -0.02 -0.01 0.00 0.03 0.02 0.00
Reason for no educ/training: Employer would not support learning 0.04 -0.07 0.03 0.07 0.01 0.00 0.44 0.00 -0.08 -0.03 0.12 0.01 0.01
Reason for no educ/training: Want to learn but can't find opportunities locally 0.01 -0.13 0.40 0.00 0.01 -0.04 0.01 0.00 -0.02 0.01 0.09 -0.04 -0.01
Reason for no educ/training: Know very little about learning opportunities in the area -0.02 0.11 0.26 -0.05 -0.08 0.06 -0.06 0.01 0.04 0.04 -0.12 -0.01 0.02
Reason for no educ/training: Don't need to do nay more learning for kind of work wants to do -0.03 -0.01 -0.02 0.00 0.01 0.37 0.03 -0.12 0.02 -0.03 -0.06 0.05 -0.05
Reason for no educ/training: Don't have time because of kids 0.01 -0.03 0.04 0.02 -0.03 0.02 -0.05 0.01 0.55 0.03 -0.04 0.06 0.02
Reason for no educ/training: Not interested in doing learning, training or education 0.04 -0.06 0.02 0.00 0.00 0.31 -0.08 -0.04 -0.04 -0.04 0.02 0.05 0.04
Reason for no educ/training: Hard to pay fees charged for courses -0.04 0.03 -0.04 0.32 -0.11 -0.01 0.05 -0.02 0.04 0.13 -0.07 -0.05 -0.11
Reason for no educ/training: No time as look after elderly/ill/disabled person -0.07 -0.05 -0.06 0.07 0.10 0.02 -0.01 -0.09 0.16 -0.08 0.39 0.01 0.03
Reason for no educ/training: Only willing to learn if fees are paid by someone else -0.08 -0.09 -0.06 0.37 0.04 0.10 0.03 0.10 0.00 0.16 -0.09 -0.16 -0.22
Reason for no educ/training: Don't have the qualifications needed to get on most courses -0.04 0.18 -0.01 0.01 0.04 0.04 -0.01 -0.06 -0.01 0.01 -0.02 0.04 0.00
Reason for no educ/training: Difficulties reading/writing -0.01 0.00 -0.02 -0.11 0.44 0.04 -0.05 -0.01 -0.02 0.02 -0.06 0.03 -0.03
Reason for no educ/training: Difficulties with English 0.00 -0.07 0.00 -0.11 0.49 0.00 -0.01 0.02 -0.03 0.01 -0.03 0.01 -0.07
Reason for no educ/training: Problems with numbers -0.04 -0.04 -0.05 0.05 0.31 -0.05 0.02 0.04 -0.01 0.05 0.08 -0.05 0.07
Reason for no educ/training: Worried about keeping up with others on course -0.07 0.33 -0.11 -0.02 0.02 -0.06 0.04 0.11 -0.02 0.03 0.05 0.00 0.02
Reason for no educ/training: Too old to learn -0.01 0.22 -0.06 -0.02 -0.11 0.15 0.02 -0.06 -0.04 -0.05 0.03 0.04 0.03
Reason for no educ/training: Most courses don't make allowances/arrangements for my health probs/disability0.01 -0.05 -0.01 0.26 0.00 -0.03 0.01 0.02 -0.11 -0.16 0.21 0.07 0.24
Reason for no educ/training: Benefits would be cut if did training course 0.01 -0.05 -0.01 0.26 0.05 -0.02 -0.06 0.04 0.04 -0.10 0.03 0.12 0.13
Reason for no educ/training: Don't know where to look/who to ask about starting learning -0.01 0.10 0.29 -0.09 -0.02 -0.01 -0.03 0.09 0.01 0.01 -0.10 -0.05 0.03
Reason for no educ/training: Don't see point in learning/education 0.04 -0.07 0.03 0.04 0.06 0.28 0.05 -0.11 -0.05 -0.17 -0.01 0.15 0.03
Reason for no educ/training: Would be nervous about going back to classroom -0.05 0.35 -0.10 -0.02 -0.01 -0.07 0.01 0.09 0.00 0.05 -0.01 0.00 0.08
Reason for no educ/training: Difficult to arrange transport -0.05 0.02 -0.03 0.32 -0.10 0.04 -0.02 0.02 -0.03 0.01 0.09 0.04 0.01
Reason for no educ/training: Don't know what courses would be interesting/useful for me -0.04 0.19 0.18 -0.07 -0.11 0.11 -0.06 -0.01 -0.01 0.04 -0.14 -0.03 0.01
3.3. Cluster Analysis
The dataset was subjected to a hierarchical cluster analysis, using the 13 rotated factors as input variables. Wards Method was used to form the aggregation and all solutions from 2 to 15 segments produced. The solutions with 8, 11 and 14 segments show large rises subsequently in within segment variance, suggesting that these three solutions are worthy of further consideration. It was felt that 11 and 14 segments were too many to work with, and the eight segment solution was initially selected as the optimum solution. Table 2 below shows the dendrogram, which identifies how segments split at each stage of the process.
Table 2 – cluster analysis dendrogram
The eight segment solution generates segments with from 83 to 899 respondents. Although this is a large range, the smallest segment was generated at the very first split of the process when two segments were formed. It is therefore a very distinct segment. The largest segment, with 899 respondents, survives until the 13 segment solution, and again is therefore a clearly distinct segment.
Further analysis of these eight segments demonstrated that two comprised individuals with differing characteristics and so these were each subdivided into two segments, producing a ten segment solution overall.
number of segments 3173
2 3090 83
3 2640 450 83
4 2262 378 83
5 2262 378 290 160 83
6 1810 452 378 290 160 83
7 1453 357 452 378 290 160 83
8 899 554 357 452 378 290 160 83
9 899 554 357 452 207 171 290 160 83
10 899 554 357 452 207 171 188 102 160 83
11 899 376 178 357 452 207 171 188 102 160 83
12 899 193 183 178 357 452 207 171 188 102 160 83
13 536 363 193 183 178 357 452 207 171 188 102 160 83
14 536 363 193 183 178 267 90 452 207 171 188 102 160 83
When weighted, the segments have the distribution shown in the pie chart below. The segments are arranged in order from most amenable to learning (1) to least amenable to learning (10):
29.2%
14.5%
7.1% 4.9%
5.9% 11.1% 10.6%
5.5%
8.6% 2.6% 1
3.4. Discriminant analysis
Discriminant analysis has been undertaken to identify the most important predictors of segment membership. The top ten predictors (in order of importance) are as follows:
Reason for no/limited learning: Difficulties with English Reason for no/limited learning: Couldn't find training I wanted Reason for no/limited learning: Difficulties reading/writing Reason for no/limited learning: No time because of family
Reason for no/limited learning: Only willing to learn if fees are paid by someone else Reason for no/limited learning: Hard to get time off work do learning for job
Whether there are people aged under 16yrs in household
Reason for no/limited learning: Not interested in doing learning, training or education Reason for no/limited learning: Employer would not support learning
Reason for no/limited learning: Want to learn but can't find opportunities locally
4. Segmentation results
The segments can be summarised in terms of the two dimensions of attitudes towards learning and number of barriers as shown below
Results: Generalised clusters whole
population
Fulfilled & Family Focussed Hampered Hard Workers
Looking for Learning Trapped on a treadmill
32.2% Enthusiastic & Enlightened
29.2%
Older into other things Too late to learn Sceptical and Scraping by
27.2%
Unfulfilled & Unhappy Disaffected & Discouraged
11.4% Low Barriers High Barriers Negative about learning Positive about learning
A more detailed summary is shown in the table below
Summary of Clusters
Not interested and busy with work More male than
average 98% 2.1 75% 50% 73% Sceptical but Scraping -by
Basic Skills and multiple barriers More male than
average 86% 9.0 54% 80% 82% Disaffected and Discouraged
Low confidence and multiple barriers More female than average 78% 5.2 44% 54% 96% Unfulfilled and unhappy
Low confidence and busy with family Mainly older women 100% 2.1 52% 58% 91% Too Late to Learn
Not interested in any learning Mainly older men 113% 3.1 66% 40% 94% Older into Other things
Can't afford learning and busy at work Younger than average 87% 5.4 78% 31% 96% Trapped on a Treadmill
Don't know where to look for training Younger than average 95% 4.5 72% 23% 105% Looking for learning
Too busy at work More male than
average 104% 3.7 97% 22% 109% Hampered Hard Workers
Too busy with family Mainly younger women with children 109% 2.1 75% 26% 106% Fulfilled and family focussed
None Mainly no children 102% 1.3 78% 24% 108% Enthusiastic and Enlightened
Barriers to learning Socio -Demographics Happy No of barriers to learning Working Below L2 Positive about learning New segment
The colour coding in the above chart uses a convention where green is above average, amber average and red below average. This helps to see in one chart how the ten segments rate against each other – an all green coded segment is above average on all measures shown whereas an all red coded segment is below average on all measures shown.
The ten segments have clearly differentiated characteristics and in the remainder of this report, we provide short pen portraits of each. The segments have been given an alliterative description, as follows:
1 - Enthusiastic and Enlightened – 29.2% of the population
Enthusiastic and Enlightened are very positive about learning, and have very few barriers. They are mostly employed and well qualified and they can be expected to invest in their training when necessary without external incentives 2 - Fulfilled and Family-focused – 14.5%
Fulfilled and Family-focused are positive about learning but they have little time to learn because of their family commitments. They tend to be younger women with children under 16 in their household. Most of them are working and well qualified
3 - Hampered Hard Workers – 7.1%
Hampered Hard Workers are positive about learning but tend to find it difficult to justify taking time away from work. Nearly all of them are in work, and most of them are well-qualified
4 - Looking for Learning – 4.9%
Looking for Learning are positive about learning, but unsure what training to do. Nearly all of them are in work, and most of them are well-qualified. They tend to be mostly under 45
5 - Trapped on a Treadmill – 5.9%
6 - Older into Other Things – 11.1%
Older into Other Things are slightly negative about learning. They are not interested in doing learning themselves and are very happy with their lives. Most of them are over 45, and a majority are male. Around two-thirds are in work and they have slightly less than average qualifications
7 - Too Late to Learn – 10.6%
Too Late to Learn tend to be older women. They are slightly negative about the value of learning but seem to have few barriers. Only about half of them are working, and a majority have qualifications below L2. Despite mostly having low incomes, they seem reasonably happy with their lives
8 - Sceptical but Scraping by – 5.5%
Sceptical but Scraping by have few barriers to learning but have a very negative attitude towards it. They are mostly in work even though half of them do not have L2 or above qualifications. Half of them have a low income and a majority of them are men, and are fairly happy with their lives
9 - Unfulfilled and Unhappy – 8.6%
Unfulfilled and Unhappy are slightly negative about learning but have many barriers. Less than half of them are working and over half are without level two qualifications. They are unhappy with their lives but don’t feel that learning could change things for them
10 - Disaffected and Discouraged – 2.6%
Disaffected and Discouraged have a negative perception of the value of learning, and they report a great many barriers to doing any. Only around half of them are working, and more than half have basic skills problems. Two-thirds have low incomes, and overall they are not very happy with their lives
4.1. Segment 1 - Enthusiastic and Enlightened – 29.2% of the population
Percentage of whole population:
Percentage of Sub L2 population:
Percent with basic skills problem:
Percent with taught learning in last 12 months:
Percent in employment:
Percent with household income below £21k:
29.2% 19.6% 11% 46% 78% 30%
highest level of qualification
0% 20% 40% 60% 80% 100%
L4+ L3 L2 <L2
social economic class
0% 20% 40% 60% 80% 100
% Managerial and professional
occupations Intermediate occupations Small employers and own account workers Lower supervisory and
technical occupations Semi-routine and routine occupations
occupational status
0% 20% 40% 60% 80% 100% F/T work
P/T work Unemployed In full-time education
Retired Incapable of work
Other
Enthusiastic and Enlightened see learning as an investment, and are likely to have done some learning recently. Nearly four -fifths of them are in work, and three-quarters have L2 or above qualifications. Most of them live in h ouseholds without children. They have very few barriers to learn ing, and are likely to take up learning where they need to at their own initiative. They are happy with their lives.
Barriers to Learning: They rarely report barriers to learning, o ther than being too busy at work.
Attitudes to Learning: Generally very positive about learning
Are likely to agree with:
“I like the idea of learning in new ways ”
“I’ve got a hidden talent that I would love to explore ”
Are likely to disagree with:
“I don ’t know where to look or who to ask about learning ” “I don ’t see any point in learning ”
Assessment:
"Enthusiastic and Enlightened are very positive about learning, and have very few barriers. They are mostly employed and well qualified and they can be expected to invest i n their training when necessary without external incentives."
Enthusiastic and Enlightened
Positive about learning:
Well above average
Happiness:
Just above average
Average no of barriers to learning:
4.2. Segment 2 - Fulfilled and Family-focused – 14.5% of population
Percentage of whole population:
Percentage of Sub L2 population:
Percent with basic skills problem:
Percent with taught learning in last 12 months: Percent in employment:
Percent with household income below £21k:
14.5% 10.6% 9% 36% 75% 26% highest level of qualification
0% 20% 40% 60% 80% 100%
L4+ L3 L2 <L2 social economic class
0% 20% 40% 60% 80% 100% Managerial and professional
occupations Intermediate occupations Small employers and own account workers Lower supervisory and
technical occupations Semi-routine and routine occupations
occupational status
0% 20% 40% 60% 80% 100% F/T work
P/T work Unemployed In full-time education
Retired Incapable of work
Other
Fulfilled and Family -focused are most likely to be women between 25 and 45 who have c hildren in their household. Three -quarters of them are working, and they are mostly well -educated, with three -quarters having L2 or above qualifications. They are positive ab out learning, but they are usually too busy because they prefer to spend their time with their families. They tend to be quite content with their lot at present.
Barriers to Learning: The main barrier reported is lack of time due to family, lack of time due to work, and to a lesser extent preferring to do other things in their spare time.
Attitudes to Learning: Generally positive about the value of lea rning and prepared to invest towards it.
Are likely to agree with:
“I like the idea of learning in new ways ”
“Taking everything into account, I am satisfied with my life at t he moment ”
Are likely to disagree with: “Learning isn ’t’ for people like me ” “I didn ’t get anything out of school ” Assessment:
“Fulfilled and Family -focused are positive about learning but they have little time to learn because of their family commitments. They tend to be younger women with children under 16 in their household. Most of them are working and well qualified. ”
Fulfilled and Family -focused
Positive about learning: Just above average Happiness:
Well above average Average no of barriers to learning:
4.3. Segment 3 - Hampered Hard Workers – 7.1% of population
Percentage of whole population: Percentage of Sub L2 population:
Percent with basic skills problem:
Percent with taught learning in last 12 months:
Percent in employment:
Percent with household income below £21k:
7.1% 4.5% 7% 41% 97% 27% highest level of qualification
0% 20% 40% 60% 80% 100%
L4+ L3 L2 <L2 social economic class
0% 20% 40% 60% 80% 100%
Managerial and professional occupations
Intermediate occupations
Small employers and own account workers
Lower supervisory and technical occupations
Semi-routine and routine occupations
occupational status
0% 20% 40% 60% 80% 100%
F/T work
P/T work
Unemployed
In full-time education
Retired
Incapable of work
Other
Hampered Hard Workers are generally positive about learning and happy with their lives. They are more likely to be men with no c hildren. A massive 97% of them are in work, and their work dominates their lives, leaving little time for learning. They are mostly well -qualified, nearly four -fifths hold L2 or above qualifications.
Barriers to learning: Nearly all of them say they are too busy a t work, and it ’s hard to get time off work for learning. A smaller proportion r eport that it is hard to pay the fees for courses, and their employer would be unwilling to support learning.
Attitudes to Learning: Generally positive about learning, and ge nerally willing to pay something towards it.
Are likely to agree with:
“I am willing to pay something towards learning that I do as an a dult” “Work tends to dominate my life at the moment ”
“If you want to succeed at work, you need to keep improving your skills”
Are likely to disagree with:
“I didn ’t get anything useful out of school ”
“Learning is only worthwhile if there is a qualification at the e nd” Assessment:
“Hampered Hard Workers are positive about learning but tend to fi nd it difficult to justify taking time away from work. Nearly all of them are in work, and most of them are well -qualified. ”
Hampered Hard Workers
Positive about learning:
Well above average
Happiness:
Just above average
Average no of barriers to learning:
4.4. Segment 4 - Looking for Learning – 4.9% of population
Percentage of whole population: Percentage of Sub L2 population:
Percent with basic skills problem:
Percent with taught learning in last 12 months:
Percent in employment:
Percent with household income below £21k:
4.9% 3.2% 13% 35% 72% 27%
highest level of qualification
0% 20% 40% 60% 80% 100%
L4+ L3 L2 <L2
social economic class
0% 20% 40% 60% 80% 100
% Managerial and professional
occupations Intermediate occupations Small employers and own account workers Lower supervisory and
technical occupations Semi-routine and routine
occupations
occupational status
0% 20% 40% 60% 80% 100% F/T work
P/T work Unemployed In full-time education Retired Incapable of work
Other
Looking for Learning are keen to learn more, but highly likely to say they don ’t know where to look for learning opportunities or that they can ’t find any locally. They are willing to pay for learning, and are generally under 45 . Three -quarters are in work, and three -quarters have L2 or above qualifications. They have several barriers to learning, and are slightly below average con tentment.
Barriers to Learning: The over -riding barrier they report is that they don ’t know where to look for learning or cannot find what they want locally. Good advice is therefore critical.
Attitudes to Learning: Generally positive about the value of lea rning, but indicate a sense of frustration at not having achieve d more. They may therefore be relatively easy to engage if their obstacles can be overcome.
Are likely to agree with:
“I see education as an investment in my future ” “I wish I had carried on in education to a higher level ”
Are likely to disagree with: “Learning isn ’t for people like me ”
“The Government should pay for all adult learning ” Assessment:
“Looking for Learning are positive about learning, but unsure wha t training to do. Nearly all of them are in work, and most of them are well -qualified. They tend to be mostly under 45. ”
Looking for Learning
Positive about learning: Just above average Happiness:
Just below average Average no of barriers to learning:
4.5. Segment 5 - Trapped on a Treadmill – 5.9% of population
Percentage of whole population: Percentage of Sub L2 population:
Percent with basic skills problem:
Percent with taught learning in last 12 months:
Percent in employment:
Percent with household income below £21k:
5.9% 5.3% 10% 49% 78% 50%
highest level of qualification
0% 20% 40% 60% 80% 100%
L4+ L3 L2 <L2 social economic class
0% 20% 40% 60% 80% 100% Managerial and professional
occupations Intermediate occupations Small employers and own account workers Lower supervisory and
technical occupations Semi-routine and routine occupations
occupational status
0% 20% 40% 60% 80% 100% F/T work
P/T work Unemployed In full-time education
Retired Incapable of work
Other
Trapped on a Treadmill are slightly negative about learning. Mos t have financial barriers to learning, as well as a number of le sser barriers. Four -fifths of them are in work and they are averagely qualified (more than two -thirds at L2 or above). However, half of them have low household incomes, and they are fairly dissatisfied with their lives. Most of them are under 45.
Barriers to Learning: They report the cost of learning as their main barrier. They also report several other barriers including: lack of confidence, lack of information about what is available, getting time off work, and arranging transport.
Attitudes to Learning: They are slightly negative about learning . They do value learning that leads to a qualification, but they feel strongly that someone else should pay for it.
Are likely to agree with:
“I don ’t have the qualifications needed to get on the courses ” “I prefer to learn in a classroom than at home ”
Are likely to disagree with:
“I am willing to pay something towards the learning I do as an ad ult” “I don ’t see the point in learning ”
Assessment:
“Trapped on a Treadmill are slightly negative about the value of learning, and have strong financial barriers to learning. Most of them are working and they have average qualifi cation levels. Their incomes are lower than most of the other “in work ” groups and they are not very happy with their lives. They are m ostly under 45. ”
Trapped on a Treadmill
Positive about learning:
Just below average
Happiness:
Well below average
Average no of barriers to learning:
4.6. Segment 6 - Older into Other Things – 11.1% of the population
Percentage of whole population:
Percentage of Sub L2 population:
Percent with basic skills problem:
Percent with taught learning in last 12 months:
Percent in employment:
Percent with household income below £21k:
11.1% 12.4% 20% 22% 66% 35%
highest level of qualification
0% 20% 40% 60% 80% 100%
L4+ L3 L2 <L2
social economic class
0% 20% 40% 60% 80% 100%
Managerial and professional occupations
Intermediate occupations
Small employers and own account workers
Lower supervisory and technical occupations
Semi-routine and routine occupations
occupational status
0% 20% 40% 60% 80% 100%
F/T work
P/T work
Unemployed
In full-time education
Retired
Incapable of work
Other
Older into Other Things are generally over 45 and are more likel y to be male and without children in the household. They are sli ghtly negative about the value of learning; and not interested in doing any themselves. They are v ery happy with their lives. Two -thirds of them are working and they are slightly less qualified than average (two -fifths are without a level 2 qualification).
Barriers to Learning: The only significant barrier is that this group are not interested in doing any learning and prefer to spe nd their time doing other things.
Attitudes to Learning: While not hostile to the idea of learning for others, they feel strongly that it is not worthwhile for th em.
Are likely to agree with: “I’m not interested in any learning ” “I’m too old to learn ”
Are likely to disagree with:
“I would find it hard to pay the fees charged for courses ” “My benefits would be cut if I did a training course ”
Assessment:
“Older into Other Things are slightly negative about learning, Th ey are not interested in doing learning themselves and are very happy with their lives. Most of them are over 45, a nd a majority are male. Around two -thirds are in work and they have slightly less than average qualifications. ”
Older into Other Things
Positive about learning:
Just below average
Happiness:
Well above average
Average no of barriers to learning:
4.7. Segment 7 - Too Late to Learn – 10.6% of the population
Percentage of whole population:
Percentage of Sub L2 population:
Percent with basic skills problem:
Percent with taught learning in last 12 months:
Percent in employment:
Percent with household income below £21k:
10.6% 17.8% 29% 26% 52% 61%
highest level of qualification
0% 20% 40% 60% 80% 100%
L4+ L3 L2 <L2
social economic class
0% 20% 40% 60% 80% 100%
Managerial and professional occupations
Intermediate occupations
Small employers and own account workers
Lower supervisory and technical occupations
Semi-routine and routine occupations
occupational status
0% 20% 40% 60% 80% 100%
F/T work
P/T work
Unemployed
In full-time education
Retired
Incapable of work
Other
Too Late to Learn are mainly over 45 and a majority are women wh o do not have children in the household. They have few barriers to learning but are slightly negative about it: Many agree that “you need qualifications to get anywhere these days ”, but they believe that it is not for people like them. Only ab out half of
them are working, and three -fifths have qualifications below L2. Over three -fifths of them have low income, but most of them are reasonably happy with their
lives, and don ’t see that learning will improve things for them.
Barriers to Learning: Around half say they have no time to learn because of their family, or because they look after elderly or disabled dependents. Otherwise no
significant barriers other than lack of interest.
Attitudes to Learning: Slightly negative, and are likely to agre e with: “I’m not interested in doing any learning ”
“Computers are confusing and make things more difficult ” “the skills you need at work can ’t be learned in a classroom ” “employers should be responsible for training their employees ”
Are likely to disagree with:
“I see education as an investment in my future ” “Work tends to dominate my life at the moment ” Assessment:
“Too Late to Learn tend to be older women. They are slightly nega tive about the value of learning but seem to
have few barriers. Only about half of them are working, and a ma jority have qualifications below L2. Despite
mostly having low incomes, they seem reasonably happy with their lives. ”
Too Late to Learn
Positive about learning:
Just below average
Happiness:
Average
Average no of barriers to learning:
4.8. Segment 8 - Sceptical but Scraping by – 5.5% of population
Percentage of whole population: Percentage of Sub L2 population: Percent with basic skills problem:
Percent with taught learning in last 12 months: Percent in employment:
Percent with household income below £21k:
5.5% 7.9% 33% 27% 75% 48%
highest level of qualification
0% 20% 40% 60% 80% 100%
L4+ L3 L2 <L2 social economic class
0% 20% 40% 60% 80% 100% Managerial and professional
occupations Intermediate occupations Small employers and own account workers Lower supervisory and
technical occupations Semi-routine and routine occupations
occupational status
0% 20% 40% 60% 80% 100% F/T work
P/T work Unemployed In full-time education
Retired Incapable of work
Other
Sceptical but Scraping by have very negative view of the value of learnin g. But interestingly, most of them report few barriers to learni ng for themselves, other than being too busy at work. A majority of them are men. Three -quarters of them are in work even though half of them do not hav e L2 or above qualifications. Half of them have below average household income. Despite these problems, they are fairly happy with their lives.
Barriers to Learning: The only significant barrier is that they are too busy at work to learn.
Attitudes to Learning: They have a generally sceptical view abou t the value of learning. They don ’t see it as an investment, don ’t consider it fun, and don ’t think it is for people like them.
Are likely to agree with:
“Work tends to dominate my life at the moment ” “Learning isn ’t for people like me ”
Are likely to disagree with:
“You need qualifications to get anywhere these days ” “I wish I had carried on in education to a higher level ”
“If you want to succeed in work, you need to keep improving skill s” “Learning is something you should do throughout your life ” Assessment:
“Sceptical but Scraping by have few barriers to learning but have a very n egative attitude towards it. They are mostly in work even though half of them do not have L2 or above qualifications. Half of them have a low income and a majority of them are men, and are fairly happy with their lives.”
Sceptical but Scraping by
Positive about learning:
Well below average
Happiness:
Average Average no of barriers to learning:
4.9. Segment 9 - Unfulfilled and Unhappy – 8.6% of population
Percentage of whole population:
Percentage of Sub L2 population:
Percent with basic skills problem:
Percent with taught learning in last 12 months:
Percent in employment:
Percent with household income below £21k:
8.6% 13.0% 22% 27% 44% 54%
highest level of qualification
0% 20% 40% 60% 80% 100%
L4+ L3 L2 <L2
social economic class
0% 20% 40% 60% 80% 100
%
Managerial and professional occupations
Intermediate occupations
Small employers and own account workers
Lower supervisory and technical occupations
Semi-routine and routine occupations
occupational status
0% 20% 40% 60% 80% 100%
F/T work
P/T work
Unemployed
In full-time education
Retired
Incapable of work
Other
Unfulfilled and Unhappy are more likely to be women. They are sl ightly negative about learning and there are many reasons preven ting them from doing any. They lack confidence in themselves, and are nervous about learni ng. Less than half of them are working and over half are withou t level two qualifications. Over half of them have low household incomes and they are the group l east likely to say they are satisfied with their lot in life.
Barriers to Learning: Lack of confidence and information about r elevant courses, health problems, transport problems and finance are all given as major obstacles.
Attitudes to Learning: They tend to think learning is a good thi ng but not for them. They are likely to think that computers are confusing, and that they didn ’t get anything out of school.
Are likely to agree with:
“You need qualifications to get anywhere nowadays ” “I wish I had carried on in education to a higher level ” “I don ’t have the confidence to learn on my own ”
Are likely to disagree with: “I don ’t see the point in learning ” Assessment:
“Unfulfilled and Unhappy are slightly negative about learning but have many barriers. Less than half of them are working and over half are without level two qualifications. They are unhappy with their lives but don ’t feel that learning could change things for them."
Unfulfilled and Unhappy
Positive about learning:
Just below average
Happiness:
Well below average
Average no of barriers to learning:
4.10. Segment 10 - Disaffected and Discouraged – 2.6% of population
Percentage of whole population:
Percentage of Sub L2 population:
Percent with basic skills problem:
Percent with taught learning in last 12 months:
Percent in employment:
Percent with household income below £21k:
2.6% 5.7% 56% 18% 54% 63%
highest level of qualification
0% 20% 40% 60% 80% 100%
L4+ L3 L2 <L2 social economic class
0% 20% 40% 60% 80% 100% Managerial and professional
occupations
Intermediate occupations Small employers and own account workers Lower supervisory and
technical occupations Semi-routine and routine occupations
occupational status
0% 20% 40% 60% 80% 100% F/T work
P/T work Unemployed In full-time education
Retired Incapable of work
Other
Disaffected and Discouraged have very negative views on the valu e of learning. They have a great many barriers to learning, espe cially language, literacy or numeracy problems. A majority of them are male, only around half of them are working, and two -thirds of the whole group have low incomes. Over half are receiving means -tested benefits. Four -fifths of them are qualified below L2, and over half have basic skills problems. Overall, they are not happy with their lives.
Barriers to Learning: Difficulties with English, literacy or num eracy may present major obstacles for nearly all of them. They a lso report many other barriers including: lack of confidence, inclination and information.
Attitudes to Learning: Generally don ’t think that learning is for them. They didn ’t get much out of school, and would lack the confidence to begin learning again, though they would prefer to learn in a classroom than at home. T hey are also likely to say that learning is only worthwhile if i t results in a qualification.
Are likely to agree with:
“I don ’t have the qualifications to get on most courses ” “I don ’t have the confidence to learn on my own ” “Learning isn ’t for people like me ”
Are likely to disagree with: “I am too busy with work to learn ”
“Taking everything into account I am satisfied with my like at th e moment ” Assessment:
“Disaffected and Discouraged have a negative perception of the va lue of learning, and they report a great many barriers to doing any. Only around half of them are working, and more than half have basic skills problems. Two -thirds have low incomes, and overall they are not very happy wit h their lives. ”
Disaffected and Discouraged
Positive about learning:
Well below average
Happiness:
Well below average
Average no of barriers to learning:
5. Using the segmentation results
5.1. Implications for policy and communications strategy
To meet the skills ambitions set out in the Leitch Review, the government will need to attract into learning people with a wide variety of attitudes and barriers to learning. However, as the chart below shows, the majority of those who are low skilled (i.e. not qualified to Level 2) are negative about learning and are likely to be hard to reach.
Results: Generalised clusters
- below L2 population
Fulfilled & Family Focussed Hampered Hard Workers
Looking for Learning Trapped on a treadmill
23.6% Enthusiastic & Enlightened
19.6%
Older into other things Too late to learn Sceptical but Scraping by
38.1%
Unfulfilled & Unhappy Disaffected & Discouraged
18.7% Low
Barriers
High Barriers
Negative about learning Positive about
learning
The ten segments have clearly differentiated attitudes and perceived obstacles to adult learning. The segments exist on an axis which ranges from segments which need no real encouragement from government to continue participation in learning to segments which have major barriers to learning and would require substantial
Segment 2 – Fulfilled and Family-focused - are positive about learning but have time constraints. Although they are quite content, if the time barrier to learning could be overcome, they might participate to a higher level. Self taught learning could be a route for this segment.
Segment 3 – Hampered Hard workers – are also time constrained, but due to work rather than family commitments. They would contribute to learning financially, but feel their employers would create obstacles. A route for this segment might be through their employers, perhaps enhancing the value of a better trained and qualified workforce.
Segment 4 – Looking for Learning – are positive about learning but have been unable to track down suitable local learning opportunities. The strategy for this segment could be to increase their awareness of local courses.
Segment 5 – Trapped on a Treadmill – are slightly negative about learning and feel that cost would be a major obstacle. They are also well below average in terms of satisfaction with their lives and so a route could be to point to sources of low cost learning which might help them get more out of their lives.
The two predominantly older segments (6 and 7) seem to have less desire to become involved in adult learning, either feeling that this has passed them by or so involved in other activities that their lives are fulfilled in that way. Segment 8 – Sceptical but Scraping by – have less barriers to learning than the other two segments, but have fairly entrenched views that learning is not for them.
Segment 1 is already accessing adult learning in a major way and probably need little encouragement to continue to do so. At the other extreme, segments 9 and 10 are likely to be very difficult segments to encourage into adult learning, although their needs are clearly considerable.
Finally, segment 10 – Disaffected and Discouraged – are very negative about learning and have lots of barriers to overcome. More than half of this segment have basic skills problems and only around half are working. Although this is a small segment, it is the one with the greatest needs regarding learning.
Annex A – NALS 2005 questions on attitudes and barriers to learning
Attitudes to learning
{Ask all}
“I am now going to read out some statements about people’s attitudes towards learning. I will then ask to what extent you agree or disagree with each.”:
“To what extent do you agree or disagree that you need qualifications to get anywhere these days:
“Agree strongly”, “Agree slightly”,
“Neither agree nor disagree”, “Disagree slightly”,
“Disagree strongly”
“To what extent do you agree or disagree that if you want to succeed at work you need to keep improving your knowledge and skills:
“Agree strongly”, “Agree slightly”,
“Neither agree nor disagree”, “Disagree slightly”,
“Disagree strongly”
“(To what extent do you agree or disagree that) employers should be responsible for training their employees:
“Agree strongly”, “Agree slightly”,
“Neither agree nor disagree”, “Disagree slightly”,
“Disagree strongly”
“Agree strongly”, “Agree slightly”,
“Neither agree nor disagree”, “Disagree slightly”,
“Disagree strongly”
“(To what extent do you agree or disagree that) learning new things is fun: “Agree strongly”,
“Agree slightly”,
“Neither agree nor disagree”, “Disagree slightly”,
“Disagree strongly”
“To what extent do you agree or disagree that the government should pay for all adult learning:
“Agree strongly”, “Agree slightly”,
“Neither agree nor disagree”, “Disagree slightly”,
“Disagree strongly”
“And I’d now like to ask about how important learning is to you personally. I’ll read out some statements people may make about the importance of learning to them in their own lives. Again, please say the extent to which you agree or disagree with each statement.”:
“To what extent do you agree or disagree with this statement. I am willing to pay something towards learning that I do as an adult:
“Agree strongly”, “Agree slightly”,
“Neither agree nor disagree”, “Disagree slightly”,
“To what extent do you agree or disagree with this statement. Learning isn’t for people like me:
“Agree strongly”, “Agree slightly”,
“Neither agree nor disagree”, “Disagree slightly”,
“Disagree strongly”
“To what extent do you agree or disagree with this statement. I didn’t get anything useful out of school:
“Agree strongly”, “Agree slightly”,
“Neither agree nor disagree”, “Disagree slightly”,
“Disagree strongly”
“To what extent do you agree or disagree with this statement. I wish I had carried on in education to a higher level:
“Agree strongly”, “Agree slightly”,
“Neither agree nor disagree”, “Disagree slightly”,
“Disagree strongly”
“To what extent do you agree or disagree with this statement. I see education as an investment in my future:
“Agree strongly”, “Agree slightly”,
“Neither agree nor disagree”, “Disagree slightly”,
“Disagree strongly”
INTERVIEWER: THIS MEANS SELF-TAUGHT LEARNING, IT DOES NOT MEAN NOT ATTENDING A COURSE WITHOUT HAVING A FRIEND JOIN THEM. “Agree strongly”,
“Agree slightly”,
“Neither agree nor disagree”, “Disagree slightly”,
“Disagree strongly”
“To what extent do you agree or disagree with this statement. I prefer to learn in a classroom rather than at home:
“Agree strongly”, “Agree slightly”,
“Neither agree nor disagree”, “Disagree slightly”,
“Disagree strongly”
“To what extent do you agree or disagree with this statement. Learning is something you should do throughout your life:
“Agree strongly”, “Agree slightly”,
“Neither agree nor disagree”, “Disagree slightly”,
“Disagree strongly”
“To what extent do you agree or disagree with this statement. I like the idea of learning in new ways such as through the internet or using CD ROMs:
“Agree strongly”, “Agree slightly”,
“Neither agree nor disagree”, “Disagree slightly”,
“Disagree strongly”
“Agree strongly”, “Agree slightly”,
“Neither agree nor disagree”, “Disagree slightly”,
“Disagree strongly”
“To what extent do you agree or disagree with this statement. I’m not interested in doing any learning:
“Agree strongly”, “Agree slightly”,
“Neither agree nor disagree”, “Disagree slightly”,
“Disagree strongly”
“…And now a few questions about yourself ”:
To what extent do you agree or disagree with this statement. I often do things on the spur of the moment:
“Agree strongly”, “Agree slightly”,
“Neither agree nor disagree”, “Disagree slightly”,
“Disagree strongly”
I’ve got a hidden talent that I would love to explore: “Agree strongly”,
“Agree slightly”,
“Neither agree nor disagree”, “Disagree slightly”,
Computers are confusing and make things more difficult: “Agree strongly”,
“Agree slightly”,
“Neither agree nor disagree”, “Disagree slightly”,
“Disagree strongly”
I don’t want responsibility; I’d rather be told what to do: “Agree strongly”,
“Agree slightly”,
“Neither agree nor disagree”, “Disagree slightly”,
“Disagree strongly”
Taking everything into account, how satisfied are you with your life at the moment: “Very satisfied”,
“Satisfied”,
“Neither satisfied nor dissatisfied”, “Dissatisfied”,
Obstacles to learning
{Ask all}
“Could I just check, apart from courses we’ve already discussed, would you have liked to have done some FURTHER training or learning during the past 12 months?”: “Yes definitely”,
“Yes maybe”, “No”
{Non-learners who did not want to do learning over the past 12 months “I’d like to ask you now about the reasons why you did not want to take part in education or training over the past 12 months?
“GIVE SHUFFLE CARDS TO RESPONDENTS. On these cards are reasons why people may not take part in education or training. Please sort the cards into two piles - the statements that apply to you, and those that do not apply to you?
{Learners who did not want to take part in any more learning over the past 12 months
“I’d like to ask you now about any reasons that may have made it difficult for you to take part in any more education or training over the past 12 months?”
“GIVE SHUFFLE CARDS TO RESPONDENTS. On these cards are reasons why people may have found it difficult to take part in any more education or training. Please sort the cards into two piles - the statements that apply to you, and those that do not apply to you
{Those who would like to have done some (more) learning in the last 12 months “I’d like to ask you now about the reasons why you did not take part in ^MORE
education or training over the past 12 months.”
- “I'm so busy with work, I don't have time to spend (on more) learning”, - “I haven't got time because of my family”,
- “I prefer to spend my free time doing things other than learning”, - “It is hard to get time off work to do any learning for my job”, - “My employer would not support my learning”,
- “I want to do some learning, but can't find any opportunities locally”, - “I know very little about the learning opportunities round here
- “I don't need to do any learning for the sort of work I want to do”, - “I don’t have time as I have to look after my children”,
- “I'm not interested in doing any learning, training or education”, - “It is hard for me to pay the fees they charge for courses”,
- “I don’t have time as I have to look after a person who is elderly, or has a long-term illness/disability”,
- “I am only willing to do learning if the fees are paid by someone else”, - “I don't have the qualifications you need to get on to most courses”, - “I have difficulties reading and/or writing”,
- “I have difficulties with English”, - “I have problems with numbers”
- “I would be worried about keeping up with the other people on the course”, - “I feel that I'm too old to learn”,
- “Most courses don't make allowances or suitable arrangements for my health problems or disability”,
- “My benefits would be cut if I did a training course”,
- “I don't know where to look, or who to ask about starting some learning”, - “I don't see the point in learning or education”,
- “I would be nervous about going back to the classroom”,
- “It's difficult for me to arrange transport to go and do some learning”, - “I don’t know what courses would be interesting or useful for me” - “I couldn’t find the training I wanted”,
Ref: DIUS Research Report 08 01
ISBN: 978 1 84478 982 5