Evidence Report 73
November 2012
Wholesale and
Wholesale and Retail
Sector Skills Assessment 2012
Authors: Phil Mosley, Gwenn Winters, Stirling Wood
Author organisations: Skillsmart Retail, Skills for Logistics, The Institute of
the Motor Industry
November 2012
i
Foreword
The UK Commission for Employment and Skills is a social partnership, led by
Commissioners from large and small employers, trade unions and the voluntary sector. Our
ambition is to transform the UK’s approach to investing in the skills of people as an intrinsic
part of securing jobs and growth. Our strategic objectives are to:
Maximise the impact of employment and skills policies and employer behaviour to
support jobs and growth and secure an internationally competitive skills base;
Work with businesses to develop the best market solutions which leverage greater
investment in skills;
Provide outstanding labour market intelligence which helps businesses and people make
the best choices for them.
The third objective, relating to intelligence, reflects an increasing outward focus to the UK
Commission’s research activities, as it seeks to facilitate a better informed labour market, in
which decisions about careers and skills are based on sound and accessible evidence.
Relatedly, impartial research evidence is used to underpin compelling messages that
promote a call to action to increase employers’ investment in the skills of their people.
Intelligence is also integral to the two other strategic objectives. In seeking to lever greater
investment in skills, the intelligence function serves to identify opportunities where our
investments can bring the greatest leverage and economic return. The UK Commission’s
third strategic objective, to maximise the impact of policy and employer behaviour to achieve
an internationally competitive skills base, is supported by the development of an evidence
base on best practice: “what works?” in a policy context.
Our research programme provides a robust evidence base for our insights and actions,
drawing on good practice and the most innovative thinking. The research programme is
underpinned by a number of core principles including the importance of: ensuring ‘relevance’
to our most pressing strategic priorities; ‘salience’ and effectively translating and sharing the
key insights we find; international benchmarking and drawing insights from good practice
abroad; high quality analysis which is leading edge, robust and action orientated; being
responsive to immediate needs as well as taking a longer term perspective. We also work
ii
Sharing the findings of our research and engaging with our audience is important to further
develop the evidence on which we base our work. Evidence Reports are our chief means of
reporting our detailed analytical work. Each Evidence Report is accompanied by an
executive summary. All of our outputs can be accessed on the UK Commission’s website at
www.ukces.org.uk
But these outputs are only the beginning of the process and we are engaged in other
mechanisms to share our findings, debate the issues they raise and extend their reach and
impact. These mechanisms include our Changing Behaviour in Skills Investment seminar
series and the use of a range of online media to communicate key research results.
We hope you find this report useful and informative. If you would like to provide any
feedback or comments, or have any queries please e-mail info@ukces.org.uk, quoting the
report title or series number.
Lesley Giles
Deputy Director
iii
Table of Contents
Executive Summary ... xi
1
Introduction ... 1
1.1 Purpose of report ... 1
1.2 Defining the sector ... 2
1.3 Sector Skills Councils ... 4
1.3.1 Skillsmart Retail ... 4
1.3.2 Skills for Logistics (SfL) ... 5
1.3.3 The Institute of the Motor Industry (IMI) ... 5
1.4 Summary of methodology ... 5
2
Current performance of sector ... 7
Chapter Summary ... 7
2.1 Economic performance... 7
2.1.1 Productivity ... 8
2.1.1.1 Retail productivity ... 8
2.1.1.2 Wholesale productivity ... 11
2.1.1.3 Automotive retail productivity ... 12
2.1.2 Gross Value Added (GVA) ... 13
2.1.3 Establishment numbers ... 16
2.1.4 Business start-ups and closures ... 21
2.2 Employment ... 22
3
The workforce ... 26
Chapter Summary ... 26
3.1 The jobs people do ... 27
3.1.1 Sector occupations ... 27
3.2 Working patterns ... 31
3.2.1 Working hours ... 31
3.2.2 Employment status ... 34
3.2.3 Permanent or temporary worker status ... 36
3.3 Workforce characteristics ... 37
3.3.1 Gender of workforce ... 38
3.3.2 Age of workforce ... 40
iv
3.3.4 Employee country of origin ... 45
4
Demand for, and value of, skills ... 47
Chapter Summary ... 47
4.1 Nature of skills used ... 48
4.2 Value of skills ... 56
4.2.1 High Potential Working ... 56
4.2.2 The extent of training provided and the proportion of the workforce receiving training ... 59
4.2.3 Training by occupation ... 69
4.2.4 Type of training provided ... 70
4.2.5 Barriers to training ... 71
4.3 Skills and sectoral performance ... 72
5
Extent of skills mis-match ... 73
Chapter Summary ... 73
5.1 Extent and nature of vacancies ... 74
5.1.1 Level of vacancies ... 74
5.1.2 Nature of vacancies ... 79
5.1.2.1 Hard-to-fill vacancies and skill-shortage vacancies ... 84
5.1.3 Recruitment ... 88
5.1.4 Staff retention ... 89
5.2 Extent and nature of skills issues ... 94
5.2.1 Extent of skills gaps ... 94
5.2.1.1 Causes of skills gaps ... 96
5.2.1.2 Consequences of skills lacking ... 97
5.3 Extent of under-employment ... 100
5.4 Impact of mismatches ... 101
5.5 Wages ... 101
5.6 Migration ... 102
5.7 Skills deficiencies hampering growth ... 102
6
Drivers of change and their skills implications ... 104
Chapter Summary ... 104
6.1 Drivers of change ... 105
6.2 Regulation and governance ... 106
6.3 Demographic change ... 106
6.4 Environmental change ... 107
v
6.6 Technological change ... 109
6.6.1 Self-service customer checkouts ... 109
6.6.2 Online... 110
6.7 Values and identities ... 111
6.8 Consumer demand ... 111
6.9 Scale of drivers ... 112
6.10 Differences in drivers across the four nations ... 116
7
Future skills needs ... 117
Chapter Summary ... 117
7.1 Drivers ... 118
7.1.1 Regulation and governance ... 118
7.1.2 Demographic change ... 119
7.1.3 Environmental change ... 119
7.1.4 Economics and globalisation ... 119
7.1.4.1 Expenditure ... 119
7.1.5 Technological change ... 120
7.1.6 Values and identities ... 120
7.1.7 Consumer demand ... 121
7.2 Impact on employment and skills ... 122
7.2.1 Workplace occupation projections ... 122
7.2.2 Replacement demand ... 126
7.3 Future occupational profile ... 127
7.3.1 Retail ... 127
7.3.2 Wholesale ... 128
7.3.3 Automotive retail ... 128
7.4 Future skill needs ... 129
7.4.1 Retail ... 130
7.4.2 Wholesale ... 131
7.4.3 Automotive retail ... 132
8
Priority areas for action ... 134
Chapter Summary ... 134
9
Bibliography ... 140
vi
Tables, figures and charts
Table 2.1: Annual sales turnover in wholesale and retail sub-sectors 2010 ... 8
Figure 2.1: Productivity KPIs commonly identified at industry level 2010 ... 9
Chart 2.1: Total factor productivity growth in retailing - 1970-2007 ... 11
Table 2.2: GVA by nation (£m in current basic prices) 2008 – whole economy by sector ... 13
Table 2.3: GVA by English region (£m in current basic prices) 2008 – whole economy by sector ... 14
Table 2.4: UK GVA by sector (£m in current basic prices) 1999-2008 – whole economy ... 14
Table 2.5: Estimated workplace gross value added per employee job at current basic prices, 2009 ... 15
Table 2.6: GVA per employee in UK wholesale and retail sub-sectors 2010 ... 16
Table 2.7: Number of establishments by sector and nation 2010 – whole economy... 17
Table 2.8: Number of establishments by sector and English region 2010 – whole economy17 Table 2.9: Number of establishments in wholesale and retail sub-sectors 2010 ... 18
Table 2.10: Number of establishments by sector 2006-2010 – all economy ... 18
Table 2.11: Size of establishment by sector 2010 – all economy... 19
Table 2.12: Number of establishments with between 2-9 employees in wholesale and retail sub-sectors 2010 ... 20
Table 2.13: Size of establishments by nation 2010 – all economy ... 20
Table 2.14: Size of establishments by nation 2010 – wholesale and retail sector ... 20
Table 2.15: Business (enterprise) start-ups and closures by sector 2009 – all economy ... 21
Table 2.16: Business (enterprise) start-ups and closures 2009 – wholesale and retail sub-sectors ... 22
Table 2.17: Total employment by sector and nation 2010 – whole economy ... 22
Table 2.18: Sector employment by sub-sector 2010 ... 23
Table 2.19: Total employment by sector within region 2010 – whole economy ... 23
Table 2.20: Total employment by sector 2002-2010 – whole economy ... 24
Table 2.21: Employment by sector by European nation 2008 ... 25
Table 3.1: Employment by occupation by nation 2010 – whole economy ... 27
Table 3.2: Largest occupational groups 2010 – whole economy ... 28
Table 3.3: Employment by occupation 2010 – wholesale and retail sector ... 28
Chart 3.1: Working status profile 2010 - UK all economy vs. wholesale and retail sector .... 29
Table 3.4: Employment by sub-sector occupation 2010 ... 30
Table 3.5: Largest occupational groups 2010 – wholesale and retail sector ... 30
Table 3.6: Working hours by sector 2010 – all economy ... 31
Chart 3.2: Working status profile 2010 - UK all economy vs. wholesale and retail sector .... 32
Table 3.7: Hours worked by sub-sector 2010 ... 33
Table 3.8: Working hours by sector 2010 – all economy by sector ... 34
Table 3.9: Employment status by sector 2010 – all economy ... 34
Chart 3.3: Employee status profile 2010 - UK all economy vs. wholesale and retail sector . 35 Table 3.10: Employment status by sub-sector 2010 ... 35
vii
Table 3.12: Permanent and temporary employees by sector 2010 – all economy ... 37
Table 3.13: Permanent and temporary employees by sub-sector, 2010 ... 37
Table 3.14: Employment by gender and nation 2010 – all economy ... 38
Table 3.15: Employment by gender and nation 2010 – wholesale and retail sector ... 38
Table 3.16: Employment by gender by sub-sector, 2010 ... 39
Table 3.17: Gender profile by broad occupational group 2010 – all occupations vs. wholesale and retail sector ... 39
Table 3.18: Age profile of workforce by nation 2010 – all economy ... 40
Table 3.19: Age profile of workforce 2002-2010 – all economy ... 40
Table 3.20: Age profile of workforce by nation 2010 – wholesale and retail sector ... 41
Table 3.21: Age profile of workforce 2002-2010 – wholesale and retail sector ... 41
Chart 3.4: Age profile of workforce 2010 - UK all economy vs. wholesale and retail sector 42 Table 3.22: Employment by age profile by sub-sector 2010 ... 42
Chart 3.5: Age profile of workforce 2010 – UK whole economy vs. wholesale and retail sub-sectors ... 43
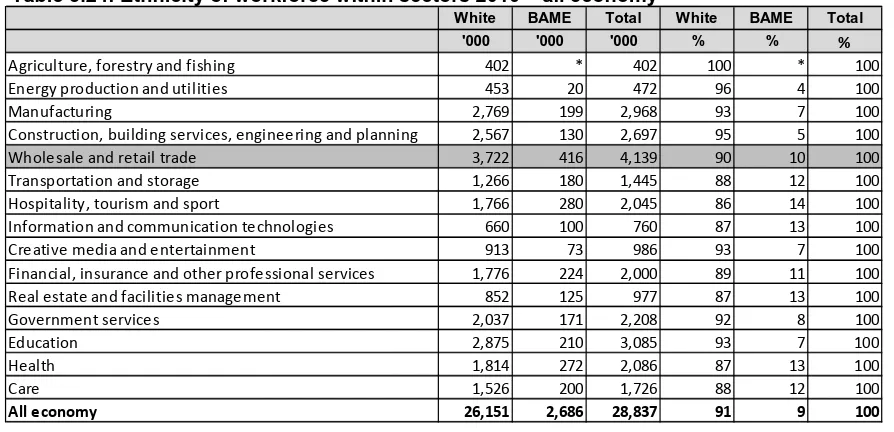
Table 3.23: Ethnicity of workforce by nations 2010 – all economy ... 43
Table 3.24: Ethnicity of workforce within sectors 2010 – all economy ... 44
Table 3.25: Ethnicity of workforce 2002-2010 – wholesale and retail sector ... 44
Table 3.26: Employment by ethnic profile by sub-sector 2010 ... 45
Table 3.27: Employment by country of birth and nation 2010 – all economy ... 45
Table 3.28: Employment by country of birth and sector 2010 – all economy ... 46
Table 3.29: Employment by origin of birth by sub-sector 2010 ... 46
Table 4.1: Summary of the nature of skills by occupation within the wholesale and retail sector ... 48
Table 4.2: Qualification profile of workforces by sector 2010 – all economy ... 49
Chart 4.1: Qualification profile of workforce 2010 - UK all economy vs. wholesale and retail sector ... 49
Table 4.3: Qualification levels by nation 2010 – all economy ... 51
Table 4.4: Qualification levels by nation 2010 – wholesale and retail sector ... 51
Chart 4.2: Qualification profile of workforce by nation 2010 - UK all economy vs. wholesale and retail sector ... 52
Table 4.5: Qualification levels 2002-2010 – all economy ... 52
Table 4.6: Qualification levels 2002-2010 – wholesale and retail sector ... 53
Table 4.7: Qualification profile 2010 – wholesale and retail sub-sector ... 53
Table 4.8: Managers and professionals without Level 4 or higher qualifications by nation 2010 – all economy by sector ... 54
Table 4.9: Managers and professionals without Level 4 or higher qualifications 2002-2010 - all economy... 55
Table 4.10: Managers and professionals without Level 4 or higher qualifications 2002-2010 – wholesale and retail sector ... 55
Chart 4.3: Qualification profile of managers and professionals with a Level 4 2002-2010 - UK all economy vs. wholesale and retail sector ... 55
viii
Table 4.12: Extent to which employees have variety in their work by sector 2011 – all economy
... 57
Table 4.13: Extent to which employees have discretion over how they do their work by sector 2011 – all economy ... 58
Table 4.14: Extent to which employees have access to flexible working by sector 2011 by sector– all economy ... 58
Table 4.15: Employers providing training by sector 2011 – all economy ... 60
Table 4.16: Employees receiving training by sector 2011 – all economy ... 61
Table 4.17: Employers providing training (per cent) by European nation, 2005 ... 62
Table 4.18: Hours in continuous vocational training courses per employee by European nation, 2005 ... 64
Table 4.19: Percentage of employees receiving training in past 4 weeks for all nations by sector 2010 – all economy ... 65
Table 4.20: Percentage of employees receiving training in past 4 weeks by sector 2002-2010 – all economy ... 66
Table 4.21: Percentage of employees receiving training in past 13 weeks by nations and sector 2010 – all economy ... 67
Table 4.22: Percentage of employees receiving training in past 13 weeks by sector 2002-2010 – all economy ... 68
Table 4.23: Training received by employees by sub-sector 2010 ... 68
Table 4.24: Employers providing training to employees by occupational group 2011 – wholesale and retail sector ... 69
Table 4.25: Employees receiving training by occupational group 2011 – whole economy vs. wholesale and retail sector ... 69
Table 4.26: Type of training funded or arranged for employees 2010 – all economy vs. wholesale and retail sector ... 70
Table 4.27: Barriers to training 2011 – wholesale and retail sector ... 71
Table 5.1: Employers with vacancies, hard-to-fill vacancies and skills shortage vacancies by sector – all economy ... 74
Chart 5.1: Employers who have a hard-to-fill/skills shortage vacancy 2011 – UK all economy vs. wholesale and retail sector ... 75
Table 5.2: Employers with vacancies, hard-to-fill vacancies and skills shortage vacancies by nation by sector 2011 ... 76
Table 5.3: Profile of vacancies by sector 2011 – all economy ... 77
Table 5.4: Profile of vacancies by occupation 2011 – wholesale and retail sector ... 78
Table 5.5: Profile of vacancies by nation by sector 2011 – all economy ... 78
Chart 5.2: Vacancy profile by nation 2011 - UK all economy vs. wholesale and retail sector79 Table 5.6: Vacancies reported by employers by occupation by nation 2011 – all economy 79 Table 5.7: Employers reporting vacancies by occupation by nation 2011 – wholesale and retail sector ... 80
Table 5.8: Skills lacking in skills shortage vacancies by nation 2011 – all economy ... 81
Table 5.9: Skills lacking in skills shortage vacancies 2011 – wholesale and retail sector ... 82
Figure 5.1: Key customer service skills in the wholesale and retail sub-sectors ... 83
Table 5.10: Causes of hard-to-fill vacancies by nation 2011 – all economy ... 84
Table 5.11: Causes of hard-to-fill vacancies by nation 2011 – wholesale and retail sector .. 85
ix
Table 5.13: Impact of hard-to-fill vacancies by nation 2011 – wholesale & retail sector ... 86
Table 5.14: Measures taken by employers to overcome hard-to-fill vacancies by nation 2011 – all economy ... 87
Table 5.15: Measures taken by employers to overcome hard-to-fill vacancies – wholesale and retail sector ... 87
Table 5.16: Recruitment of young people by sector and nation over past three years 2011 – all economy... 88
Table 5.17 Employers with retention problems by sector and nation 2011 ... 89
Table 5.18: Reasons for retention problems by nation 2011 – all economy ... 90
Table 5.19: Reasons for retention problems by nation 2011 – wholesale and retail sector . 91 Table 5.20: Measures taken by employers to overcome retention problems by nation 2011 – all economy... 91
Table 5.21: Measures taken by employers to overcome retention problems by nation 2011 – wholesale and retail sector ... 92
Table 5.22: Impact of retention difficulties by nation 2011 – all economy ... 93
Table 5.23: Impact of retention difficulties by nation 2011 – wholesale and retail sector .... 93
Table 5.24: Employers and employees with skills gaps by sector 2011 – all economy ... 94
Table 5.25: Employers and employees with skills gaps by nation 2011 – wholesale and retail sector ... 95
Chart 5.3: Employers and employees with skills gaps by nation 2011 – UK whole economy vs. wholesale and retail sector ... 95
Table 5.26: Skills gaps by occupation 2011 – wholesale and retail sector ... 96
Table 5.27: Causes of skills gaps within nations 2011 – all economy ... 96
Table 5.28: Causes of skills gaps within nations 2011 – wholesale and retail sector ... 97
Table 5.29: Consequences of skills gaps by nation 2011 – all economy ... 98
Table 5.30: Consequences of skills gaps 2011 – wholesale and retail sector ... 98
Table 5.31: Steps employers have taken to overcome skills gaps by nation 2011 – all economy ... 99
Table 5.32: Steps employers have taken to overcome skills gaps 2011 – wholesale and retail sector ... 99
Table 5.33: Extent to which workforce is over-qualified and over-skilled by sector 2011 – all economy... 100
Table 5.34: Average hourly wage by sector 2008-2010 – all economy ... 101
Table 5.35: Employee pay per hour by sub-sector 2012 ... 102
Figure 6.1: The seven drivers for skills change in the labour market ... 105
Table 6.1: Top ten global retail and wholesale companies, 2010... 108
Table 6.2: Summary of wholesale and retail sector main drivers ... 113
Table 7.1: Workplace job growth by occupation 2010-2020 – whole economy ... 122
Table 7.2: Workplace job growth by occupation 2010-2020 - wholesale and retail sector . 123 Table 7.3: Workplace job growth by occupation in England 2010-2010 - wholesale and retail sector ... 124
Table 7.4: Workplace job growth by occupation in Scotland 2010-2020 - wholesale and retail sector ... 124
x
Table 7.6: Workplace job growth by occupation in Northern Ireland 2010-2020 - wholesale and
retail sector ... 125
Table 7.7: Replacement demand 2010-2020 - wholesale and retail sector ... 126
Figure 7.2: What needs to change? Retail’s solution ... 128
Table 8.1: Sector priorities ... 138
Table 10.2: Breakdown of interviews conducted by market and sector 2010 ... 155
xi
Executive Summary
The UK wholesale and retail sector is large and relatively homogeneous. There is minimal
disparity either in its geographical concentration or in the type of skills required for delivery
across the whole of the footprint; including wholesale, retail, rental trade, automotive sales
and servicing.
Current performance of sector
In total the wholesale and retail sector generated UK sales turnover of £1,211 billion in
2010 and contributes 12 per cent of total UK gross value added (GVA), giving it a
ranking of third out of 15 sectors. With regard to productivity retail performs well against
the majority of other countries’ sectors.
The sector has 4.1 million employees (14 per cent of all UK employment) working in just
over 509,000 outlets (20 per cent of all UK establishments). Over two-thirds of
employment is in the retail sector and 84 per cent of sector employment is in England.
There has been a five per cent decrease, between 2002 and 2010, in the level of
employment in the sector (a decrease of 228,000 people). This reduction can be
attributed in part to the current challenging economic conditions and the natural ebb and
flow of openings and closures in the sector. Other contributory factors to change across
the sector include increasing productivity, technological changes and innovation affecting
how and where retail occurs, and competition at home and from abroad.
The workforce
Just over a third (1.6 million workers) of all employment in the sector is in one
occupational group - sales and customer service roles. This group is the largest four-digit
Standard Occupational Code unit group in the UK economy (accounting for four per cent
of total employment). The second largest occupational group, a fifth of all employment in
the sector, is managers and senior officials (828,000 employees).
The majority of employment in the sector is full-time (62 per cent) which is lower than the
all economy average (73 per cent). The majority of employment (90 per cent) consists of
employees (rather than the self-employed) working in permanent roles (96 per cent);
both figures being slightly higher than the all economy average. A quarter of employees
within the sector are aged under 25, significantly higher than the average for the UK
xii
Around two-thirds of the sector’s workforce has a Level 2 or higher qualification (lower
than the all economy average of 78 per cent) and nearly two-thirds of sector managers
do not have a Level 4 qualification (similar to the all economy average of 64 per cent).
A characteristic of the sector, and the retail sub-sector in-particular, is that it experiences
higher than the UK average labour turnover (churn) rates.
Demand for, use of and value of skills
The greatest number of roles within the sector require an intermediate skills level (Levels
2/3). Others require intermediate / higher skills levels, such as senior official and
managerial positions. For the largest single occupation in the sector, the sales and
customer service role, there is no mandatory skills requirement for entry into the role.
According to the Employer Skills Survey 2011, nearly three-fifths of employers in the
sector provided training to their employees in the previous year, whilst a half of
employees received some form of training. A considerable amount of training in the
sector is completed on-the-job, relating to job or role specific training, as opposed to
formal away-from-the-workplace qualification based training.
Extent of current skills mis-match
Approximately 51,000 sector employers indicated that they had at least one vacancy –
the largest number of employers with vacancies of any of the 15 sectors. Just over
95,000 vacancies were reported by sector employers – also the largest volume of
vacancies of any sector. Over half (55 per cent) of these vacancies were in sales and
customer service roles.
The sector has recruited an estimated 121,000 young people into employment over the
past three years, approximately double the amount of any other sector.
Approximately 72,000 sector establishments (15 per cent of the total) indicated that they
had skills gaps with approximately 300,000 of sector employees (six per cent) affected
by a lack of proficiency.
Specific skills identified as being lacking across the sector were: job-specific skills;
customer service skills; team working and planning and organisation skills. The sector’s
skills gaps occur most often in sales and customer service roles. The main reasons for
the skills gaps are that employees are new to the role and that training is either on-going
or partially completed. The main consequence of employee skills gap is the increased
xiii
The area of technology, especially online expansion, is the main skill area that needs
improving on current use and the development of new users across the sector.
Drivers of change and their future skills implications
The sector is projected to see 1.9 million job openings during the period 2010 to 2020
(167,000 new jobs and 1.8 million replacement jobs).
The main drivers of change affecting the sector are:
New regulations affecting the need for compliance training and increasing the skills
requirement
The changing UK demography, with an increasing aged population and a reduced
number of young people, affecting the pool of people that the sector can draw upon for
its core workforce
Reducing the carbon emission within the sector remains an important issue
Globalisation, especially of the retail sub-sector, increases pressures on the logistics
supply chain whilst in the UK the challenging economic climate means there are very few
new large-scale developments in the pipeline
The impact technology can have on the delivery of products within the sector
The ability of the sector to match consumer demand for products and services through
its ability to deliver customer service excellence to develop loyalty and return business.
Priority Areas for Action
The main priorities for the sector can be seen to be:
Attracting new entrants with the right skills into the sector in both customer service roles
and as the managers/leaders of the future
Developing and retaining staff
Improving customer service skills
1
1 Introduction
1.1
Purpose of report
The aim of this report is to provide authoritative labour market intelligence (LMI) for the
wholesale and retail sector to inform the strategic decision-making of national governments
in the development of employment and skills policy. It is one of 15 UK Sector Skills
Assessment (SSA) reports produced by Sector Skills Councils1 and the UK Commission for
Employment and Skills (UKCES).
SSAs combine top-down data from official sources with bottom-up sectoral intelligence to
provide a consistent, comparable and rich understanding of the skills priorities within sectors
across the four UK nations. The reports have been produced to a common specification
(developed by the UKCES in consultation with the four UK governments) and follow a
consistent structure.
Reports have been produced for the following sectors of the economy:
Agriculture, forestry and fishing
Energy production and utilities
Manufacturing
Construction building services, engineering and planning
Wholesale and retail trade
Transportation and storage
Hospitality, tourism and sport
Information and communication technologies
Creative media and entertainment
Financial, insurance and other professional services
Real estate and facilities management
Government
Education
Health
1
2
Care.
The reports contain intelligence on sectors and sub-sectors of particular interest to the four
UK governments. As each nation has different ‘key sectors’ that are defined in different
ways, it has not been possible to define the SSA sectors in a way that matches precisely the
key sectors identified by each nation government. Therefore, as far as possible, data has
been reported so that it can be aggregated to produce an overall picture for key sectors of
interest. In some cases this will involve gathering information from more than one SSA
report.
The reports are designed to provide sectoral intelligence at a relatively broad level for
strategic decision-making purposes. Whilst they do contain some sub-sectoral and
occupational intelligence, further intelligence at a more granular level may be available from
individual Sector Skills Councils.
In addition to the main UK report, executive summaries have been produced for Scotland,
Wales and Northern Ireland. The UK reports contain information on key regional variations
between the four UK nations and within England where appropriate (for example if sectoral
employment is focused in a particular geographic area). However, the reports are not
designed to provide a comprehensive assessment of sectoral skills issues beyond the
national level.
1.2
Defining the sector
The UK wholesale and retail sector is large and relatively homogeneous. There is minimal
disparity in either in its geographical concentration or in the type of skills required for delivery
across the whole of the footprint. This includes both generic and specific skill sets required in
the sub-sectors of wholesale, retail, automotive sales and servicing and rental trade.
The three areas of this collaborative report are specified below:
The retail part of the footprint constitutes the whole of Skillsmart Retail’s footprint and is
defined by SIC 2007 codes 47.1 – 47.9 (excluding 47.3 retail sales of automotive fuel in
specialised stores) as follows:
Retail sales in non-specialised stores (e.g. supermarkets and department stores)
Retail sales in specialised stores (e.g. butchers, greengrocers, fishmongers and
tobacconists)
3
Retail sales of new goods in specialised stores (e.g. stores selling textiles, clothing,
books, electrical household appliances, furniture and lighting)
Retail sales of secondhand goods (e.g. charity shops)
Retail sales not in store (e.g. catalogue and mail order sales, online and via stalls and
markets).
The function of retail within the UK economy can be described “as providing a vital link
between production and consumption” (Burt and Sparkes 2002).
The wholesaling section of the footprint is part of Skills for Logistics footprint2. This section
is defined by SIC 2007 codes 46.1 – 46.9 as follows:
Wholesale on a fee or contract basis
Wholesale of agricultural raw materials and live animals (e.g. grain, animal feed, flowers,
plants, animals, skins and leather)
Wholesale of food, beverages and tobacco
Wholesale of household goods (e.g. textiles, clothing, footwear, electrical household
appliances, china, glassware, furniture, carpets, lightening equipment, perfume and
cosmetics)
Wholesale of information and communication equipment (e.g. computers and software,
electronic and telecommunications equipment and parts)
Wholesale of other machinery, equipment and supplies (e.g. agriculture machinery,
machine tools, mining, construction and civil engineering machinery, office furniture and
machinery)
Other specialised wholesale (e.g. solid, liquid and gaseous fuels, metals, wood, chemical
products, waste and scraps)
Non-specialised wholesale trade
Wholesaling activities involve selling either to retailers, or to industrial, commercial,
institutional and professional users. Two types of wholesalers can be differentiated:
wholesalers acting on a fee or contract basis (SIC 46.1), who charge only for their services
as intermediaries and own-account wholesalers, who buy and resell products (Pi Soler
2004). Wholesalers may also retain design and manufacture functions.
2
4
The Institute of the Motor Industry covers the automotive sales and services section of the
footprint as defined by SIC 2007 codes 45.1 – 45.4 and 77.1 as follows:
Retail sales of motor vehicles
Maintenance and repair of motor vehicles
Wholesale and retail sales of motor vehicle parts and accessories
Retail sale, maintenance and repair of motorcycles and related parts and
accessories
The renting and leasing of motor vehicles and trucks
The function of automotive retail sales is all of the activities of automotive businesses
downstream from the manufactured products of the motor industry, i.e. all activities related
to the selling, maintenance and rental/leasing of all UK vehicles. This includes all vehicle
types and their parts, including not only cars, but also motorcycles, commercial vehicles
(e.g. vans and trucks) and passenger service vehicles (buses and coaches).
1.3
Sector Skills Councils
The three Sector Skills Councils (SSC) who represent the employers highlighted within this
report are:
1.3.1 Skillsmart
Retail
Skillsmart Retail is the Sector Skills Council for Retail (www.skillsmartretail.com).
Part-funded by Government and led by retailers, we aim to be the recognised authority on
retailers’ skills needs and priorities. Our mission is to drive excellence in retail skills by:
To act as a catalyst for increasing investment in skills to improve productivity and
profitability of retail
To set industry-wide standards for retail skills and career paths to
enhance the reputation of retail careers
To deliver products and services which are fit for purpose and accessible to all
To operate a sustainable business that promotes continuous professional development
5
1.3.2 Skills for Logistics (SfL)
Skills for Logistics (SfL) is the Sector Skills Council for the UK’s freight logistics and
wholesaling sector (www.skillsforlogistics.org). SfL works alongside companies in the UK
that are involved in moving, handling and storing and the wholesaling of goods.
SfL’s ambition is to “open doors so that logistics skills potential can be unleashed enabling
people and organisations to do amazing things”. This drives our vision “to deliver the best
skilled logistics workforce in the world”.
1.3.3 The Institute of the Motor Industry (IMI)
As the professional body, the IMI represents individuals working either in the automotive
industry or allied sectors (www.motor.org.uk). The IMI recognises people’s professionalism
by providing an industry benchmark. Membership is awarded on the basis of an individual’s
qualifications, skills and experience.
As the Sector Skills Council, it represents over 80,000 businesses, employing over 500,000
individuals working in the automotive retail sector, developing and maintaining National
Occupational Standards, Apprenticeships and qualifications. The IMI is also the governing
body of the Automotive Technician Accreditation (ATA) and Automotive Management
Accreditation (AMA) schemes.
1.4
Summary of methodology
This report combines top-down data with bottom-up intelligence to provide a rich
assessment of sectoral skills priorities that is consistent and comparable with assessments
produced for other sectors of the economy.
Three main types of information have been drawn on in the preparation of this report:
Economy-wide quantitative data from core labour market information sources (such as
the Labour Force Survey and the UK Commissions’ Employer Skills Survey)
Sectoral, sub-sectoral and occupational specific quantitative data generated by SSCs /
sector bodies and others (including Government departments and agencies, academics
and professional associations)
6
To ensure consistency and comparability across all 15 SSA reports, data from core labour
market information sources was centrally collected, processed and formatted. It was then
distributed by the UKCES on to SSCs / sector bodies for inclusion within the reports. This
data was quality assured by contractors, the UK Commission and by SSCs. To meet
consistency requirements, sub-sector analysis of data from core sources has primarily been
undertaken at a 2-digit Standard Industrial Classification (SIC) code level (or by combining
2-digit SIC codes where appropriate). Data from core sources has been supplemented
within the report with data from sector specific sources.
Each of the SSCs within this report supplement the core labour market information by
commissioning sector-specific surveys (quantitative and/or qualitative). This is necessary to
fill gaps in the information to achieve a representative sub-sector sample (especially within
either nation surveys or specific work on occupations).
The report also draws on qualitative research that has been undertaken to explore sectoral
skills issues in more detail. Qualitative research with small samples of employers (and
others), most commonly through interviews and focus groups, seeks to provide rich and
detailed understanding and insight, rather than measurement. Samples tend to be designed
to be broadly representative of the wider population, to gather a range of views.
In terms of skills research with employers, size and sector tend to be key drivers of demand
and therefore these are usually the main characteristics that are taken into account when
designing samples.
The report synthesises and contextualises information from the sources identified above
and, by undertaking rigorous analysis, turns the information into intelligence.
Further information
Further methodological information is provided within Chapter 10 Technical Appendix. This
7
2
Current performance of sector
Chapter Summary
In 2008 the sector contributed 12 per cent of total UK GVA. Between 1999 and 2008,
there has been approximately a 50 per cent increase in the sector’s overall GVA in
current price terms. The percentage contribution of the sector to the UK economy over
this period has remained comparatively stable at around 12 per cent.
The sector contributes £33,000 per employee job to the UK economy (2009). This figure
is somewhat lower than the all economy average.
The sector operates out of just over 509,000 outlets, representing 20 per cent of all UK
establishments. The majority of other sectors have less than half the number of
establishments as wholesale and retail, the only exception being construction.
84 per cent of sector establishments are based in England.
Whilst the number of establishments in the sector has contracted over the past five years
there is still a high level of business churn in the sector. Compared with other sectors it
had the highest number of business start-ups and second highest number of business
closures in 2009.
Three-quarters of all sector establishments (76 per cent) have fewer than ten employees
which is above the all economy average (74 per cent).
14 per cent of all UK employment lies within the sector (4.1m employees) and it is the
largest of all 15 SSA sectors by over one million employees.
The following section looks at the dynamics of the wholesale and retail sector in terms of
economic performance, establishment and employment numbers.
2.1
Economic performance
The wholesale and retail sector is a vitally important part of the UK economy. The Office for
National Statistics (ONS 2010) highlighted that in the 2010 provisional data, the annual
[image:22.595.56.549.64.560.2]turnover of the three sub-sectors within the UK economy was £1,211 billion as shown in
8
Table 2.1: Annual sales turnover in wholesale and retail sub-sectors 2010
Source: Office of National Statistics, 2010
2.1.1 Productivity
A key variable in the assessment of the economic performance of a sector is productivity. A
variety of measures and sources can be used to develop our understanding in this area.
2.1.1.1 Retail
productivity
Research commissioned by Skillsmart Retail (Productivity and Skills in Retailing, Oxford
Institute of Retail Management, 2010) shows that the link between productivity and
economic growth within the sector at the macro-level can broadly be attributed to one of two
approaches adopted by retailers:
A ‘low road’ approach involving a mix of intensive production practices - a low skilled, low
wage workforce, poor working and employment conditions, cost-cutting and poor or
absent labour relations and social support
A ‘high road’ approach involving the reinforcement of high quality service, good
employment conditions and wages, good social support and high skill levels.
The retailer’s core offer will affect/influence which ‘road’ will be chosen. However, many
retailers either fall between the two roads model or show that the ‘low road’ can be most
effective. Therefore, across the UK retail sector no one model fits all.
Retailers break these macro-level productivity issues into three ‘pillars of productivity’ –
product, place and people. Within these, some retailers, but not all, identify key efficiency
measures and drivers for the business. The 2010 productivity indicators are shown in Figure
2.1 overleaf.
Sales turnover (£ bn) %
Retail 332 27
Wholesale 746 62
Automotive retail 133 11
9
Figure 2.1: Productivity KPIs commonly identified at industry level 2010
Source: Investec, 2010
The ‘three pillars’ of productivity have their associated metrics, alongside a small number of
other financial measures. The Oxford Institute of Retail Management’s research with
retailers evidenced that many new measures of labour productivity had been introduced and
that the use of metrics was more widespread:
Five years ago, we only measured store/labour cost ratios… Now, mainly in terms of the big cost heads – store labour, occupancy costs (because these are space related we usually measure this in terms of sales), distribution and picking costs, stockturn. More recently we have started to think about overall HO costs as a proportion of sales. (UK clothing retailer)
Many UK retailers are now take a much more rigorous and systematic approach to thinking
about productivity improvements. This could signal the start of a much more pervasive
‘productivity mindset’ and an increasing professionalism within the sector.
It’s more of a philosophy. You’re always trying to have a look and see where you can do things more efficiently. (UK multichannel retailer)
Some of retail’s largest businesses have already had productivity as a key mantra, with the
10
[Our] change productivity programme … is now in its 14th year. Step-change is constantly identifying projects to improve the way we do things – in our stores, distribution centres and offices. The aim is to make everything we do ‘better for customers, simpler for staff and cheaper for Tesco’ and in some cases, projects are known as far as five years ahead of expected completion. This year we are on track to complete a global programme that will deliver savings of £800m – including savings of some £550m in the UK – investing most of these savings back into our offer for customers. (Tesco plc, Interim Results, 5th October 2010).
In models of this kind, there is often a ‘ratchet’ effect anticipated through the setting of
productivity targets in which firms have an expectation of consistent gains to be made on an
annual basis:
We have a productivity improvement goal each year that is a fairly arbitrary, top-down fixed percentage of our cost base, which we aim to reduce each year. (UK food retailer)
Further areas of growth within the productivity metrics, as evidenced in the research, are the
growing focus on ‘softer’ customer service and customer satisfaction skills.
One of the ways to gauge productivity is through Gross Value Added (GVA) measures – see
2.1.2, while another way is by factor productivity growth, commonly known as Total Factor
Productivity (TFP). This measure accounts for the portion of output not explained by the
amount of inputs used in production. As such, its level is determined by how efficiently and
intensely the inputs are utilised in production (Comin 2006) – a combination of capital and
technical change as well as labour. TFP can be used to illustrate economic fluctuations and
economic growth within sectors. However, neither of these measures allows for a ‘perfect’
picture to be displayed of productivity, but assessing the two measures allows for an
11
Chart 2.1: Total factor productivity growth in retailing - 1970-2007
Source: EU KLEMS Growth & Productivity Accounts, 2008
Chart 2.1 indicates that the UK retail sector lies second, in terms of factor productivity,
behind the USA retail sub-sector. A number of factors could account for this difference.
These include the challenge of changing labour intensive activities into technologically
advanced activities, e.g. self-service checkouts, and the result of regulation and institutional
intervention. This can be evidenced from a quote by the McKinsey Global Institute (2002).
A regulatory environment that allows the expansion of more productive modern supermarkets and convenience stores raises productivity because larger chains can profit from scale benefits in purchasing, merchandising and store operations. Yet many countries have chosen to protect small-scale stores through barriers to foreign direct investment, zoning laws, or restrictions on the size of stores. (McKinsey Global Institute 2010)
It is also interesting to note that when comparing GVA per worker across the international
sub-sector, the USA remains the leading performer (Skillsmart Retail and the Oxford
Institute of Retail Management 2010). However, the UK is still closer to its output scores
than other European countries.
2.1.1.2 Wholesale
productivity
Chart 2.2 indicates that the UK wholesale sub-sector lags behind the USA, Germany and
France, in terms of total factor productivity (TFP), with the USA sector experiencing
significant acceleration in productivity growth from 1995. This acceleration in growth is
potentially the result of the delayed impact of organisational changes companies had made
that accompanied technological spending (McGuckin 2005). 60.0
70.0 80.0 90.0 100.0 110.0 120.0 130.0 140.0
1970 1971 1972 1973 1974 1975 1976 1977 1978 1979 1980 1981 1982 1983 1984 1985 1986 1987 1988 1989 1990 1991 1992 1993 1994 1995 1996 1997 1998 1999 2000 2001 2002 2003 2004 2005 2006 2007
Total Factor Productivity Growth, Retailing (52) 1970‐2007
UK AUS FR GER USA
12
Chart 2.2: Total factor productivity growth in wholesale – 1991-2007
Source: EU KLEMS Growth & Productivity Accounts: November 2009 Release http://www.euklems.net/)
TFP for the UK wholesaling sub-sector has been on an upward trend since 2000 and its
current level of 108 is greater than the UK all-economy TFP of 105. Gains in TFP are not the
result of any physical investment but are rather associated with broad-based technical
change and business process reorganisation (McGuckin 2005).
It has been suggested that the UK and Europe’s growth in wholesale has not accelerated as
much as the USA because the pace of organisational and technological adoption has been
much slower. This lag is the result of a number of factors, including Europe’s regulatory
environment which can inhibit smooth cross-border operations in trade and the associated
gains from scale and the fact that the USA had a ‘head-start’ in successfully using new
technologies.
2.1.1.3
Automotive retail productivity
Return on Investment (RoI) research conducted by IMI (IMI 2009) highlighted the
productivity effects of the pioneering steps taken through the Automotive Technician
Accreditation (ATA). Such companies as Autoglass (IMI 2009) evidenced that through
internal (but externally assessed) technical standards in autoglazing, integrated with
transparent and effective cost management business processes, that for every one pound
invested saved Autoglass two pounds in productivity.
Additional benefits of ATA were evidenced as a lowering technician attrition rates by over a
third and that Autoglass staff were seen to have been given an additional sense of worth and
13
2.1.2 Gross Value Added (GVA)
Latest economic performance data for the wholesale and retail sector can be additionally
described through the use of GVA data3. Table 2.2 highlights the UK sectoral GVA for 2008
(latest available data).
Table 2.2: GVA by nation (£m in current basic prices) 2008 – whole economy by sector
Source: Regional Accounts, ONS, 2010
In 2008, the wholesale and retail trade accounted for 12 per cent of the UK’s GVA – the third
largest contribution of the highlighted sectors behind real estate and manufacturing. In
England wholesale and retail accounts for 12 per cent of the English total GVA figure, ten
per cent in Scotland, 11 per cent in Wales and 13 per cent in Northern Ireland
Within the total UK wholesale and retail sector GVA figures, England accounted for almost
87 per cent, Scotland seven per cent, Wales four per cent and Northern Ireland three per
cent
In terms of the £127,900m contribution wholesale and retail in England makes to the total
UK GVA figure, over a third is generated by the South East (19 per cent) and London (17
per cent) regions when combined together. The North East region generates the smallest
level of wholesale and retail GVA (approximately three per cent). Table 2.3 details these
English regional figures.
3
GVA is a productivity metric that measures the difference between output and intermediate consumption. GVA provides a monetary value for the amount of goods and services that have been produced, less the cost of all inputs and raw materials that are directly attributable to that production
UK % England Scotland Wales
Northern Ireland
£m £m £m £m £m
Agriculture, hunting, forestry and fishing 9,715 1 7,982 1,180 145 407 Mining and quarrying of energy producing materials 2,661 0 1,298 1,277 60 27 Other mining and quarrying 2,365 0 1,777 282 134 173 Manufacturing 150,298 12 124,860 13,555 7,734 4,149 Electricity, gas and water supply 21,342 2 17,414 2,653 729 545 Construction 80,756 6 68,247 7,328 2,924 2,256 Wholesale and retail trade (including motor trade) 147,158 12 127,900 10,441 5,166 3,651 Hotels and restaurants 36,428 3 30,938 3,297 1,424 770 Transport, storage and communication 91,347 7 80,262 7,065 2,529 1,491 Financial intermediation 116,801 9 104,574 8,501 2,305 1,422 Real estate, renting and business activities 303,179 24 268,770 20,829 8,380 5,200 Public administration and defence 63,281 5 51,275 6,148 3,275 2,583 Education 76,493 6 64,478 6,322 3,502 2,191 Health and social work 93,775 7 76,336 9,851 4,788 2,800 Other services 65,563 5 57,177 4,804 2,420 1,162
14
Table 2.3: GVA by English region (£m in current basic prices) 2008 – whole economy by sector
Source: Regional Accounts, ONS, 2010
Wholesale and retail contributes on average approximately 12 per cent of each English
region’s GVA. The wholesale and retail GVA within the East Midlands region contributes the
highest sectoral percentage across the nine regions. The lowest regional proportion is found
in London, even though it has the highest total GVA of any region (£22bn). However, due to
the value of other sectors within London, especially the financial sector, wholesale and
retail’s GVA proportional value is the lowest of any region at just below nine per cent.
Table 2.4 shows how the wholesale and retail trade GVA figures have developed since
1999.
Table 2.4: UK GVA by sector (£m in current basic prices) 1999-2008 – whole economy
Source: Regional Accounts, ONS, 2010
During this ten year period there has been an increase of just under 50 per cent in GVA
levels which equates to an average growth rate of approximately five per cent per year. This
ranks this sector as just below the average for all sectors of about six per cent and ranks
wholesale and retail as the eighth fastest growing sector in the UK.
Average
sector region
% North East North West
Yorkshire and
The Humber East
Midlands West
Midlands East London South East South West £m £m £m £m £m £m £m £m £m Agriculture, hunting, forestry and fishing 1 303 777 966 996 915 1,387 86 1,168 1,383 Mining and quarrying of energy producing materials 0 81 90 140 130 82 164 280 270 61 Other mining and quarrying 0 178 142 156 379 84 132 60 202 442 Manufacturing 12 6,706 19,336 14,332 13,299 13,974 13,518 13,651 18,084 11,961 Electricity, gas and water supply 2 979 1,622 1,511 1,952 1,920 1,948 1,823 3,061 2,598 Construction 6 2,990 8,236 6,266 5,835 6,588 8,946 10,262 12,482 6,643 Wholesale and retail trade (including motor trade) 12 4,424 14,906 11,348 10,850 12,313 15,933 22,016 24,588 11,522 Hotels and restaurants 3 1,123 3,527 2,383 2,012 2,905 3,041 7,717 5,063 3,166 Transport, storage and communication 7 2,668 8,846 6,518 5,866 6,596 9,871 17,509 16,218 6,170 Financial intermediation 10 2,195 8,356 6,641 3,702 5,260 9,352 48,190 13,828 7,050 Real estate, renting and business activities 25 7,842 26,072 17,146 16,325 20,405 29,769 74,039 55,440 21,733 Public administration and defence 5 2,623 5,843 4,753 3,919 4,376 5,634 7,642 10,218 6,267 Education 6 3,156 8,008 6,302 4,877 6,541 6,725 11,972 10,861 6,036 Health and social work 7 4,004 10,080 7,552 5,894 7,215 8,201 13,719 11,975 7,696 Other services 5 1,715 5,174 3,459 3,314 4,583 5,577 18,190 10,551 4,615 All sectors 40,987 121,015 89,473 79,350 93,757 120,198 247,156 194,009 97,343
Change 1999‐
2008 1999 2000 2001 2002 2003 2004 2005 2006 2007 2008
% £m £m £m £m £m £m £m £m £m £m
Agriculture, hunting, forestry and fishing 8 9,022 8,532 8,333 9,007 9,807 10,670 7,530 7,792 8,632 9,715 Mining and quarrying of energy producing materials 29 2,059 1,998 1,874 1,661 1,456 1,643 2,055 2,297 1,861 2,661 Other mining and quarrying 39 1,700 1,784 1,750 1,469 1,519 1,848 2,115 2,145 2,291 2,365 Manufacturing ‐ 1 151,157 150,009 149,223 146,308 144,845 145,689 148,110 151,455 154,726 150,298 Electricity, gas and water supply 36 15,703 15,798 15,660 16,052 16,405 16,106 16,685 20,279 21,884 21,342 Construction 91 42,236 45,626 50,526 54,684 59,522 66,029 69,868 74,619 80,675 80,756 Wholesale and retail trade (including motor trade) 48 99,509 103,410 110,249 113,777 120,520 127,367 129,810 135,366 141,735 147,158 Hotels and restaurants 51 24,146 25,605 26,928 28,639 30,120 31,870 32,902 34,594 35,962 36,428 Transport, storage and communication 41 64,961 69,201 70,502 73,064 76,587 79,020 80,889 83,655 88,280 91,347 Financial intermediation 141 48,545 44,989 48,202 63,367 71,530 75,117 79,553 90,807 103,731 116,801 Real estate, renting and business activities 75 173,329 188,361 204,041 214,849 232,204 248,677 260,116 276,108 296,955 303,179 Public administration and defence 59 39,891 41,645 43,855 46,212 49,768 53,779 58,229 60,385 61,503 63,281 Education 70 44,914 48,111 51,675 55,099 58,328 61,934 65,739 68,926 72,766 76,493 Health and social work 82 51,577 55,282 59,549 64,492 70,593 75,154 79,965 85,965 89,381 93,775 Other services 65 39,821 42,085 44,560 48,311 51,804 54,947 57,961 60,166 62,824 65,563
15
The following table highlight the productivity levels per employee job in the sector. The
calculation of these figures reflects both the growing level of productivity and the number of
employees in the wholesale and retail sector.
Table 2.5: Estimated workplace gross value added per employee job at current basic prices, 2009
SSA Sector UK England Wales Scotland
Northern Ireland
£000s £000s £000s £000s £000s
Agriculture, forestry and fishing 35 41 11 21 25
Energy production and utilities 131 134 118 127 107
Manufacturing 52 51 49 61 53
Construction, building services, engineering and
planning 65 66 54 60 56
Wholesale and retail trade 33 33 27 29 27
Transportation and storage 50 51 44 50 41
Hospitality, tourism and sport 23 23 21 22 20
Information and communication technologies 83 84 72 77 63
Creative media and entertainment 45 49 30 12 38
Financial, insurance & other professional services 86 89 57 69 63
Real estate and facilities management 85 86 103 67 98
Government services 39 40 33 35 40
Education 33 33 32 36 33
Health 27 27 26 25 23
Care 30 30 28 31 26
Not within scope 32 33 27 35 30
All sectors 46 47 38 43 38
Source: UK Commission estimates based on Regional Accounts; Annual Business Survey; Business Register and Employment Survey (BRES). See technical appendix for basis for estimates.
Notes: Figures for Real estate and facilities management sector include contribution from owner-occupier imputed rental. All figures exclude Extra-Regio element. Estimates will tend to overstate the level of GVA per job in those sectors with high levels of self-employment.
Table 2.5 highlights that GVA productivity for this sector is somewhat below the all-economy
average for both the UK and all of the four nations.
The Working Futures model (Wilson and Homenidou, 2011) provides historic estimates of productivity (output per job) by sector on a constant price (chained volume measure) basis.
This analysis indicates an average rate of productivity growth for the UK retail sector for the
first half of the last decade (2000-2005) of 3.2 per cent per annum, moderating to 1.6 per
cent in the second half of the decade. This is much higher than the average rates for the
two periods for the wider UK economy of 1.4 per cent and 0.7 per cent respectively.
According to Working Futures the sector’s strong productivity performance can be linked to
technological changes, linked especially to information and communication technologies, in
16
Table 2.6 highlights the difference in GVA per employee job levels across the wholesale and
retail sub-sectors4:
Table 2.6: GVA per employee in UK wholesale and retail sub-sectors 2010
Source: Annual Business Inquiry (ABI) / Business Register and Employment Survey (BRES) and Annual Business Survey, ONS
Table 2.6 highlights that of the four sub-sectors, retail has the lowest GVA per employee.
One possible reason for this is the actual size of the retail sub-sector compared to the other
sub-sector – an employment level of 2.8 million. Compared with the other sub-sectors, the
level of retail employment dominates the sector and therefore reduces the GVA contribution
per employee that retail makes in relation to the other sub-sectors.
2.1.3 Establishment
numbers
Table 2.7 shows that the wholesale and retail sector has the highest number of
establishments in the UK, with just over 509,000 outlets representing 20 per cent of the total.
This number of establishments is over 40 per cent higher than the second largest sector –
construction, building services, engineering and planning.
4
These sub-sector figures are calculated using the Annual Business Survey and Business Register and Employment Survey (both 2009) and unlike Table 2.5 are not constrained to the Regional Accounts totals.
GVA per employee (£) %
Retail 24,000 11
Wholesale 63,000 29
Automotive retail 42,000 19
Rental trade 90,000 41
17
Table 2.7: Number of establishments by sector and nation 2010 – whole economy
Source: Inter-departmental Business Register (IDBR), ONS
Across the UK, 85 per cent of wholesale and retail establishments are based in England;
eight per cent in Scotland; five per cent in Wales and three per cent in Northern Ireland. In
all of the four countries, wholesale and retail establishments account for one-fifth of the
nation total.
Table 2.8 details the number of retail wholesale and retail establishments across the nine
English regions.
Table 2.8: Number of establishments by sector and English region 2010 – whole economy
Source: Inter-departmental Business Register (IDBR), ONS
Wholesale and retail establishments on average account for just over 20 per cent of the total
establishments across all of the regions. The South East region has the highest number of
establishments across the regions, but due to the density of other sectoral establishments in
this region, it has one of the lower wholesale and retail percentage levels – 18 per cent.
Within the sub-sectors of wholesale and retail the following divisions can be seen in the
establishment numbers. Table 2.9 shows that retail accounts for nearly six in ten
establishments in the sub-sector.
Number % Number % Number % Number % Number % Agriculture, forestry and fishing 144,895 6 96,770 4 17,625 9.00 14,210 13 16,290 19 Energy production and utilities 13,290 1 10,365 0 1,495 1.00 865 1 565 1 Manufacturing 144,115 6 124,235 6 9,395 5.00 6,040 5 �