0022-538X/06/$08.00⫹0 doi:10.1128/JVI.01022-06
Copyright © 2006, American Society for Microbiology. All Rights Reserved.
Peripheral Blood B-Cell Death Compensates for Excessive Proliferation
in Lymphoid Tissues and Maintains Homeostasis in Bovine
Leukemia Virus-Infected Sheep†
Christophe Debacq,
1Nicolas Gillet,
1Becca Asquith,
2Maria Teresa Sanchez-Alcaraz,
3Arnaud Florins,
1Mathieu Boxus,
1Isabelle Schwartz-Cornil,
4Michel Bonneau,
4Genevie
`ve Jean,
5Pierre Kerkhofs,
6Jack Hay,
7Andre
´ The
´wis,
5Richard Kettmann,
1and Luc Willems
1*
Molecular and Cellular Biology, FNRS-FUSAG, Gembloux, Belgium1; Department of Immunology, Imperial College, London,
United Kingdom2; Department of Medical Genetics and Microbiology, University of Toronto, Toronto, Ontario, Canada3;
U892 INRA, Jouy-en-Josas, France4; Zootechny Unit, FUSAG, Gembloux, Belgium5; Department of Virology,
Veterinary and Agrochemical Research Centre, Uccle, Belgium6; and Department of Immunology,
University of Toronto, Toronto, Ontario, Canada7
Received 18 May 2006/Accepted 7 July 2006
The size of a lymphocyte population is primarily determined by a dynamic equilibrium between cell proliferation and death. Hence, lymphocyte recirculation between the peripheral blood and lymphoid tissues is a key determinant in the maintenance of cell homeostasis. Insights into these mechanisms can be gathered from large-animal models, where lymphatic cannulation from individual lymph nodes is possible. In this study, we assessed in vivo lymphocyte trafficking in bovine leukemia virus (BLV)-infected sheep. With a carboxyfluo-rescein diacetate succinimidyl ester labeling technique, we demonstrate that the dynamics of lymphocyte recirculation is unaltered but that accelerated proliferation in the lymphoid tissues is compensated for by increased death in the peripheral blood cell population. Lymphocyte homeostasis is thus maintained by biphasic kinetics in two distinct tissues, emphasizing a very dynamic process during BLV infection.
In vertebrates, continuous recirculation of lymphocytes from blood through tissues and lymph nodes is critical for protection of the host during pathological inflammatory processes, as well as physiological emigration of lymphocytes that participate in immune surveillance (1, 4, 6, 11, 16, 33). The network of exchange between blood and lymph through the lymph node is absolutely required to maintain normal cell homeostasis. The presence of homeostatic control of lymphocyte numbers en-sures an equilibrium where cell production equals cell loss. In an immune system where lymphocyte production is continuous and the total number of cells is constant, each newly produced lymphocyte can only survive if another one dies; i.e., the rate of peripheral cell renewal depends on the life span of peripheral cells. However, the life expectancy of a lymphocyte is not an intrinsic property of the cell but is determined by factors such as the environment, viral infections, and the presence or ab-sence of another, competing, cell population. We previously studied lymphocyte homeostasis, more particularly, lympho-cyte proliferation and death, in different animal models of chronic leukemia, including sheep infected by the bovine leu-kemia virus (BLV) (7–9). In this model, proliferation was es-timated by intravenous injection of bromodeoxyuridine (BrdU), a thymidine analog which is incorporated into the newly synthesized DNA via the pyrimidine salvage pathway. Although BrdU uptake by cells might occur in blood, its
in-corporation is thought to occur mainly, if not exclusively, in lymphoid tissues such as the lymph nodes, the spleen, or the bone marrow (7). By this approach, the estimated B-cell pro-liferation rates in infected and control sheep were 0.020 day⫺1
and 0.011 day⫺1, respectively, meaning that 2.0 and 1.1% of
the cells were produced by proliferation in 1 day. In contrast, the death rates of BrdU-labeled cells were not significantly different between the two categories of animals (average death rate, 0.089 day⫺1versus 0.094 day⫺1, respectively). The
imbal-ance created by the net increase in proliferation in the absence of compensating cell death was estimated at 7% growth in a day (7), leading to a theoretical very fast doubling of the cell population. However, this considerable increase in lymphocyte numbers is, in fact, not observed in vivo. Therefore, other processes, including a reduction of cell recirculation through the lymph node, as well as massive elimination of cells in secondary lymphoid tissues (28, 29), could play a role in main-taining homeostasis.
The goal of this study was to test these hypotheses by track-ing B cells from blood to lymph and back from lymph to blood. The strategy that we used was based on a single intravenous injection of carboxyfluorescein diacetate succinimidyl ester (CFSE) into BLV-infected sheep. In vivo administration of the dye has achieved a blood leukocyte labeling index of⬎95%, making it feasible to track lymphocyte migration through the lymph node in vivo (3, 27). While most studies of lymphocyte recirculation and homing have been done with rodents (12), sheep offer the opportunity to study recirculation of lympho-cytes through tissues by direct cannulation of individual lym-phatic vessel (15). Therefore, lymlym-phatic cannulation of sheep, combined with CFSE injection, provided quantitative and
* Corresponding author. Mailing address: National Fund for Scien-tific Research, Molecular and Cellular Biology Laboratory, 13 avenue Mare´chal Juin, 5030 Gembloux, Belgium. Phone: 32-81-622157. Fax: 32-81-613888. E-mail: willems.l@fsagx.ac.be.
† Supplemental material for this article may be found at http://jvi .asm.org/.
9710
on November 8, 2019 by guest
http://jvi.asm.org/
qualitative physiological measurements of the recirculation and death of lymphocytes through lymph nodes for extended periods of time in normal and pathological situations.
MATERIALS AND METHODS
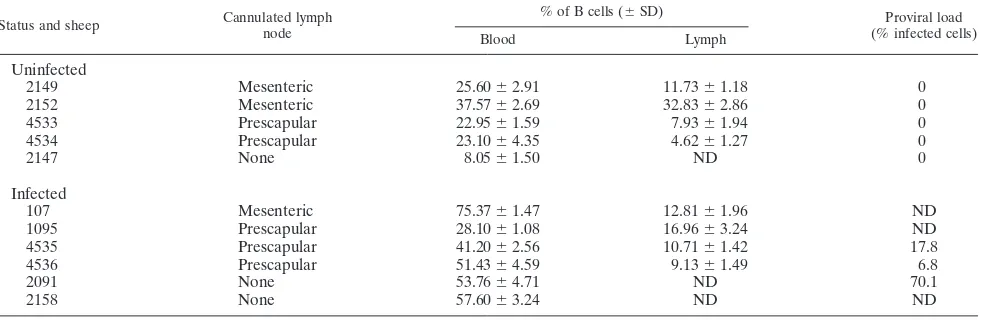
Cannulation of efferent lymphatics.Eleven sheep were kept under controlled conditions at the Veterinary and Agrochemical Research Centre (Machelen, Belgium). Five animals (2147, 2149, 2152, 4533, and 4534) were used as unin-fected controls, whereas sheep 107, 1095, 2091, 2158, 4535, and 4536 were experimentally infected with a BLV wild-type cloned provirus (strain 344) as described previously (31). Table 1 illustrates the percentages of B cells in the blood and lymph, as well the type of cannulated lymph node (prescapular or mesenteric), in the experimental sheep. Total leukocyte counts were determined by using a Coulter counter ZN, and the number of lymphocytes was estimated under a microscope after staining with May-Gru¨nwald-Giemsa. In parallel, the serum of each sheep was analyzed for BLV seropositivity by immunodiffusion and enzyme-linked immunosorbent assay techniques (25). Cannulae were surgi-cally established in intestinal or prescapular efferent lymphatics to allow chronic sampling of lymph as previously described (34). Briefly, sheep were fasted for 24 h preceding surgery and anesthetized by intravenous injection of pentobar-bital sodium (Nembutal; Abbott) or fluothane (Covely) with closed-circuit an-esthetic equipment. Aseptic surgical techniques were used throughout the sur-gery. Silicone (Vygon) or vinyl (Scientific Commodities) catheters were filled with heparin (Sigma) and positioned in efferent lymphatic vessels. Following surgery, animals were allowed to recover for at least 24 h prior to cell collection. Lymph samplings were performed arbitrarily at short intervals of time in the beginning of the experiment in order to precisely define the best kinetics of CFSE-labeled cell migration. All animals were housed in metabolism cages during lymph collection and allowed free access to food and water during the experiment. Handling of animals and experimental procedures were conducted in accordance with institutional and national guidelines for animal care and use.
In vivo CFSE cell labeling and immunophenotyping.Twenty-five milligrams of CFSE dissolved in 4 ml of dimethyl sulfoxide and 40l of heparin (1,000 U/ml) was directly injected into the peripheral blood via the jugular vein in order to label blood leukocytes (27). At regular intervals of time, blood was collected by jugular venipuncture and peripheral blood mononuclear cells (PBMCs) were isolated by Percoll gradient centrifugation (Sigma). Lymph was collected in sterile bottles attached to bottle holders pasted to the skin of animals and containing 1,000 U of heparin. Lymphocytes were harvested by low-speed cen-trifugation, and cell viability was estimated by trypan blue dye exclusion.
Cells were labeled with monoclonal antibodies directed against surface immu-noglobulin M (anti-sIgMs, clone 1H4, mouse IgG1; Pig45A2, mouse IgG2b), CD4 (ST4, mouse IgG1), CD5 (CC17, mouse IgG1), CD8 (CC58, mouse IgG1), CD11b (CC125, mouse IgG1),␥␦T cells (86D, mouse IgG1), CD21 (GB25A, mouse IgG1), and L-selectin (DU1-29, IgG1) provided by C. Howard (Institute for Animal Health, Compton, United Kingdom) and by one of us (I.S.-C.) or
obtained from VMRD Inc. Cells were then labeled with a rat anti-mouse IgG1 phycoerythrin-conjugated antibody or with a rat anti-mouse IgG2a⫹b peridinin chlorophyll protein (PerCp) antibody (Becton Dickinson Immunocytometry Sys-tems). For detection of the p24 major capsid antigen, PBMCs were cultivated at 37°C in a 5% CO2–air atmosphere in RPMI 1640 medium supplemented with
10% fetal calf serum, 2 mML-glutamine, 100 U of penicillin, and 100g of streptomycin per ml (Sigma). After 24 h of culture, PBMCs were collected and washed once with phosphate-buffered saline–0.5% bovine serum albumin. The cells were fixed and permeabilized with the IntraStain reagent (DAKO). Internal detection of the p24 viral protein was performed by sequential incubation with 4⬘G9 monoclonal antibody and a rat anti-mouse IgG1 phycoerythrin conjugate (Becton Dickinson Immunocytometry Systems). Finally, cells were analyzed in combination with CFSE by flow cytometry on a Becton Dickinson FACScan flow cytometer. Ten thousand events were collected for each sample, and data were analyzed with the CellQuest software (Becton Dickinson Immunocytometry Sys-tems).
Mathematical model.To estimate the proliferation and disappearance rates of different cell populations, a mathematical model was constructed (details were provided by Asquith et al. [2]). Briefly, the model uses two pieces of data from the flow cytometry analyses, i.e., the proportion of CFSE⫹cells (P) and the ratio of the mean fluorescence intensity of the CFSE⫹population to the CFSE⫺ population (I), to estimate the rate of proliferation and the rate of death of CFSE-labeled B lymphocytes. To develop the model, we first estimated the number of divisions (halving of fluorescence) between an average CFSE⫹cell and an average CFSE⫺cell at time zero. It was found to be five for sheep 2152, 4533, 4534, 2091, 2158, 4535, and 4536 and six for sheep 2147. The model for five divisions isx0⫽ ⫺(p⫹d)x0,x1⫽2px0⫺(p⫹d)x1,x2⫽2px1⫺(p⫹d)x2,x3⫽
2px2⫺(p⫹d)x3,x4⫽2px3⫺(p⫹d)x4, andx5⫽2px4⫺(p⫹d)x5⫹ , where
xi is the proportion of B cells that have undergoneidivisions since CFSE
labeling. In the model, the cells in thex5category are CFSE⫺(either because
they have divided five times since labeling and therefore lost their fluorescence or because they were not labeled by the initial injection). The average prolifer-ation rate of cells isp, the average disappearance rate isd, and the average replacement rate is. These equations can be solved analytically and then used to find expressions forI, the ratio of the mean fluorescence intensity (MFI) of the CFSE⫹population to the CFSE⫺population, andP, the proportion of CFSE⫹ cells, as follows:
I⫽Jx0⫹J/2x1⫹J/4x2⫹J/8x3⫹J/16x4 x0⫹x1⫹x2⫹x3⫹x4 ⫼
J/32x5
x5
⫽4共24⫹24pt⫹12p
2t2⫹4p3t3⫹p4t4兲
3⫹6pt⫹6p2t2⫹4p3t3⫹2p4t4
P⫽ x0⫹x1⫹x2⫹x3⫹x4 x0⫹x1⫹x2⫹x3⫹x4⫹x5⫽
Fe⫺共p⫹d兲t共1⫹2pt⫹2p2t2⫹4/3p3t3⫹2/3p4t4兲
[image:2.585.44.545.81.243.2]Here,Jis the MFI of the CFSE label in undivided cells andFis the proportion TABLE 1. Overall design of the lymph node cannulation studya
Status and sheep Cannulated lymph node
% of B cells (⫾SD) Proviral load
(% infected cells)
Blood Lymph
Uninfected
2149 Mesenteric 25.60⫾2.91 11.73⫾1.18 0
2152 Mesenteric 37.57⫾2.69 32.83⫾2.86 0
4533 Prescapular 22.95⫾1.59 7.93⫾1.94 0
4534 Prescapular 23.10⫾4.35 4.62⫾1.27 0
2147 None 8.05⫾1.50 ND 0
Infected
107 Mesenteric 75.37⫾1.47 12.81⫾1.96 ND
1095 Prescapular 28.10⫾1.08 16.96⫾3.24 ND
4535 Prescapular 41.20⫾2.56 10.71⫾1.42 17.8
4536 Prescapular 51.43⫾4.59 9.13⫾1.49 6.8
2091 None 53.76⫾4.71 ND 70.1
2158 None 57.60⫾3.24 ND ND
a
The coordinates, type of cannulated lymph node, and percentages of B cells are indicated with regard to the infection status of sheep. Mean percentages of B lymphocytes were determined by flow cytometry in three independent experiments. The proviral loads (in percentages of infected cells considering that all cells contain a single proviral copy) were determined by real-time PCR. ND, not determined.
on November 8, 2019 by guest
http://jvi.asm.org/
on November 8, 2019 by guest
http://jvi.asm.org/
of peripheral blood B cells labeled by the initial injection. These formulas were fitted to the experimental data by nonlinear regression, and lymphocyte kinetics were estimated.
RESULTS
B lymphocytes from BLV-infected and control sheep
recir-culate at similar rates.The kinetics of the whole peripheral
blood population can be investigated by in vivo administration of CFSE (i) because cells are labeled regardless of their divi-sion state; (ii) because CFSE labels all of the cells in the whole peripheral blood; (iii) because of instability of the succinimidyl ester moiety, initial labeling by CFSE ends within a few min-utes; and (iv) because insufficient CFSE reaches the lymph nodes to directly label cells in this compartment (27). Cell migration from the peripheral blood through individual lymph nodes can then be identified by placing indwelling catheters into the efferent lymphatic vessels and subsequent analysis by flow cytometry. We first verified that no CFSE-labeled cells were detectable in the efferent lymph immediately after CFSE injection (see Fig. S1 in the supplemental material).
Figure 1A illustrates an example of B-cell–CFSE dual flow cytometry analysis performed on lymph recovered from a BLV-infected sheep (4535) and a control (4534) sheep at 2, 22, and 94 h after CFSE injection. The percentages of B⫹CFSE⫹ cells in the total B-cell population were low at 2 h post CFSE injection, increased at 22 h, and stabilized later on.
To extend these observations, the recirculation kinetics of CFSE-labeled blood B cells was determined by this approach in four BLV-infected and four control sheep (Fig. 1B). The data shown for sheep 4533, 4534, 4535, and 4536 result from prescapular cannulation; the data for sheep 2149, 2152, and 107 were obtained with mesenteric lymph; and sheep 1095 was cannulated in both the prescapular and mesenteric lymph nodes. Although the appearance rate of CFSE⫹B lymphocytes in the efferent lymph slightly varied in different animals, the percentage of labeled cells consistently reached an equilibrium level of approximately 3 to 7% after about 20 to 30 h. These recirculation kinetics in control sheep are thus in accordance with previous reports assuming that the maximum recovery of all subsets of lymphocytes in efferent lymph is about 24 h (27, 33). However, we could not observe a significant difference between the kinetics of CFSE-labeled cell exit from the lymph nodes independently of the cannulated lymph node. Impor-tantly, the recirculation rates in BLV-infected sheep did not significantly differ from those in the controls (as determined by
a two-tailed Studentttest at 26 h; Fig. 1C). Furthermore, we analyzed the change in the label over time in the lymph by fitting a growth model with two parameters—the rate of in-crease of the label (a) and the equilibrium value of the label (k) (Fig. 1D). Finally, neither the rate of recirculation of labeled B cells to the lymph nor the equilibrium value of labeled cells in the lymph varied between BLV-infected and uninfected sheep (P⫽0.39 andP⫽0.57 for a and k, respectively, according to the Wilcoxon-Mann-Whitney two-tailed test).
Peripheral blood B cells from BLV-infected and control
sheep exhibit different CFSE kinetics.If recirculation through
lymph nodes is not involved, other regulatory processes, such as higher death rates of the peripheral blood B-lymphocyte population, might compensate for a global excess of prolifer-ation in BLV-infected sheep. To test this hypothesis, CFSE kinetic profiles of peripheral blood B lymphocytes were com-pared in BLV-infected and control sheep. We first verified that CFSE injection indeed leads to very efficient fluorescent label-ing of PBMCs in vivo (Fig. 2A), as reported in a previous paper (27). After reaching a labeling index of ⬎95% 1 min after injection, the percentages of CFSE-labeled cells within the PBMC population rapidly dropped at 2 h (illustrated in panel A for a noninfected sheep). Flow cytometry analyses with PBMCs isolated from a BLV-infected (2091) and a control (2147) sheep at days 0, 1, 6, and 34 after CFSE injection are illustrated in Fig. 2B. At day 1, approximately half of the B cells were CFSE⫹(51.6 and 46.0% in the control and BLV-infected sheep, respectively; Fig. 2B). The percentage of CFSE-labeled B cells in blood then decreased more quickly in the infected sheep than in the uninfected animal (4.6% and 15.8% at day 34 for the infected and uninfected sheep, respec-tively). A similar difference in kinetics was observed in two other BLV-infected sheep (4535 and 4536) and two controls (4533 and 4534) (Fig. 2C). Indeed, the percentages of CFSE-labeled B cells reached a level below 5% around days 27 to 42 for BLV-infected sheep (2091, 4535, and 4536), whereas the same value was obtained only after 83 days in the controls (2147, 4533, and 4534) (arrows in Fig. 2C). Interestingly, the decrease in CFSE⫹peripheral blood B cells was thus consis-tently faster in BLV-infected animals than in controls.
A CD11b subpopulation accounts for the difference in CFSE
kinetics in BLV-infected sheep.To test whether this difference
in kinetics was associated with a particular cell phenotype, CFSE labeling was evaluated in four subsets of B cells express-ing L-selectin, CD21, CD5, or CD11b. These markers were
FIG. 1. B-cell trafficking through the lymph node. (A) The efferent lymphatic vessels from the prescapular lymph nodes of a BLV-infected (4535) and a control (4534) sheep were surgically cannulated, allowing chronic sampling of lymph. Animals were injected intravenously with 25 mg of CFSE. At regular intervals of time (2, 22, and 94 h), lymph was collected and B cells were labeled with the anti-IgM 1H4 monoclonal antibody in association with a phycoerythrin conjugate. Ten thousand cells were then analyzed by two-color flow cytometry (xaxis⫽CFSE;yaxis⫽B lymphocytes). The percentages of CFSE⫹B cells within the total B-lymphocyte population are indicated in the upper right quadrants. (B) Lymph samples from four BLV-infected (107, 1095, 4535, and 4536) and four control (2149, 2152, 4533, and 4534) sheep were continuously collected at regular intervals of time (in hours) post CFSE injection, and the percentages of CFSE⫹B cells within the total B-cell population were determined. A vertical line is placed at 24 h. (C) Graphic distribution of the percentages of CFSE⫹B cells in efferent lymph recovered at 26 h after CFSE injection. Individual values (BLV-infected [Œ, 107;}, 1095;■, 4535;F, 4536] and uninfected [‚, 2149;〫, 2152;䊐, 4533;E, 4534] sheep) and mean values (black lines) are represented. NS means no statistically significant difference by the Studentttest. (D) Schematic representation of the change in label over time in the lymph. The model contains two parameters, i.e., the rate of increase in the label (a) and the equilibrium value of the label (k). Neither the rate of recirculation of labeled B cells to the lymph nor the equilibrium value of labeled cells in the lymph varied between BLV-infected and uninfected sheep (P⫽0.39 andP⫽0.57 for a and k, respectively, according to the Wilcoxon-Mann-Whitney two-tailed test).
on November 8, 2019 by guest
http://jvi.asm.org/
selected primarily because the migration competence of B lym-phocytes correlates with the surface expression of L-selectin and CD21 mediating subsequent integrin-dependent adher-ence (14, 35). Moreover, BLV preferentially replicates in CD5⫹and CD11b⫹B lymphocytes, although cells negative for these receptors are also less efficient targets for the virus (5, 22). After CFSE injection, PBMCs were isolated from BLV-infected or control sheep; labeled sequentially with an anti-IgM antiserum and with anti-L-selectin, anti-CD21, anti-CD5, or anti-CD11b monoclonal antibodies; and then analyzed by three-color flow cytometry. Importantly, all of the cell popu-lations in the peripheral blood were CFSE labeled with effi-ciencies of⬎95% (data not shown). For three out of the four markers (i.e., L-selectin, CD21, and CD5), the CFSE profiles were the same for marker-positive and marker-negative cells and the difference between the CFSE profiles of uninfected and infected animals was maintained (Fig. 3). In contrast, the kinetics of CD11b⫺B lymphocytes was similar between BLV-infected and control samples (and particularly at day 26 [ar-row]), indicating that the expression of the CD11b integrin accounted for the particular CFSE profile of infected sheep.
The death rate of peripheral blood B cell is increased in
BLV-infected sheep.A reduction in the proportion of CFSE⫹
lymphocytes can be due either to cell death or to label dilution below the threshold of detection due to proliferation. These parameters could be quantified assuming that the fluorescence intensity of the CFSE label is halved upon cell division. A mathematical model was designed by incorporating a relation-ship betweenI(the ratio of the mean fluorescence intensities of B⫹CFSE⫹and B⫹CFSE⫺populations) andP(the pro-portion of CFSE⫹B cells) (Asquith et al., unpublished data). By fitting this model to the CFSE data (theoretical fits, Fig. 4) from four BLV-infected and four control sheep, the average proliferation rate (p) and death rate (d) of the CFSE⫹B-cell population could be estimated (Table 2). The proliferation rate is an estimate of the proportion of B cells that divide in 1 day (e.g., in sheep 2147, ifp⫽0.049 day⫺1then approximately
4.9% of the CFSE⫹B lymphocytes proliferate in 1 day). Sim-ilarly, the death rate (0.079 day⫺1) is the proportion of labeled
B cells that disappear from the blood of the animal in 1 day. On the basis of the measured incorporation levels, the prolif-eration and death rates were calculated for all of the sheep studied (Table 2). The mean proliferation rates were not sig-nificantly different in the two categories of animals (0.029⫾ 0.017 for the controls and 0.039⫾0.003 for the BLV-infected sheep; no statistically significant difference by the Student t
test). In contrast, a statistically significant difference (P⬍0.01 by the two-tailed unpaired Student ttest) was observed be-tween the death rates of B lymphocytes from BLV-infected and control sheep.
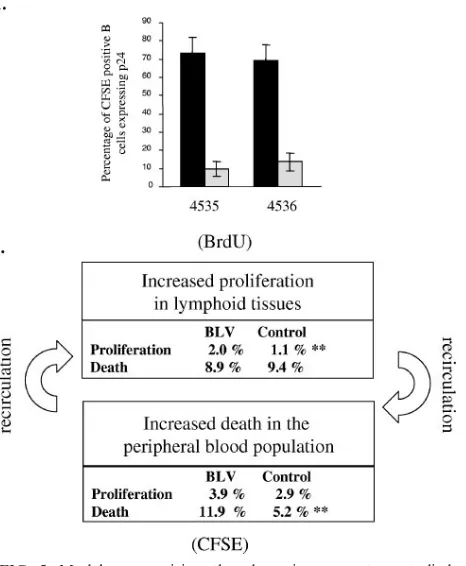
We thus conclude that in BLV-infected sheep, the periph-eral blood B-lymphocyte population undergoes increased cell death. This conclusion is supported by the fact that very few cells labeled with CFSE in the blood and trafficking through the lymph node are able to express viral capsid antigen p24 (Fig. 5A). The most straightforward interpretation of this ob-servation is that efficient immune selection is exerted toward cells spontaneously expressing BLV.
DISCUSSION
[image:5.585.307.542.72.261.2]Homeostatic regulation of lymphocyte numbers in the pe-ripheral blood results from a series of physiological factors of which cell proliferation and death are only partial components. Indeed, the kinetics of a cell population is also influenced by recirculation to lymphoid organs, in which proliferation is thought to primarily occur, at least under normal or chronic conditions. Our initial experiments based on BrdU kinetics thus pertained mainly to cells in lymphoid tissues leading to an apparent discrepancy; i.e., the imbalance created by the net increase in proliferation in the absence of compensating cell death was estimated at 7% growth in a day (7). Since this considerable growth rate was not reflected by an increase in the corresponding lymphocyte numbers, other regulatory mechanisms, including a reduction of recirculation through the lymph node, as well as massive elimination of cells in other tissues, could play a role. On the basis of CFSE labeling of peripheral blood leukocytes, we demonstrate here that the latter mechanism is an important factor during chronic BLV infection. Collectively, observations deduced from BrdU and CFSE kinetics can tentatively be summarized in a global model (Fig. 5B). Quantification of the dynamic parameters by the two approaches shows that the excess proliferation in lymphoid
FIG. 2. B-cell CFSE kinetics in peripheral blood. (A) CFSE was injected into the jugular vein of a control sheep (117), and blood was recovered at different times (before and 1 min, 2 h, and 6 days after injection) from the other jugular vein. PBMCs were isolated by Percoll gradient centrifugation, and fluorescence was measured by flow cytom-etry of 10,000 cells (x axis ⫽ CFSE; y axis ⫽ number of events). (B) One BLV-infected (2091) and one control (2147) sheep were injected intravenously with a bolus of CFSE, and an aliquot of blood was collected by jugular venipuncture before injection and at 1, 6, or 34 days postinjection. PBMCs were purified, and B cells were labeled with the anti-IgM 1H4 monoclonal antibody and stained with a phyco-erythrin conjugate. Finally, 10,000 cells were analyzed by flow cytom-etry (x axis⫽CFSE;y axis⫽B lymphocytes). The percentages of CFSE⫹B cells within the total B-lymphocyte population are indicated in the upper right quadrants. (C) Kinetics of the CFSE⫹B-cell pop-ulation in the peripheral blood of three BLV-infected (2091, 4535, and 4536; solid lines) and three control (2147, 4533, and 4534; dotted lines) sheep. The arrows indicate key times of CFSE kinetics (day 27 and day 83) at which the percentages of labeled B cells reached baseline levels in BLV-infected sheep and in the controls, respectively.
on November 8, 2019 by guest
http://jvi.asm.org/
organs can be compensated for by increased cell death in the peripheral blood. In fact, immunophenotyping of the cell pop-ulations involved adds another level of complexity. CD11b⫺B lymphocytes recirculate efficiently via the lymph nodes; cells lacking this marker are mostly restricted to the peripheral blood and spleen (14). This is consistent with previous reports showing that the recirculating subpopulation has the pheno-type CD11b⫺ CD21⫹ L-selectin⫹ CD5⫺ and is detected in efferent lymph (23, 35). Interestingly, expression of CD11b also specifically correlates with the particular CFSE kinetics ob-served in BLV-infected sheep (Fig. 3). Since CD11b⫹B lym-phocytes preferentially accumulate while disease progresses (5), the increased death rate of this population could appear paradoxical. However, it should be noted that CFSE kinetics pertains to CD11b⫹cells exclusively labeled within the periph-eral blood but not in the white pulp of the spleen. Indeed, cells do not stain fluorescently in spleen biopsy material isolated at 30 min after CFSE injection (see Fig. S2 in the supplemental
material). We therefore hypothesize that the CD11b⫹B-cell death in the peripheral blood is compensated for by an excess in proliferation occurring in the spleen follicles, a parameter that remains to be precisely quantified in this particular organ. Since 11.9% of the B cells from the peripheral blood pool disappear each day in BLV-infected sheep, compared to 5.2% in controls, the CFSE kinetics reveals a very dynamic process in a rather chronic disease lasting several months (if not years) before transformed lymphocytes finally accumulate at the final leukemic stage. Furthermore, there is also a clear trend toward excessive proliferation but this difference is not statistically significant (0.039⫾0.003 versus 0.029⫾0.017 in the controls). Among a series of plausible hypotheses that cannot be formally excluded, one of the possible models is that the increased turnover results from an activated immune response directed toward the virus. Continuous expression of viral antigens could indeed exacerbate proliferation of virus-reactive immune cells either directly or via cytokines and thus also potentially
BLV-FIG. 2—Continued.
on November 8, 2019 by guest
http://jvi.asm.org/
[image:6.585.135.445.68.503.2]FIG. 3. Kinetic analyses of B-cell subsets. At regular time intervals of the CFSE kinetic analysis of three BLV-infected sheep (2091, 4535, and 4536) and three controls (2147, 4333, and 4534) (Fig. 2), PBMCs were labeled with a B-lymphocyte-specific antibody and with a peridinin-chlorophyll-protein conjugate. The PBMCs were then incubated with monoclonal antibodies directed against L-selectin, CD21, CD5, or CD11b and with a phycoerythrin conjugate. Finally, 10,000 events of thrice-labeled cells were analyzed by flow cytometry. The percentages of CFSE⫹B cells expressing L-selectin, CD21, CD5, or CD11b in the corresponding B-lymphocyte subsets were determined at different time intervals (in days). At day 26, the percentages of CFSE⫹CD11b⫺B cells reached baseline levels in both infected sheep and controls (arrow).
9716
on November 8, 2019 by guest
FIG. 4. Theoretical fit of the model to the CFSE data. The percentages of CFSE⫹B cells (P [black squares]) and the ratio of the MFI of B⫹ CFSE⫹cells to the MFI of B⫹CFSE⫺cells (I [open triangles]) were determined by flow cytometry analyses. The data corresponding to the P and I values were fitted simultaneously to a mathematical model, yielding theoretical curves.
on November 8, 2019 by guest
http://jvi.asm.org/
infected B lymphocytes. Excessive proliferation of uninfected B lymphocytes in response to BLV infection has recently been clearly documented (10). Whether a similar antiviral process is also responsible for expansion of BLV-infected B cells is un-known. Arguments against this hypothetical mechanism of in-direct viral spread include the absence of a selective growth advantage conferred on infected cells. Why would a viral an-tigen-specific B cell be preferentially infected by the virus? We therefore favor a model in which the virus plays an active role by continuously expressing viral proteins, like that encoded by thetaxoncogene, able to promote cell proliferation. The on-cogenic potential of Tax, which has been extensively exempli-fied in numerous systems (13, 17, 26, 30, 32), would favor replication of the infected cell. Indirectly, permanenttax ex-pression would also concomitantly stimulate the antiviral im-mune response, which in turn would clear the infected cells. Shutoff of viral expression by viral accessory proteins (24) would then allow a minority of these cells to escape the im-mune response. Since very few lymphocytes expressing viral proteins can be directly observed in vivo (18, 19), the frequency of infected cells surviving the host immune pressure is low. Also, this process would only marginally affect the very large majority of infected cells containing a silent virus (or a less frequently expressed virus). The net outcome of this model would be global stability of the proviral loads, with some fluc-tuations of individual clones, as revealed by long-term fol-low-up of proviral integration sites by ligation-mediated PCR (20, 21). Although still hypothetical, this model best reconciles all of the currently available evidence, i.e., the oncogenic
po-tential of Tax (13, 17, 26, 30, 32), the permanent stimulation of the immune system, the low levels of detectable cells express-ing viral proteins in vivo, the apparent stability of individual proviral clones, and the CFSE kinetics reported here.
ACKNOWLEDGMENTS
We thank the Belgian Foundation against Cancer, the 6th frame-work program INCA project of the European Union (LSHC-CT-2005-018704), the Bekales Foundation, the Fortis Bank Assurance, the Fonds National de la Recherche Scientifique (FNRS), the Leverhulme Trust, and the Interuniversity Attraction Poles Programme—Belgian Science Policy P4/30 for financial support. C.D. (postdoctoral re-searcher), N.G. (Te´le´vie fellow), A.F. (research fellow), M.B. (FRIA fellow), R.K., and L.W. (research directors) are members of the FNRS.
[image:9.585.305.538.73.356.2]We are grateful to Patrice Urbain and Samy Ilunga Nyarusoke for experimental assistance. The antibodies were kindly provided by K. Walravens (CODA/CERVA, Uccle, Belgium), J. J. Letesson (FUNDP, Namur, Belgium), D. Portetelle (FSAGx, Gembloux, Bel-FIG. 5. Model summarizing the dynamic parameters studied. (A) PBMCs from two BLV-infected sheep were isolated from total blood, and cells were collected in parallel from lymph. Cells were cultivated for 24 h in RPMI medium supplemented with 10% fetal calf serum, 2 mM glutamine, and penicillin-streptomycin. B cells and viral capsid protein p24 were then labeled with specific monoclonal anti-bodies and analyzed by flow cytometry. The percentages of CFSE⫹B cells expressing p24 in blood are represented by black bars, and data from lymph are represented by gray bars. The data are mean values and standard deviations resulting from more than five samplings taken over a period of 46 h post CFSE injection. (B) Quantification of proliferation and death rates in BLV-infected sheep. Excessive prolif-eration in the lymphoid tissues measured by BrdU incorporation can be compensated for by an increase in cell death in the peripheral blood, as deduced from the CFSE kinetics. The percentages shown represent the proliferation or death rates determined in BLV-infected or control sheep.**, statistically significant difference (P⬍0.01) by the two-tailed unpaired Studentttest.
TABLE 2. Minimal proliferation and death rates estimated from CFSE dataa
Status and sheep or parameter
and group
Proliferation rate (day⫺1⫾
SD)
Death rate (day⫺1⫾
SD)
Uninfected
2147 0.049⫾0.005 0.079⫾0.008
2152 0.008⫾0.007 0.022⫾0.022
4533 0.033⫾0.005 0.060⫾0.005
4534 0.026⫾0.002 0.046⫾0.004
BLV infected
2091 0.042⫾0.007 0.113⫾0.013
2158 0.042⫾0.006 0.098⫾0.008
4535 0.037⫾0.003 0.122⫾0.010
4536 0.036⫾0.005 0.144⫾0.020
Mean value
Uninfected 0.029⫾0.017 0.052⫾0.024 BLV infected 0.039⫾0.003b 0.119⫾0.019c
aMinimal proliferation and death rates were estimated by fitting a theoretical
model to the CFSE incorporation data. The standard deviations of the individual parameters reflect the level of confidence in the estimated parameters. Mean values were calculated for BLV-infected (2091, 2158, 4535, and 4536) and con-trol (2147, 2152, 4533, and 4534) sheep. The standard deviations of the mean values reflect the variability within each group. The proliferation rates of the CFSE-positive B-cell population are statistically similar between the infected (2091, 2158, 4535, and 4536) and control (2147, 2152, 4533, and 4534) sheep. However, the death rates of the labeled-B-cell population are statistically signif-icantly different between the two groups of animals.
bNo statistically significant difference by unpaired two-tailed Studentttest
(P⬎0.05).
cStatistically significant difference by unpaired two-tailed Studentttest (P⬍
0.01).
on November 8, 2019 by guest
http://jvi.asm.org/
[image:9.585.42.283.437.611.2]gium), and C. Howard (Institute for Animal Health, Compton, United Kingdom).
REFERENCES
1.Agenes, F., M. M. Rosado, and A. A. Freitas.2000. Considerations on B cell homeostasis. Curr. Top. Microbiol. Immunol.252:68–75.
2.Asquith, B., C. Debacq, A. Florins, N. Gillet, T. Sanchez-Alcaraz, A. Mosley, and L. Willems.2006. Quantifying lymphocyte kinetics in vivo using carboxy-fluorescein diacetate succinimidyl ester (CFSE). Proc. Biol. Sci.273:1165– 1171.
3.Becker, H. M., M. Chen, J. B. Hay, and M. I. Cybulsky.2004. Tracking of leukocyte recruitment into tissues of mice by in situ labeling of blood cells with the fluorescent dye CFDA SE. J. Immunol. Methods286:69–78. 4.Campbell, D. J., C. H. Kim, and E. C. Butcher.2003. Chemokines in the
systemic organization of immunity. Immunol. Rev.195:58–71.
5.Chevallier, N., M. Berthelemy, D. Le Rhun, V. Laine, D. Levy, and I. Schwartz-Cornil.1998. Bovine leukemia virus-induced lymphocytosis and increased cell survival mainly involve the CD11b⫹B-lymphocyte subset in sheep. J. Virol.72:4413–4420.
6.Cunningham, C. P., W. G. Kimpton, J. E. Holder, and R. N. Cahill.2001. Thymic export in aged sheep: a continuous role for the thymus throughout pre- and postnatal life. Eur. J. Immunol.31:802–811.
7.Debacq, C., B. Asquith, P. Kerkhofs, D. Portetelle, A. Burny, R. Kettmann, and L. Willems. 2002. Increased cell proliferation, but not reduced cell death, induces lymphocytosis in bovine leukemia virus-infected sheep. Proc. Natl. Acad. Sci. USA99:10048–10053.
8.Debacq, C., B. Asquith, M. Reichert, A. Burny, R. Kettmann, and L. Wil-lems.2003. Reduced cell turnover in bovine leukemia virus-infected, persis-tently lymphocytotic cattle. J. Virol.77:13073–13083.
9.Debacq, C., J. M. Heraud, B. Asquith, C. Bangham, F. Merien, V. Moules, F. Mortreux, E. Wattel, A. Burny, R. Kettmann, M. Kazanji, and L. Willems.
2005. Reduced cell turnover in lymphocytic monkeys infected by human T-lymphotropic virus type 1. Oncogene24:7514–7523.
10.Debacq, C., M. T. Sanchez Alcaraz, F. Mortreux, P. Kerkhofs, R. Kettmann, and L. Willems.2004. Reduced proviral loads during primo-infection of sheep by bovine leukemia virus attenuated mutants. Retrovirology1:31. 11.Freitas, A. A., and B. Rocha.2000. Population biology of lymphocytes: the
flight for survival. Annu. Rev. Immunol.18:83–111.
12.Gaudin, E., M. Rosado, F. Agenes, A. McLean, and A. A. Freitas.2004. B-cell homeostasis, competition, resources, and positive selection by self-antigens. Immunol. Rev.197:102–115.
13.Grassmann, R., M. Aboud, and K. T. Jeang.2005. Molecular mechanisms of cellular transformation by HTLV-1 Tax. Oncogene24:5976–5985. 14.Gupta, V. K., I. McConnell, R. G. Dalziel, and J. Hopkins.1998. Two B cell
subpopulations have distinct recirculation characteristics. Eur. J. Immunol.
28:1597–1603.
15.Hall, J. G., and B. Morris.1963. The lymph-borne cells of the immune response. Q. J. Exp. Physiol. Cogn. Med. Sci.48:235–247.
16.Hein, W. R., and P. J. Griebel.2003. A road less travelled: large animal models in immunological research. Nat. Rev. Immunol.3:79–84. 17.Jeang, K. T., C. Z. Giam, F. Majone, and M. Aboud.2004. Life, death, and
tax: role of HTLV-I oncoprotein in genetic instability and cellular transfor-mation. J. Biol. Chem.279:31991–31994.
18.Lagarias, D. M., and K. Radke.1989. Transcriptional activation of bovine
leukemia virus in blood cells from experimentally infected, asymptomatic sheep with latent infections. J. Virol.63:2099–2107.
19.Moritoyo, T., S. Izumo, H. Moritoyo, Y. Tanaka, Y. Kiyomatsu, M. Nagai, K. Usuku, M. Sorimachi, and M. Osame.1999. Detection of human T-lympho-tropic virus type I p40tax protein in cerebrospinal fluid cells from patients with human T-lymphotropic virus type I-associated myelopathy/tropical spastic paraparesis. J. Neurovirol.5:241–248.
20.Mortreux, F., I. Leclercq, A. S. Gabet, A. Leroy, E. Westhof, A. Gessain, S. Wain-Hobson, and E. Wattel.2001. Somatic mutation in human T-cell leu-kemia virus type 1 provirus and flanking cellular sequences during clonal expansion in vivo. J. Natl. Cancer Inst.93:367–377.
21.Moules, V., C. Pomier, D. Sibon, A. S. Gabet, M. Reichert, P. Kerkhofs, L. Willems, F. Mortreux, and E. Wattel.2005. Fate of premalignant clones during the asymptomatic phase preceding lymphoid malignancy. Cancer Res.
65:1234–1243.
22.Murakami, K., K. Okada, Y. Ikawa, and Y. Aida.1994. Bovine leukemia virus induces CD5⫺B cell lymphoma in sheep despite temporarily increasing CD5⫹B cells in asymptomatic stage. Virology202:458–465.
23.Naessens, J.1997. Surface Ig on B lymphocytes from cattle and sheep. Int. Immunol.9:349–354.
24.Nicot, C., R. L. Harrod, V. Ciminale, and G. Franchini.2005. Human T-cell leukemia/lymphoma virus type 1 nonstructural genes and their functions. Oncogene24:6026–6034.
25.Portetelle, D., M. Mammerickx, and A. Burny.1989. Use of two monoclonal antibodies in an ELISA test for the detection of antibodies to bovine leu-kaemia virus envelope protein gp51. J. Virol. Methods23:211–222. 26.Ratner, L.2005. Pathogenesis and treatment of human T-cell leukemia virus
infection. Immunol. Res.32:217–224.
27.Ristevski, B., A. J. Young, L. Dudler, R. N. Cahill, W. Kimpton, E. Wash-ington, and J. B. Hay.2003. Tracking dendritic cells: use of an in situ method to label all blood leukocytes. Int. Immunol.15:159–165.
28.Schenkel, A. R., H. Uno, and C. D. Pauza.1999. Asymptomatic simian immunodeficiency virus infection decreases blood CD4⫹T cells by accumu-lating recircuaccumu-lating lymphocytes in the lymphoid tissues. J. Virol.73:601–607. 29.Wang, L., J. J. Chen, B. B. Gelman, R. Konig, and M. W. Cloyd.1999. A novel mechanism of CD4 lymphocyte depletion involves effects of HIV on resting lymphocytes: induction of lymph node homing and apoptosis upon secondary signaling through homing receptors. J. Immunol.162:268–276. 30.Willems, L., A. Burny, D. Collete, O. Dangoisse, F. Dequiedt, J. S. Gatot, P.
Kerkhofs, L. Lefebvre, C. Merezak, T. Peremans, D. Portetelle, J. C. Twizere, and R. Kettmann.2000. Genetic determinants of bovine leukemia virus pathogenesis. AIDS Res. Hum. Retrovir.16:1787–1795.
31.Willems, L., R. Kettmann, F. Dequiedt, D. Portetelle, V. Voneche, I. Cornil, P. Kerkhofs, A. Burny, and M. Mammerickx.1993. In vivo infection of sheep by bovine leukemia virus mutants. J. Virol.67:4078–4085.
32.Yoshida, M.2005. Discovery of HTLV-1, the first human retrovirus, its unique regulatory mechanisms, and insights into pathogenesis. Oncogene
24:5931–5937.
33.Young, A. J.1999. The physiology of lymphocyte migration through the single lymph node in vivo. Semin. Immunol.11:73–83.
34.Young, A. J., and J. B. Hay. 1995. Rapid turnover of the recirculating lymphocyte pool in vivo. Int. Immunol.7:1607–1615.
35.Young, A. J., W. L. Marston, M. Dessing, L. Dudler, and W. R. Hein.1997. Distinct recirculating and non-recirculating B-lymphocyte pools in the pe-ripheral blood are defined by coordinated expression of CD21 and L-selec-tin. Blood90:4865–4875.


![FIG. 4. Theoretical fit of the model to the CFSE data. The percentages of CFSE�CFSE B cells (P [black squares]) and the ratio of the MFI of B�� cells to the MFI of B� CFSE� cells (I [open triangles]) were determined by flow cytometry analyses](https://thumb-us.123doks.com/thumbv2/123dok_us/168263.45407/8.585.78.510.81.683/theoretical-percentages-squares-triangles-determined-ow-cytometry-analyses.webp)