10-28-2019
Study of Human Hand-Eye Coordination Using Machine Learning
Study of Human Hand-Eye Coordination Using Machine Learning
Techniques in a Virtual Reality Setup
Techniques in a Virtual Reality Setup
Kamran Binaee [email protected]
Follow this and additional works at: https://scholarworks.rit.edu/theses
Recommended Citation Recommended Citation
Binaee, Kamran, "Study of Human Hand-Eye Coordination Using Machine Learning Techniques in a Virtual Reality Setup" (2019). Thesis. Rochester Institute of Technology. Accessed from
This Dissertation is brought to you for free and open access by RIT Scholar Works. It has been accepted for inclusion in Theses by an authorized administrator of RIT Scholar Works. For more information, please contact
Study of Human Hand-Eye Coordination Using Machine Learning
Techniques in a Virtual Reality Setup
by
Kamran Binaee
A dissertation submitted in partial fulfillment of the requirements for the degree of Doctor of Philosophy in the Chester F. Carlson Center for Imaging Science
College of Science
Rochester Institute of Technology
Signature of the Author
Accepted by
Coordinator, Ph.D. Degree Program Date
CERTIFICATE OF APPROVAL
Ph.D. DEGREE DISSERTATION
The Ph.D. Degree Dissertation of Kamran Binaee has been examined and approved by the dissertation committee as satisfactory for the
dissertation required for the Ph.D. degree in Imaging Science
Dr. Gabriel J. Diaz, Dissertation Advisor
Dr. Reynold Bailey, External Chair
Dr. Jeff B. Pelz
Dr. Christopher Kanan
Date
Study of Human Hand-Eye Coordination Using Machine Learning
Techniques in a Virtual Reality Setup
by Kamran Binaee
Submitted to the
Chester F. Carlson Center for Imaging Science in partial fulfillment of the requirements
for the Doctor of Philosophy Degree at the Rochester Institute of Technology
Abstract
Theories of visually guided action are characterized as closed-loop control in the presence of reliable sources of visual information, and predictive control to compensate for visuomotor delay and temporary occlusion. However, prediction is not well understood. To investigate, a series of studies was designed to characterize the role of predictive strategies in humans as they perform visually guided actions, and to guide the development of computational models that capture these strategies. During data collection, subjects were immersed in a virtual reality (VR) system and were tasked with using a paddle to intercept a virtual ball. To force subjects into a predictive mode of control, the ball was occluded or made invisible for a portion of its 3D parabolic trajectory. The subjects gaze, hand and head movements were recorded during the performance. To improve the quality of gaze estimation, new algorithms were developed for the measurement and calibration of spatial and temporal errors of an eye tracking system.
The analysis focused on the subjects gaze and hand movements reveal that, when the tem-poral constraints of the task did not allow the subjects to use closed-loop control, they utilized a short-term predictive strategy. Insights gained through behavioral analysis were formalized into computational models of visual prediction using machine learning techniques. In one study, LSTM recurrent neural networks were utilized to explain how information is integrated and used to guide
Acknowledgements
Special thanks to my advisor Dr. Gabriel J. Diaz for his guidance throughout my study Thanks to Dr. Jeff B. Pelz and Dr. David W. Messinger for their ever-lasting support Thanks to Dr. Christopher Kanan and Dr. Reynold Bailey for their invaluable mentorship
Contents
List of Figures 11
1 Introduction 15
1.1 Theories of Visual Perception: Ecological Vs. Constructivist . . . 16
1.2 Perception & Action . . . 19
1.2.1 On-Line Control of Action . . . 20
1.2.2 Internal Model based Control of Action . . . 21
1.2.3 Role of Prediction . . . 23
1.2.4 Hybrid Approach to Control of Action. . . 24
1.3 Overview of the Thesis . . . 24
2 Background 27 2.1 Human Visual System. . . 28
2.2 Study of Eye Movements Using Eye Tracking . . . 30
2.2.1 Electro-Oculography . . . 30
2.2.2 Video Oculography . . . 31
2.3 Virtual Reality in Research . . . 33
2.3.1 Behavioral Study in VR . . . 34
2.3.2 Sources of Perceptual Inaccuracy in VR . . . 35
2.3.3 Eye Tracking in VR . . . 36
2.4 Modeling Techniques . . . 37
2.4.1 Overview of Machine Learning methods. . . 37
2.5 Considerations for Modeling Human Hand-eye Coordination . . . 42
2.5.1 From Information Space to Action State . . . 42
2.5.2 Predictive Model . . . 44
3 Methodology 47 3.1 System Hardware, Motion Capture and Head Mounted Display . . . 47
3.2 System Software, Graphics and Eye Tracking Data Recording . . . 49
3.3 Parsing the Data: From Structured Text to Pandas Data Frames . . . 50
4 Studies in Predictive Eye-Hand Movement 53 4.1 Study1: Eye Tracking Calibration in VR . . . 56
4.1.1 Spatial Characterization . . . 59
4.1.2 Point Matching and Transformations. . . 60
4.1.3 Static Calibration Result . . . 60
4.1.4 Dynamic Spatial Calibration . . . 61
4.1.5 Dynamic Calibration Result . . . 64
4.2 Study2: A Common Predictive Strategy for Eye and Hand . . . 66
4.2.1 Statement of the Problem. . . 66
4.2.2 Methods . . . 70
4.2.3 Results and Discussion . . . 77
4.2.4 Summary of hypotheses and results . . . 90
4.2.5 General Conclusion & Discussion . . . 92
CONTENTS 9
4.3.1 Statement of the Problem. . . 96
4.3.2 LSTM-RNN Model of Predictive Behavior . . . 99
4.3.3 Sub-network Inputs and Outputs . . . 100
4.3.4 Architecture, Training and Evaluation . . . 101
4.3.5 Training and Testing Results of the Models . . . 102
4.3.6 Model performance. . . 102
4.3.7 Visual prediction, or a simple motor-to-motor mapping? . . . 103
4.3.8 Discussion and Conclusions . . . 106
4.4 Study4: Prediction Explained by Inverse RL . . . 109
4.4.1 Statement of the Problem. . . 109
4.4.2 Capturing Transitions Between Predictive and On-line Control Strategies 112 4.4.3 Experiment Design & Data Collection . . . 118
4.4.4 Results . . . 124
4.4.5 Discussion . . . 133
5 Discussion & Conclusion 135
6 Future Work 141
List of Figures
1.1 Visual Perception Theories . . . 18
1.2 Theories of Perception and Action . . . 23
2.1 Anatomy of human eye . . . 27
2.2 Cones and Rods Distribution . . . 29
2.3 Eye Tracking Pipeline. . . 32
2.4 Machine Learning Techniques . . . 38
2.5 Reinforcement Learner Agent . . . 41
2.6 From Information to Action. . . 44
2.7 Schematic of a Predictive Model . . . 45
3.1 Motion capture markers and head mounted display . . . 49
3.2 Motion capture software . . . 50
3.3 Panda data frames . . . 51
4.1 Eye Tracking Calibration Grid . . . 58
4.2 SMI Calibration Result . . . 59
4.3 Homography Results . . . 61
4.4 Gaze Error in Time . . . 62
4.5 Results for Different Calibration Methods . . . 63
4.6 Calibration Error vs Eccentricity . . . 65
4.7 Experiment Apparatus . . . 68
4.8 Different Ball Trajectories . . . 70
4.9 Success Rate Vs. Conditions . . . 77
4.10 Trajectory of the gaze ball in angular space . . . 79
4.11 Gaze-ball angular distance vs. time. . . 80
4.12 Ball’s angular displacement and gaze-ball angular distance . . . 81
4.13 angular velocity of the ball and its ratio to gaze velocity . . . 82
4.14 Gaze vs ball trajectory during blank period. . . 83
4.15 2D histogram of ball & gaze polynomial fits . . . 84
4.16 Paddle velocity vs. time . . . 86
4.17 Paddle movement & ratio of movement vs. conditions. . . 87
4.18 Visual prediction error vs. paddle prediction error . . . 90
4.19 Visual pursuit vs. paddle interception error. . . 91
4.20 The idea of a predictive model . . . 97
4.21 Experiment apparatus . . . 99
4.22 LSTM-RNN models architecture . . . 100
4.23 Prediction error vs. time for different models . . . 103
4.24 Prediction error of the model . . . 104
4.25 Result of ablation study . . . 107
4.26 Top-down view of experiment design. . . 110
4.27 Gaze and hand actions, gaze and hand states . . . 114
4.28 Distribution of Gaze and Paddle Displacement . . . 115
4.29 Timing of occlusion duration for each condition . . . 119
LIST OF FIGURES 13
4.31 Distribution of gaze-ball direction error vs visual tracking gain . . . 123
4.32 Hand velocity for all different conditions vs time . . . 128
4.33 Estimated reward modules for each condition . . . 130
Chapter 1
Introduction
Vision is our most dominant sense. Research estimates that eighty-five percent of our perception, learning, cognition and activities are mediated through vision [1,2]. But the term vision is more than just seeing an object. Vision is the process of deriving semantics, understanding concepts and creating a representation from the scene. It is a complex, evolved and developed set of functions that involve several skills. The ultimate purpose of the visual process is to arrive at an appropriate motor and/or cognitive response. An interesting feature of our visual system is that, not only most of its extremely complicated aspects are taken for granted, but also it’s hard to describe it with a computational model. Creating a model that serves in numerous circumstances and for many different purposes is extremely complicated since the functionality of our perception-action system depends on the task. This model takes input visual information and produces outputs. These outputs range from very low level meaningless features such as points, lines or edges to the high level semantic interpretations such as static shapes and/or moving objects or higher level motor commands and/or cognitive perception.
One important purpose of our visual system is to guide action [2]. Being the most dominant source of our sensory input signal, the accuracy of our actions highly depend on the quality of
the visual input [3,4]. Actions such as reaching, grasping and intercepting an object are among examples that rely upon coordination in time and space [5,6]. The goal of this research is to study this intricate relationship between visual processing system and the motor system in a controlled environment. We first aim to answer some basic questions related to theories of perception and action by creating a naturalistic environment and designing a controlled experiment to measure human performance and present the statistics of their behavior. Since our perception-cognition system relies on the current task in hand and it doesn’t have one general solution for all tasks, we need to focus on one paradigm [2,7,8].
In this study visually guided target interception is chosen as the main paradigm. The first two sections of this document provides background information and describes the proposed problem to be addressed. Here the fundamental theories behind perception for action are also reviewed. Furthermore, the history of eye tracking and virtual reality environments is reviewed while briefly explaining the functionality of our visual system. Also, the important considerations that need to be taken into account when modeling human visual-motor strategies are reviewed from the perspective of machine learning techniques and it builds the foundation for the follow up studies. Section three explains the requirements for system development, software and hardware details used in this study and the data analysis pipeline. In section four the results of multiple studies focused on predictive eye-hand movement strategies are presented. Finally in section five and six the author provides a conclusion and future directions for this dissertation.
1.1 Theories of Visual Perception: Ecological Vs. Constructivist
1.1. THEORIES OF VISUAL PERCEPTION: ECOLOGICAL VS. CONSTRUCTIVIST 17
process of perception. Theconstructivist theorythat posits, during processing, the bottom-up flow of information transitions from our eyes to a simple representation of the object and layer by layer this representation gets more complex and closer to meaningful copies of the scene in our mind, until it reaches a semantic understanding. In summary, the goal of vision from the constructivist perspective is to recreate a copy or a representation of the real world in our mind [1].
On the contrary the ecological theory of visual perception posits that visual perception or “awareness” happens from top to bottom where we only use the visual information available in the world to find the matching solution in our mind. From the ecological perspective, the goal of visual awareness is to present you with veridical presentations of the world around us [1]. In other words, information does not only flow from our eyes to our mind/brain, but the other way around. Such that we use the “optical invariants” available in the environment to find the matching presentation in our mind [1,7]. Gibson refers to “optical invariants” as the geometrical relationship between objects in our field of view that contains rich, sufficient and robust information [9]. As an example, when we are walking ahead, all surrounding objects in our field of view provide information about where and how fast we are moving. This rich field of vectors pointing toward the heading direction and their magnitude is proportional to our velocity. In this example, the optic flow vectors are an example of “optical invariants” that provides information about the speed of self motion during navigation. The reason that it’s called invariants is because its property is robust to distortions such as height change and head rotation.
The comparison between these two theories of information flow is shown in Figure1.1. In his review, William Warren compares the work of well known constructivist scholar David Marr with that of J.J. Gibson, the founder of the ecological framework [2]. As Warren summarizes, despite the fact that Marr’s approach has significant positive influences on the field, it suffered from some fundamental assumptions [2].
Warren cites two major shortcomings of the pure constructive theory:
de-Figure 1.1: Bottom-up vs top-down visual perception theories (Image adapted from [10]).
scending than ascending connections. This might be too complicated to be reduced to a set of modular independent parts made up of bottom-up sequence of operations. Therefore an approach that doesn’t take into account “top-down” constraints such as attention, the task or the intended action would not be successful [1,2,11].
2) Second, several studies show that the assumption that the goal of visual computation is to re-cover general-purpose description of a Euclidean, Newtonian world (known as “Inverse Optics”), would fail in many circumstances. It is shown in many studies that our perceptual judgments of metric Euclidean world such as depth, length, surface slant and curvature are systematically dis-torted. Also the problem of vision would be under-determined with no sufficient information in the two images [12,13].
[image:19.612.197.530.125.279.2]1.2. PERCEPTION & ACTION 19
In conclusion it is important to note that the goal of vision is not to recover a metric, 3D physical Euclidean description of the world, as implied by the theory of inverse optics. This opens up the possibility that there is sufficient information in the input to the eye itself to specify the scene properties we do recover. Through perception, we clearly recover some aspects of the object that enable us to distinguish, identify, and interact with 3D shapes. In fact, there are many weaker geometric properties that remain invariant under affine distortions and could support the perception of objects and scenes [1]. As Gibson said, “the environment to be perceived ... is not the world of physics but the world at the level of ecology.” Based on the studies mentioned in this section, the goal of vision is not to create a general-purpose representation of the world, rather, it becomes more like a collection of task-specific (top-to-bottom side by side with bottom-up) mathematical functions based on optical invariants available in the world [7,14]. In other words the goal of vision is determined by a model that perception is uniquely determined by information considering both of the two mentioned pathways. To paraphrase Gibson, “For each perceptible entity in the world, there must be a property of stimulation, however complex, that specifies it.”
In the following section we will briefly review the theories for how perception guides action, with the goal of emphasizing the difference between ecological vs. constructive explanations for the visual guidance of action.
1.2 Perception & Action
taking the action? What about feed-forward pathways that can be used to predict the subsequent movement?
The categorization proposed by Warren helps us to understand, differentiate and systematically test these overlapping ideas. Warren categorizes hypotheses in the field of perception & action into three major classes [15].
• strong on-line control
• strong model-based control
• hybrid control
Here we briefly review Warren’s study and provide examples for each of these categories. Most of these studies use target interception or locomotion paradigm as the most common form of visual-motor coordination task [3,5].
1.2.1 On-Line Control of Action
1.2. PERCEPTION & ACTION 21
strategies fail drastically when there is even a temporary loss of visual information, for example, due to temporary occlusion of the moving object [15,16].
1.2.2 Internal Model based Control of Action
In model-based control, action is guided by an internal representation of the actor and the physical world. The emphasis here is that the perceived visual information passes through a “strong” internal model that produces action via a clear mathematical formulation.
Craik originally introduced the concept of internal model in his well-received book,The na-ture of explanation [17]. He proposed that the brain “imitates” a physical process by use of an “internal model of reality.” As a result this method is capable of estimating external events in the physical world. Internal model control was used in engineering to tackle inherent shortcomings of a feedback loop such as delay [18]. Similarly by incorporating an internal model of the system i.e. musculoskeletal system, mobile robots improved their performance [19]. Wolpert believes that internal models are “putative neural systems that mimic physical systems outside the brain”, whose “primary role is to predict the behavior of the body and the world [20]”.
Unlike the on-line method that directly connects the human to the environment by use of available optical information, the internal model-based approach includes an internal model that encapsulates the world, the environment and the actor’s state. In other words the actor state is monitored either through visual information or motor efference, and is used to update the world model. Thus, the term internal model refers to an inner replacement of the world and it should be robust even if the sensory input is decoupled temporarily. Thus the internal model is playing an important role for controlling the action [21].
model approach will continue to work without significant loss of performance [6, 15]. For ex-ample, it has been proposed that, when catching a ball, one can form predictions of future ball position on the basis of an internal model that includes Newton’s laws, gravity and air resistance as the fixed parameters and takes ball initial position and/or velocity as input[6,15]. If the action is derived by an internal model of ball’s parabolic trajectory, when the quality of visual information is degraded (i.e., occlusion) the model performance should not deteriorate as much as a purely online form of control (i.e., ecological control).
Figure1.2shows the comparison between different control strategies for action. The top row shows the online control where there is a direct coupling of input visual information and action. Whereas in the middle row visual information is mediated by internal model to derive action.
Strategies that use no visual information are referred to as “offline strategies” [15,22]. For example, in the blind walking task, blind-folded participants are able to walk successfully to a target they have previously viewed [15]. Or, during a target interception task, if the target disap-pears or gets occluded by another object we might use internal model of ball trajectory. Also other studies show that spatial memory is another source that controls navigation in case of no visual input available [23].
1.2. PERCEPTION & ACTION 23
noted that a strong internal model approach should be applied to both domains, with or without reliable input visual information [15].
Mapping Feedback Visual Information Action/Behavior Mapping Feedback Visual Information Action/Behavior Internal Model Mapping Feedback Visual Information Action/Behavior Offline Strategies Online Control Internal-Model Control Hybrid Control
Figure 1.2: Theories of Perception and Action categorized by Warren [2]
1.2.3 Role of Prediction
explain how these machine learning based methods would provide us with the tools to achieve this goal.
1.2.4 Hybrid Approach to Control of Action
Under special conditions, such as when the target is occluded, or the available information about the moving target’s trajectory is inadequate, action may be guided in an “offline” manner. What is the exact implementation of this strategy is still an open question. The answer could be from a strong world model to a simple extrapolation of the current state of the environment. An alternative explanation is that control is mediated by a simple heuristic that falls short of an internal model, such as a simple visual-motor mapping or spatial-temporal memory. Warren calls this weak off-line strategy as a complement for on-off-line control without placing an undue computational burden on the visual motor system [15,22].
Therefore according to hybrid hypothesis, on-line control is normally incorporated in the pres-ence of reliable visual information. In case of occlusion, target disappearance or any type of visual information withdrawal, off-line heuristic or mapping strategies take place. These strategies are weak, inaccurate and short-lived, but they still provide reasonable solution to drive motor com-mands [15]. As an example, an internal model of ball trajectory may be expected to generalize to new conditions such as ball distance, speed and launch angle. In contrary a heuristic model is task-specific and hard to generalize to new tasks with new parameters even in the same domain.
1.3 Overview of the Thesis
1.3. OVERVIEW OF THE THESIS 25
Chapter 2
Background
In this section the main features of human visual system are briefly reviewed to help understanding the behavioral findings that we will discuss in the results section. Although physiology of our eye can be broken down into several detailed sub-systems, our purposes require only a review of the components involved in the extraction of information from the world.
Figure 2.1: Anatomy of human eye. Image courtsey of [27]
2.1 Human Visual System
It is no exaggeration to say human eye is the most fascinating optical system. It is an extremely efficient imaging system that transforms light into electrical signal using an adaptive compression method. The pupil is the aperture of this imaging system, its size is adaptively tuned to the ambient light. Light passes through the cornea, which has approximately two-thirds of the eye’s total optical power, and then passes through the lens. Lens thickness can be modified by stretching or releasing the ciliary muscles, and this determines its contribution to optical power, as well as the radius of focused light upon the retina. When we change our focus point from a far distance to a near distance object, the optical power of the lens changes accordingly so that the focal plane falls on the retina as shown in Figure2.1.
2.1. HUMAN VISUAL SYSTEM 29
of our visual field available for us in high quality, we need to make eye movements to bring the objects of interest on our fovea (i.e. to foveate the target). In the following subsection we review eye tracking methods and describe different types of eye movements.
2.2 Study of Eye Movements Using Eye Tracking
Since the focus of this dissertation is the coordination between perceived visual information and performed action, it is important to provide a general background about different methods of eye tracking. The goal here is to introduce eye tracking techniques from a general perspective. Further details on different techniques and the history of eye tracking can be found in [29,30].
The question of how/why/when do we move our eyes has been of interest since early 19th century. In 1908 Edmund Huey designed one of the very first eye trackers using a contact lens like device with a hole for the pupil. Later on Yarbus contributed to this field through the invention of several new apparatuses for the study of eye movements. In his influential bookEye Movements and Visionhe wrote about the relationship between fixation and regions of interest and proposed important questions to the psychology community [31]. Prior to Yarbus, Guy T. Buswell used light beams which were reflected on reader’s eyes and recorded them on film. Buswell’s research, for the first time, revealed important findings about our eye movements while reading a text. There are different classes of eye tracking techniques. Here we only explain two of these methods : 1) electro-oculography, 2) video oculography.
2.2.1 Electro-Oculography
2.2. STUDY OF EYE MOVEMENTS USING EYE TRACKING 31
2.2.2 Video Oculography
Video oculography is based on an image of the eye and use of computer vision/image processing methods to find the position of the pupil and the cornea. The majority of the current eye tracking methods used in consumer electronic devices are video based systems. These methods use one or multiple cameras alongside with visible light or infrared light to illuminate the surface of the eye. There are multiple reflections of the light off of the surface of the eye. By using an image processing algorithm a gaze vector emanating from the pupil is calculated. The details of the process of calculating the gaze vector can vary significantly depending on the hardware, optics and software specs of a video based eye tracking system. One can simplify the steps as follows: 1) capture image(s) of the eye, 2) apply an image classification technique in order to find the position of different key elements of the image (cornea reflection, pupil center, etc.) 3) Use 2D or 3D geometry of the image(s) and the eye to calculate the gaze vector corresponding to the video frame.
There are desktop and portable versions of video based eye tracking systems. Some desktop based eye trackers have temporal resolution of up to 1000 Hz (Eye Link Inc. [32]).The portable eye trackers are more used for less constrained studies, where the subject wears the device and freely moves his or her eye and head. In addition, there are desktop eye tracking devices that allow a certain range of head translation and rotation with varying range of accuracy (Tobbii 4C tracker [32]]).
refresh rate in both portable and desktop setup.
(a) (b)
[image:33.612.174.559.214.537.2](c)
2.3. VIRTUAL REALITY IN RESEARCH 33
2.3 Virtual Reality in Research
When studying visually guided control of action, it is very important for the experimenter to have full control on experiment parameters and sometimes this comes with constraints on the condition in which the subject would perform the task. For example, in order to study motion perception for the purpose of target interception, 2D targets were presented to the subjects and their task was to predict whether the moving circle would hit a 2D line both presented on a 2D screen. A desktop eye tracker recorded subjects gaze movements and a button press was used to register their response [33]. There are several other influential studies that adopted head-fixed desktop eye tracking system and revealed important findings about our visual system and eye movements. One important characteristic of a head-fixed desktop eye tracking system is that the viewer’s position relative to the screen (stimulus) is fixed. This provides accurate measurements of stimulus physical properties such as angular position and velocity.
Although studies based on head-fixed eye trackers help us better understand the mechanisms underlying visual perception and provide us with fundamental knowledge about our visual-motor processing, however some researchers would doubt whether these results are generalizable to a more realistic condition with free movements of the head and the hands. For example when someone is playing soccer and trying to predict the interception point, what type of additional source of information could they be using while moving their head and body freely in 3D space. Therefore, there is always an aspect of natural behavior that is being missed and could create biases in results or changes in behavior.
for squash players while they were wearing portable eye tracker [34]. This study explains the pre-processing steps required in order to analyze the eye tracking data with respect to sometimes noisy low quality image of the scene camera.
The recent developments in Virtual Reality technology has made these devices more ergonom-ically pleasant for users and opens an opportunity for researchers in the field of vision science. Since the VR content is pre-computed, the geometry of the virtual entities are known. Since the position of real and virtual objects are precisely calculated by the physics engine and stored during the data collection, there’s no need for post-hoc recalculations of the stimulus. Unless for the pur-pose of spatial or temporal calibration of the VR system. Another important added value for use of VR in behavioral studies is the expedited time for prototyping and redesigning the experiment parameters which would be much harder in a real world data collection setup.
This project while being inspired by previous studies in naturalistic environments [3,35,36] uses a VR system in order to study eye movements in a naturalistic environment while presenting calibration techniques to make sure the accuracy of measurements and the stimulus remains valid. To provide a background, in the following subsection a brief overview of other studies that used a VR setup is presented.
2.3.1 Behavioral Study in VR
2.3. VIRTUAL REALITY IN RESEARCH 35
need of the paradigm. For instance, in a reaching experiment where the subject is instructed to tap on a moving target on the screen, it is more important that the system has very low latency with respect to user’s interaction than it is to have a very realistic appearance. In contrary, in a fully immersed VR setup that uses head mounted display (HMD) there are many parameters that can destroy the feeling of being immersed in the virtual environment. Optical aberrations introduced by the display, limited field of view and any spatial/temporal error in the system would cause significant biases on subject’s perception and hence their motor response. Therefore in many stud-ies that use immersive VR environments rely upon a meticulous process of spatial and temporal calibration [37–43].
2.3.2 Sources of Perceptual Inaccuracy in VR
To reduce the effect of spatial or temporal misalignments of the VR system on the results of a behavioral study, all aspects of a VR experiment need to be calibrated. This includes spatial and temporal calibration. Several studies that use motion capture system undergo a rigorous calibra-tion procedure to make sure the recorded posicalibra-tion of the markers are within the range of required accuracy. These systems either use anactivemarker technology where the markers that are being tracked are actively emitting visible/non-visible light or they usepassivemarkers where the mark-ers are made up of a retro reflective material. Both of these two types of motion tracking systems use multiple cameras (or sensor arrays) plus multi-view geometry to estimate the 3D position of markers within the tracking volume. During a typical calibration process system uses predefined reference markers to minimize the spatial error along side defining the origin of the capture volume [44].
corrected for especially during run time. Therefore, system latency has to be taken into account during experiment design and system development. Typically, behavioral studies in VR measure and report their so calledend to end latencyin order to make sure the apparatus did not create negative perceptual effects on the subjects [45–47].
2.3.3 Eye Tracking in VR
Eye tracking in an HMD based VR system is challenging due to three major reasons. Mechanical mount, display and slippage makes eye tracking more challenging compared to a portable eye tracking setup. Considering the size of a light head mounted display it is a challenging problem to find the optimum location for the built in eye tracking hardware.
Eye tracking camera needs to have a good image of the eye while it is being illuminated by IR LEDs. This makes the mechanical design challenging so that it’s not occluding the display. SMI uses single sided mirror to overcome this problem [48]. Although major VR companies are trying to improve their display technology, but distortion is inevitable due to the fact that most of the head mounted devices are designed to be for consumer level products. Therefore the quality of the optics and the display is far from perfect in commonly used systems in the market. Since the presented stimulus is distorted by the display and lens, the eye tracking calibration procedure needs to take this effect into account.
2.4. MODELING TECHNIQUES 37
2.4 Modeling Techniques
There are several modeling techniques that can be applied to human perception-action study. The rich literature of behavioral study covers wide range of models from Bayesian statistics to classi-cal dynamic control systems. In this section a brief overview of machine learning techniques is presented. There are two major classes of machine learning that fit the goal of current research. Therefore it is important to provide a general perspective toward different goals of machine learn-ing techniques to explain the rationale behind the choice of methods used in this study.
2.4.1 Overview of Machine Learning methods
Machine learning is a science of data analysis, interpretation and classification that gives “com-puters the ability to learn without being explicitly programmed” according to Arthur Samuel [50]. This field of computer science has evolved from pattern recognition and computational learning theory in artificial intelligence. Which is exploring the data, finding patterns, representations and models to be able to predict the interpretation of an unseen data sample or generally make de-cisions. These methods allow machines or algorithms to learn these representations and even explore newly added sample data to their decision base. There are numerous applications of ma-chine learning these days such as computer vision, image classification, robotics, data mining, etc. There are three major classes of machine learning methods: 1) supervised learning, 2) unsuper-vised learning and 3) reinforcement learning [49,51,52].
Supervised Learning:
(a)
[image:39.612.232.496.215.547.2](b)
2.4. MODELING TECHNIQUES 39
mathematical notation, in a supervised machine learning technique we have inputxand outputy
available and the goal is to find functionF that relates input and output as follows:
y=F(x); wherexandyare known andFis unknown
Figure2.4ais a flow chart representing the major steps involved both training and testing a su-pervised model for image classification. During the training phase the model parameters are optimized by feeding the training instances and minimizing the output error with respect to the desired output (label). During testing, the model is used to generate output based on the optimized parameters, in other words the model is used to predict the best label for the input image.
Unsupervised Learning
The goal of an unsupervised learning algorithm is to find the patterns in the data so that the data can be interpreted or represented in a more meaningful way. More precisely as humans we’re always interested to infer information from the data and this inference highly depends on the rep-resentation of the data. Data clustering is a perfect example of an unsupervised algorithm. Where the algorithm groups together the “close” data points so that it conveys an overall understanding of how and in what directions the data is distributed/clustered. Using the same mathematical notation here we only havexand the goal is to findF which is a better and more intuitive representation
of the original data:
F(x); wherexis known andF is unknown
Reinforcement Learning
The goal of reinforcement learning method is to allow the algorithm to decide what label or rep-resentation is the best for the data. Reinforcement learning can be considered both a supervised and unsupervised class of machine learning. In a reinforcement learning technique the algorithm (the agent) interacts with the environment by taking an action, based on this interaction it observes its own state and the reward (reinforcement signal) that it receives from the environment [53,54]. By repeating this so called exploration-exploitation loop several times, the agent gradually learns what is called an optimum policy. The learned optimum policy through experiencing different combination of states and actions, guarantees the maximum long term reward for the agent. A re-inforcement learner agent instead of learning pairs of desired inputs-outputs, learns the optimum policy (actions) that maximizes the predefined reward function. Using the previous mathematical notation, a reinforcement learning technique could be described as the process of observing sev-eral input statesxand their corresponding reward valueZ(x)and learn the optimum policyF that
generates the best outputyat every state. Note that, actions that are the means of moving between
states could be included inxas state-action pair [53].
y=F(x) & Z(x); wherexandZ(x)are known andF is unknown
As shown in Figure2.5the agent can interact with the environment to find the optimum policy based on exploration & exploitation.
2.4. MODELING TECHNIQUES 41
(a) (b)
Figure 2.5: Reinforcement learning agent and its observation-exploitation loop to learn optimum policy. Images courtesy of [53]
gaze, head and hand movements. Once we show that the model is reproducing human eye-hand movements with a reasonable range of error, we study the model to learn human visual-motor strategies. This approach allows us to understand the underlying control mechanisms through a surrogate model. Using a systematic approach we test the model to draw parallel lines between how the simplified model operates to understand how the brain would work.
2.5 Considerations for Modeling Human Hand-eye Coordination
Consider a ball catching paradigm where the subject is instructed to intercept with a flying ball in his field of view. The ball launches from a certain distance, flies in the air following the physics of gravity and passes by the subject. Intuitively we expect the subject to track the ball with a combination of head + eye movements, initiate the hand movement and reach to catch the ball. To be able to investigate the contribution of online or internal model based control, let’s assume that we can make the ball disappear for a short period of a time, called “blank duration.” The hypothesis is that subjects mostly rely on online control strategies as long as the ball is visible and use “some type of” offline or internal model or some simple heuristics to guide their hand movement during the blank prior to attempted catch.
To determine what is the nature of these strategies and how long they are valid in time we pro-pose to take two important steps. First create a naturalistic environment and record human hand, head and eye movement data and second to create a model that can be systematically investigated. By using the human data set we can get an understanding of what is the common pattern of be-havior and based on that we can probe, modify and recreate different models to understand and visualize these strategies. We propose to use a virtual reality setup to create a naturalistic environ-ment that would make our modeling results compatible to real world situation. Also, because we are using a head mounted display to render the virtual content we can investigate the role of visual information available in the image. In this section we review different aspects of human behavior during a visually guided target interception task. We expect the proposed model to capture these behaviors or at least provide a systematic way to probe the presence of these characteristics.
2.5.1 From Information Space to Action State
2.5. CONSIDERATIONS FOR MODELING HUMAN HAND-EYE COORDINATION 43
forms and based on that it produces the appropriate action (See Figure 2.6). In our paradigm, when the ball is moving in our field of view studies show that one can couple hand position to the perceived passing distance of the ball, which is instantaneously specified throughout the ball’s approach in the form of the optical variable ✓˙/˙, where✓˙is ball lateral velocity and ˙ is ball expansion rate [56]. The proposed model should allow us to probe into these relationships. Also it should be noted that not all the input sensory information is visual. The human vestibular system is sensitive to orientation and acceleration during movement, and this provides important information that can be used to drive head and eye movements [57]. Furthermore our brain stores a copy of signals sent to muscles that is called “efference copy.” This sensory signal provides non-visual information about the position of our hand. In conclusion as it is shown in Figure2.6there are visual and non visual sources of information that contributes to motor action when performing a hand, gaze or head movement. We can formalize this relationship as follows:
yj =F(x1, x2, ..., xi)(1)
wherejiterates on different actions andiiterates on different input sensory information (such as
Figure 2.6: From information space to action state. Images adapted from
2.5.2 Predictive Model
2.5. CONSIDERATIONS FOR MODELING HUMAN HAND-EYE COORDINATION 45
extract information about its movement during a so calledintegration timeand use that information to predict an action that is going to be taken in the future. This is basically a mapping between previously available sources of information and future action in time. This framework can be applied to model hand-eye coordination both from the perspective of online control and internal model.
Chapter 3
Methodology
In this chapter the data collection procedure using motion capture system, VR head mounted display (HMD) and built-in eye tracker is explained. In order to design an experiment to study human behavior in a VR setup it is important to measure the accuracy of each VR sub-system to make sure that the perceived VR stimulus is as close as possible to the real world stimulus. Furthermore, our data recording and processing pipeline is explained so that the reader could reproduce the results. First, the system hardware specifications are explained and then the software used for graphics rendering and data recording is discussed and finally the data processing and analysis is briefly explained.
3.1 System Hardware, Motion Capture and Head Mounted Display
In our experiments, we usePhaseSpace Inc. [64] motion capture system to record movements of certain objects. i.e. the head mounted display is being tracked using a set of active LED markers positioned precisely on it and this mode is called rigid-body tracking. The motion capture system is composed of 14 PhaseSpace cameras placed in the ceiling. These cameras are horizontal and
vertical linear detectors that are sensitive to the red LED lights on generated by the active marker modules. The active markers have individual IDs (A, B, C, D & E) that corresponds to the blinking frequency and shift controlled by the server. To be able to get position and orientation of for example the head mounted display, the marker IDs on the device need to be defined for the server first. This way the server would be able to detect the LED markers according to the predefined list. After calibrating the motion capture system using the calibration wand and defining the world coordinate system axis and origin, then the server starts streaming the 3D position and orientation (using quaternions) of any regid body upon clients request. This is shown in Figure3.2.
Stimuli were delivered by an Intel i7-based PC with an NVIDIA GTX 690 connected to the Oculus Rift DK2 head mounted display at 75 Hz, and an NVIDIA GTX 760 connected to the experimenter’s desktop display. The computer ran Windows 7, and the virtual environment was rendered using the Vizard Virtual Reality toolkit by Worldviz(Vizard 5.1, 2015). Physics were simulated using the OpenODE physics engine (Open Dynamics Engine, 2009) so that ball trajec-tories matched those expected within a real-world environment in the absence of wind resistance (Figure3.1). Collisions between the ball and the paddle or other surfaces was also detected using the physics engine. To improve the fidelity of the physical simulation and collision detection, the physics engine was updated 10 times between frames (e.g. 750 Hz).
3.2. SYSTEM SOFTWARE, GRAPHICS AND EYE TRACKING DATA RECORDING 49
periphery (10 < F OV <30 ). This method is described in more detail in chapter 4.
Figure 3.1:A.Subjects wore an Oculus DK2 with integrated SMI eyetracker with a sampling rate of 60 Hz. B.The experimenter’s desktop view of what the subject saw inside the helmet. The lines receding in depth represent the left and right gaze vectors, and the text in the upper left encodes trial number, block number, and time-stamps. The red disc represents the face of the paddle, on which can also be seen the red virtual ball.
3.2 System Software, Graphics and Eye Tracking Data Recording
As mentioned above, the VR graphical environment was created in Vizard 5 software provided by
appear at certain location and updated based on consecutive key press.
Figure 3.2: The view inside head mounted display, the motion capture software markers for paddle and the view on experimenter monitor that also shows the rendered right and left gaze vector.
3.3 Parsing the Data: From Structured Text to Pandas Data Frames
3.3. PARSING THE DATA: FROM STRUCTURED TEXT TO PANDAS DATA FRAMES 51
[image:52.612.147.480.320.560.2]data frame is the number of trials. This allowed us to store several metrics and analysis results for each trial individually. The value of the data collection pipeline used in this study becomes more clear when we consider the total data collection, data parsing and analysis time. As an example, for a 150 trials ball catching experiment, from the time that the subject is prepared to start the experiment with the instructions, to the time that subjects initial statistical analysis is calculated, is less than 45 minutes. This allowed us fine-tuning the study using faster and more efficient iterations.
Chapter 4
Studies in Predictive Eye-Hand
Movement
In this chapter a series of studies focused on predictive eye-hand movements is presented. Each study has been designed to address questions related to the role of online and predictive mecha-nisms in visually guided control. In order to study different hypothesis concerning human visual-motor behavior, we created experiments in which subjects where immersed in a VR ball catching simulator. Use of virtual reality allowed us to record subjects ocular-motor behavior while they were free to move their head and hand in a natural setup. Thus increases the chances that our findings will generalize to the natural context. Here we briefly summarize the studies, and their contribution towards the understanding of predictive strategies for control of action.
In order to record subject’s eye movements we used a built-in eye tracker inside head mounted display (HMD). However, our initial measurements revealed that the accuracy of the eye tracking system using only the calibration routine provided by the vendor is below the range of our scientific application. Therefore, the first study proposes a post-hoc calibration routine that reduces the spatial/temporal errors of a built-in eye tracking system throughout the data collection procedure.
The second study presents a VR ball catching study that the subjects were instructed to inter-cept a moving virtual ball while it disappeared midway through its parabolic trajectory. In order to successfully catch the ball, subjects had to adopt a predictive control strategy. We first investigate whether subjects engage in visual prediction when tracking the ball and if they did whether their predictive eye movements were correlated with their hand placement. We focused on subjects eye and hand movements when the virtual ball disappeared and show whether the temporal constraints of the task modulates the correlation between predictive eye and hand movements.
The third study utilizes machine learning models to test theories of visual prediction. Specif-ically, the model was designed to test the sufficiency of predictive control using a minimal repre-sentation between previously observed visual and kinesthetic information for explaining subject behavior made in prediction of a future state. This model is implemented as a Long Short-Term Memory Recurrent Neural Network (LSTM-RNN) architecture that uses current and previous in-formation in order to predict the gaze-hand movement at a distant time into future. In addition, we investigate the significance of input source of information in guiding prediction.
55
4.1 Study1: Eye Tracking Calibration in VR
Eye movement data is widely used to scientifically study human performance. The spatio-temporal accuracy of this data is intimately tied to the technology utilized for capture. Common eye track-ing systems in use today are video-based pupil-center corneal-glint-reflection eye trackers. Such trackers can have varying degrees of intrinsic error depending on the properties of the hardware (cameras resolution, sampling frequency, etc.) as well as the data recording conditions (e.g., stimuli luminance and head movements) [29,65]. Recent improvements in tracking technology integrate a 3D model of surface of the eye. Using multiple LEDs for illumination, this method can robustly estimate pupillary position based on the deformation of the corneal reflections. Depend-ing on the research scenario, even small amounts of trackDepend-ing error can have detrimental effects. For example, even a 0.5 offset of gaze location can lead to widely different conclusions about dwell time on areas of interest (AOI)[29].
Eye tracking systems have limited levels of accuracy that typically depend on a wide variety of physical, implementation, and environmental factors. For simplicity, many users rely on manu-facturers’ claims as to reliability and accuracy. However, the emergence of new technologies and curiosity about claimed versus actual, pragmatic accuracy has led to interrogation into the inherent properties of these systems [30,66]. To minimize error, especially in scientific experiments, it is common to employ so-called characterization and/or calibration methods.
4.1. STUDY1: EYE TRACKING CALIBRATION IN VR 57
certain scenarios[68].
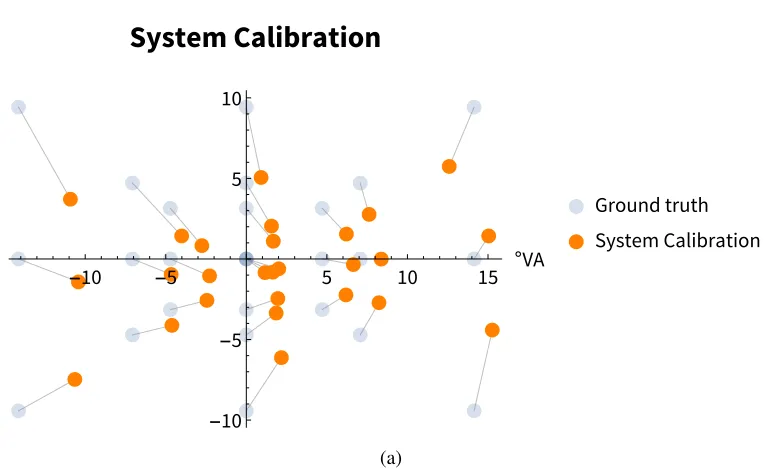
The focus of this study is to present a novel calibration method, suitable for Virtual Reality (VR) and other head-mounted eye tracking applications. Virtual reality techniques are increasing in popularity across many research disciplines[67, 69]. The addition of integrated eye tracking systems has provided a new perspective for vision scientists, allowing the study of the human visual system in a more naturalistic and less constrained environment. Tracking error is a crucial issue when wearing a Head Mounted Display (HMD) in a VR setting.Because subjects are free to move their head and explore while immersed in the virtual environment, a second source of error arises with the shifts and movements of the HMD. Our method uses binocular eye tracking of 27 spherical ‘ground truth’ objects at 3 different depths. We use well known 2D point matching algorithms to find a homography that minimizes the error at these different depths. We then extend this method from a static calibration to a dynamic one that takes place throughout the experiment. Figure4.1illustrates the characterization setup. We refer to this grid of objects as the ’ground-truth’, as viewed by a 3rd-person from inside the VR (left), and as projected onto the display of the HMD (right). Here the avatar represents the experimental subject, wearing an HMD, shown with binocular gaze vectors obtained from the in-HMD eye tracker. In the VR world the ground-truth occupies an equally spaced volume of 3⇥ 3⇥3 spheres. This volume is located 2 m from the subject, spaced 0.6 m horizontally, 0.4 m vertically, and 2 m in depth. We scale the radius of the spheres such that they subtend an equal amount of visual angle (150), regardless
subsequently repeat the 27 location presentation / collection task.
In order to properly characterize the system and acquire relevant experimental data we must calculate a 3D gaze vector into the VR world. Our calculation starts by placing a fiducial node into the 3D VR world coordinate system. We call this the ’cyclopean eye node’. Its location is continuously updated using motion capture data from markers placed on an Oculus HMD. The right and left eye nodes yoke to the cyclopean eye node, based on their inter-ocular distance (IOD).
Using ray-tracing and knowing HMD screen’s distance to the cyclopean eye and its resolution, we can calculate the subject’s gaze point on the screen. We refer to this as the point-of-regard or POR. Since the ground-truth objects are ’attached’ to the subject’s cyclopean eye, the true PORs remain the same regardless of head location or rotation. We calculate the gaze vectors for the right and left eyes using the aforementioned eye nodes, and calculate their respective PORs, along with cyclopean POR which is their average.
-10 -5 5 10 °
-10
-5 5 10
° Ground truth
(a)
4.1. STUDY1: EYE TRACKING CALIBRATION IN VR 59
-10 -5 5 10 15 °VA
-10 -5
5 10
System Calibration
Ground truth System Calibration
[image:60.612.118.502.120.355.2](a)
Figure 4.2: SMI calibration result
4.1.1 Spatial Characterization
4.1.2 Point Matching and Transformations
The problem consists of finding a transformationT such that locations in the observed locations
Omap as closely as possible to the ground-truth,G. The result of this transformation is a form of
isomorphism called a homography,H[68].
Random sample consensus (RANSAC) is an iterative method to estimate parameters of a math-ematical model from a set of observed data which contains outliers [70]. In this case two sets of known ground truth and observed POR are the inputs and the output is a linear transformation that minimizes the error between two input sets. RANSAC is non-deterministic but able to deal with outliers and noisy data points efficiently.
Other methods, such as linear fitting of the locations via singular value decomposition (SVD) prove useful for scenarios such as ours where the distortions are largely linear and regular. In these algorithms, the absolute correspondence of points may or may not already be known. In our case, we know the corresponding data for each gaze position, making the task somewhat simpler. Here, we use RANSAC and SVD fitting to determine the transformationT to mapOG ! G. We can
then useT to create homographiesHof other observed dataO.
4.1.3 Static Calibration Result
4.1. STUDY1: EYE TRACKING CALIBRATION IN VR 61
-10 -5 5 10 15 °
-10 -5 5 10 ° RANSAC
-15 -10 -5 5 10 15 °
-10 -5 5 10 ° SVD Homography Ground Truth RANSAC SVD (a)
Figure 4.3: Homography Results
but with similar variance as RANSAC,x¯err= 1.18 , serr= 1.03 .
Results demonstrate that we can improve on the vendor-supplied calibration by further trans-forming the resulting gaze data. Both the RANSAC and SVD homographies are the result of linear fractional transformations, computed using the vendor calibrated gaze positions. The RANSAC method results in an overall 18% reduction in error while the SVD method provides a further 51% reduction. Although these results promise to significantly reduce the angular error, a further challenge remains. Can we use this calibrated data throughout the timecourse of the experiment? Furthermore, can we compensate for variations introduced by the mechanical displacement of the VR HMD?
4.1.4 Dynamic Spatial Calibration
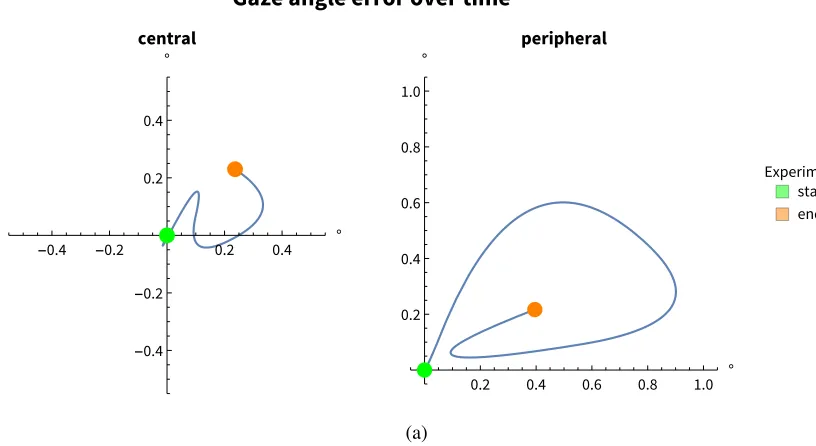
-0.4 -0.2 0.2 0.4 °
-0.4
-0.2 0.2 0.4
0.2 0.4 0.6 0.8 1.0 ° 0.2
0.4 0.6 0.8 1.0
Experiment start end
[image:63.612.156.564.138.361.2](a)
Figure 4.4: Gaze error for two calibration points in time
calibration over the entire timecourse of an experiment. Figure4.4demonstrates these two sources of error over time. To compute this, we showed ‘ground-truth’ locations at various timepoints throughout the experiment and asked the subject to fixate on them. We performed a time-varying cubic interpolation through the resulting gaze locations, resulting in the paths shown in the figure. The left graph shows the angular drift of the gaze when looking at a ‘ground-truth’ location at the center of the visual field. Whereas the right graph shows a point in the periphery. The drift of the central point wanders around the ‘true’ 0 location but the peripheral gaze wanders through almost a full degree.
contin-4.1. STUDY1: EYE TRACKING CALIBRATION IN VR 63
Method
x
errs
errSystem
2.90
1.60
RANSAC
2.39
1.11
SVD
1.18
1.03
Dynamic SVD
0.538
0.0668
Figure 4.5: Results for different calibration methods
uously throughout the experiment.
We use the same experimental task, apparatus, and virtual environment setup as shown in Figure4.1.During the fixation period we acquire a batch of 100 uncorrected samples of the gaze at 60 Hz. We perform a Gaussian weighted average of these locations and classify this as the fixation location. As the experiment proceeds, a randomly selected ground-truth sphere appears in between batches of 3-5 non-calibration, ball-catching trials. We gather the same gaze information as in the initial presentation. This provides a time-varying set of uncorrected locations, relative to the ground-truth location. From this time series we can generate the paths of the uncorrected gaze, as shown in Figure4.4, throughout the experiment.
By combining the uncorrected gaze time-series for each of the 27 ground-truth locations, we establish a functionP(t)that returns the temporally interpolated grid of 27 gaze locations at timet.
4.1.5 Dynamic Calibration Result
Table4.5shows the overall results for the dynamic technique, along with the previously described methods. Note that we average the error reported for the dynamic method over space and time. That is, the error at any particulartwill be different by a small amount as the quality of fit of the
transformation varies. However, as you can see, with an average magnitude ofx¯err = 0.538 and a variability of onlyserr = 0.0668 this method outperforms the static methods.
As we have previously noted, it is usually a good strategy to optimize the tracking accuracy in the center, e.g. ‘straight ahead’, viewing angle. The subject can easily turn their head in a VR environment to make a location ‘more central’ when necessary. Still, in a perfect world, the accuracy around the periphery should be high as well. Figure4.6shows a comparison of the static and dynamic methods’ performance as a function of gaze angle eccentricity. The projection of the ground-truth spheres onto the HMD display occupied an region of roughly±16 from the display center. For the best static correction (the SVD), shown in blue, error increases in both magnitude and variability as the screen locations become more peripheral. There is also slightly more central error. The dynamic correction reduces both the magnitude and the variability of the error over the whole range of eccentricities.
We set out to characterize the eye tracking error in our current VR HMD setup and to develop methods of minimizing these static and dynamic errors. Using transformations derived by compar-ing raw data with a ground truth we were able to reduce error significantly. By uscompar-ing the dynamic calibration method we were able to further reduce error that occurs as a result of movement and calibration drift over time by constructing a continuous mapping of transformations. These trans-formations are time-specific and compensate for instantaneous error as well as global, constant error.
4.1. STUDY1: EYE TRACKING CALIBRATION IN VR 65
0 5 10 15 eccentricity°
0.5 1.0 1.5 2.0 2.5 3.0 3.5error°
Gaze angle error by eccentricity
Single SVD Dynamic SVD
(a)
Figure 4.6: Calibration Error vs Eccentricity
the assistance of GPU acceleration. However, since interpolation takes the ‘future’ locations of gaze position into account a different technique needs to be employed. We have experimented with Kalman-filter and ‘hold-left’ time-series approximations of our data and still are able to achieve satisfying results, though not quite as good as our off-line methods.
4.2 Study2: A Common Predictive Strategy for Eye and Hand
4.2.1 Statement of the Problem
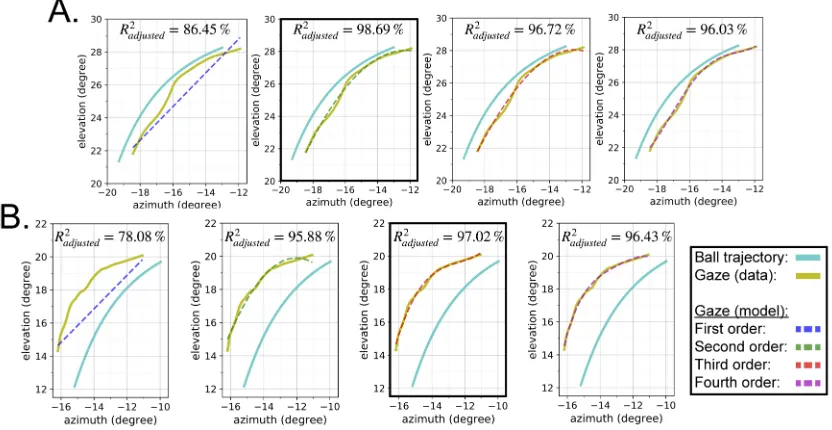
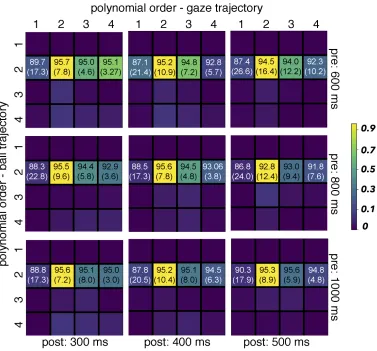
Although attempts to intercept a ball in flight are often preceded by predictive gaze behavior, the relationship between the predictive control of gaze and the effector is largely unexplored. The present study was designed to investigate the influence of the spatio-temporal demands of the task on a switch to the predictive control. Ten subjects immersed in a virtual environment attempted to intercept a ball that disappeared for 500 ms of its parabolic approach. The timing of the blank was varied through manipulation of the post-blank duration prior to the ball’s arrival, and the shape of the trajectory was manipulated through variation of the pre-blank duration. Results reveal that the gaze movement trajectory during the blank was curvilinear, appropriately scaled to the curvature of the invisible moving ball, and the gaze vector was within 4 degrees of the ball upon reappearance, despite 10-13 degrees of ball movement. The timing of the blank did not influence the accuracy of predictive positioning of the paddle at the time of ball reappearance, indicated by the distance of the paddle relative to the ball’s eventual passing location. However, analysis of trial-by-trial covariations revealed that, when the gaze vector more accurately predicted the ball’s trajectory at reappearance, the paddle was also held closer to the ball’s eventual passing location. This suggests that predictive strategies for paddle placement are more strongly mediated by the accuracy of gaze behavior than by the observed range of trajectories, or the timing of the blank.
intercep-4.2. STUDY2: A COMMON PREDICTIVE STRATEGY FOR EYE AND HAND 67
tion of a target moving in two dimensions [73], perhaps due to extra-retinal contributions from smooth pursuit before visual feedback about the moving target’s position is removed (e.g. through occlusion, or target blanking).
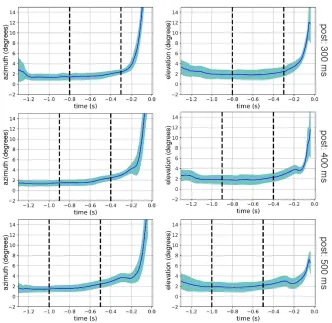
This study has been designed to investigate the factors that mediate the strength of the relation-ship between visual prediction and movements of the hand and body when attempting to intercept an object moving in depth. Although prediction may be accomplished through a ”prospective” coupling of behavior to visual information that forecasts a likely future state [74], this study more specifically focuses on predictive behavior that is separated in time from the sensory information that informed the control strategy. Our approach to studying prediction was to immerse subjects in a virtual reality (VR) environment in which the task was to use a hand held, motion-tracked badminton paddle to intercept a launched ball moving along a parabolic flight over a distance of approximately 20 m to a location within the subject’s reach (Figure 4.7). Upon successful in-terception, the virtual ball would stick to the paddle for a brief duration before the end of the trial, providing visual feedback about the accuracy of paddle placement before the ball would disappear, and the next trial would begin. To promote predictive control strategies for gaze and the hand/paddle, the ball was made invisible (or ”blanked”) for 500 ms on each trial during its parabolic flight towards the subject. The duration between the ball’s reappearance and its arrival at the subject or, post-blank duration was limited to 500, 400, or 300 ms.
Our first hypothesis is that participants will engage in visual prediction through the blank period. This assumption is supported by several studies of gaze behavior prior to interception in naturalistic conditions [34,61,62,75,76]. The accuracy of the visual prediction will compare the position and velocity of the subject’s gaze behavior at the end of the 500 ms blank to the position and velocity of the ball at the same frame: at the time of reappearance, prior to the availability of post-blank visual information, and shortly before the attempted interception.
Figure 4.7:A.Subjects wore an Oculus DK2 with integrated SMI eyetracker with a sampling rate of 60 Hz.B.The experimenter’s desktop view of what the subject saw inside the helmet. The lines receding in depth represent the left and right gaze vectors, and the text in the upper left encodes trial number, block number, and time-stamps. The red disc represents the face of the paddle, on which can also be seen the red virtual ball.
4.2. STUDY2: A COMMON PREDICTIVE STRATEGY FOR EYE AND HAND 69
of the blank period is lower when the blank occurs later in the trial.
Our third hypothesis is that visual and motor strategies are driven by shared resources. If so, we predict that predictive movements of gaze and the paddle will covary on a trial-by-trial basis. Similar signs of visuo-motor coordination were apparent in a real-world interception task involv-ing a carefully calibrated ball launchinvolv-ing device [63]. Although the duration of tracking covaried with interception performance on a trial-by-trial basis, the effects were lost when averaging within conditions. Although the authors speculated that the influence of visual prediction on the sub-sequent movement to intercept is contingent upon the spatio-temporal demands of the task, the experiment was not designed to specifically test this hypothesis. In the present experiment, the spatio-temporal task demands are modulated by varying the timing of the blank relative to the ball’s arrival, which is accomplished through manipulation of post-blank duration. Therefore, if visual and motor strategies involve shared resources, we would expect errors to be coupled at low values of post-blank duration, when the task places high temporal demands upon the participant, and elicits a more predictive mode of control for both gaze and the paddle.
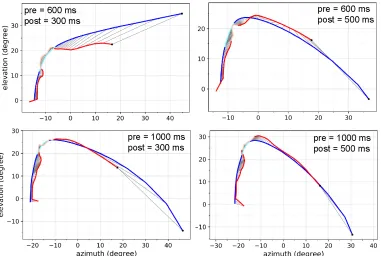
It is notable that, because the blank duration is fixed, reductions in post-blank duration will also have the effect of reducing the ball’s overall time-of-flight, and bring about a straighter (less curved) ball trajectory. As a result, any conclusions concerning the role of visual prediction would be confounded by qualitative changes in the ball trajectory. To test the contribution from changes in the ball’s trajectory to visual prediction, the duration between launch of the ball and the onset of the blank period, or pre-blank duration, varied between three-values, between trials. These changes to the pre-blank duration modify the characteristics of the ball’s trajectory independently of post-blank duration. Combinations of trajectories are presented in Figure4.8.
predic-tive movements of the paddle only when the spatio-temporal demands of the task prevent online control, 3) that when subjects are engaged in both visual and motor control, their movements will demonstrate correlated errors between the modalities.
Figure 4.8: A side-view of the trajectories used in the experiment, which were comprised of a blank period of 500 ms (thick regions), a pre-blank duration of 600, 800, or 1000 ms, and a post-blank duration of 300, 400, or 500 ms before the ball’s passage over the X axis upon which the subject was standing. Thick regions along the trajectories represent the timing of the blank period. Overlapping blank periods reflect the fact that some trajectories have a common overall time-of-flight despite differences in pre-blank duration and TOR, resulting in two-possible times at which the blank may occur. Although ball trajectories in the experiment could have approached from a variety of angles, this representation assumes a single approach angle for visual simplicity.
4.2.2 Methods
The ten participants (7 male, 3 female) were between 19-30 years of age and had norm
![Figure 1.1: Bottom-up vs top-down visual perception theories (Image adapted from [10]).](https://thumb-us.123doks.com/thumbv2/123dok_us/24473.1895/19.612.197.530.125.279/figure-vs-visual-perception-theories-image-adapted.webp)
![Figure 2.4: (a) Flow chart of a supervised machine learning technique (diagram courtesy of [49])and (b) Results for an unsupervised data clustering on a sample data from the VR ball catchingexperiment](https://thumb-us.123doks.com/thumbv2/123dok_us/24473.1895/39.612.232.496.215.547/supervised-learning-technique-courtesy-results-unsupervised-clustering-catchingexperiment.webp)