Research and Information Service
Research Paper
Research and Information Service briefings are compiled for the benefit of MLAs and their support staff. Authors are available to discuss the contents of these papers with Members and their staff but cannot advise members of the general public. We do, however,
3
rdOctober 2013
Caroline Perry
Assessing value added in
school inspection and
supporting improvement
NIAR 520-13
This paper considers the factors in schools that can influence student outcomes, and potential approaches to measuring the value schools add. It also examines processes for reviewing school performance and supporting improvement within schools.
Key Points
School inspections and exam results provide an accountability framework for schools, and there is increasing recognition of a need to assess value added; A range of factors influence school and student performance. Many of these are
mostly outside the school’s control, however there is clear evidence that a school’s practices account for differences in outcomes for schools with similar contexts; During an inspection ETI teams take into account a range of contextual factors,
such as free school meal entitlement, and draw on their wider experience of visiting schools in a range of contexts in coming to their judgement;
The Department plans to require schools to publish the proportion of pupils making the expected progress between each Key Stage from 2015/16;
However, this only applies at Key Stages 1-3 and there are no current plans to assess value added at Key Stage 4 and post-16;
ETI monitors schools identified as requiring improvement more closely, in line with many jurisdictions internationally; schools evaluated as less than satisfactory enter the Formal Intervention Process (FIP);
The Department has proposed a number of changes to the FIP, including that schools rated ‘satisfactory’ and not improving to at least ‘good’ within 12 months will be placed into the process and given a further 12 months to improve;
Factors influencing improvement include the nature of feedback from inspection, appropriate support and resources and the quality of teaching and leadership; In NI the ELBs provide support to schools through their CASS – however these
resources have been reduced substantially in recent years; Areas that could be given further consideration include:
o The robustness and transparency of ETI’s approach to assessing value added;
o The Department’s plans to assess value-added using end of Key Stage assessments given stakeholders’ concerns around their reliability;
o The lack of proposals for assessing value-added at Key Stage 4 and post-16;
o The format and methods of reporting of inspection findings to schools;
o The proposed changes to the FIP, for example in light of wider research suggesting that disadvantaged schools can be slower to improve;
NIAR 520-13 Research Paper
Executive Summary
Introduction
School inspections and exam results provide an accountability framework for schools, and as such, there is growing recognition of the need for robust measures to take account of the contribution schools make to student outcomes. This paper discusses a number of factors that can influence outcomes, potential methods of measuring value-added and considers processes for reviewing and supporting underperforming schools.
Factors influencing school performance
A range of factors influence school and student performance. Many of these are mostly outside the school’s control, with socio-economic background one of the greatest predictors of outcomes. Other factors include parental education, the home learning environment, and the quality of early years education and care previously received. However, the evidence shows that a school’s policies, practices and resources help to account for differences in performance between schools working in similar contexts. Key factors include the quality of teaching and leadership; the professional
development of teachers; and the effective use of data.
Assessing value added
Concerns around the use of “raw” results in assessing the performance of schools have been highlighted in the international literature. Such results may more accurately measure the school’s intake, rather than the value it has added to student outcomes. There are two broad approaches to measuring value added in terms of results:
Simple value added: measures the progress made by a pupil between different stages of education (prior attainment is known to have the greatest influence on results);
Contextual value added: uses a statistical model incorporating a range of factors relating to contextual background.
In Northern Ireland the Department of Education intends to require schools to publish the percentage of pupils making the expected progress between each Key Stage from 2015/16. This would give a measure of value added based on prior attainment,
however, it only applies at Key Stages 1-3 and the Department states that there are no current plans to assess value added at Key Stage 4 and post-16.
NIAR 520-13 Research Paper
Northern Ireland Assembly, Research and Information Service 4
and community support; and the attendance, motivation and behaviour of pupils. The district inspector (who will have visited the school on many occasions) helps to inform inspectors of the school’s particular context.
In coming to its overall judgement, the inspection team draws on its experience of visiting schools working in a range of contexts, and combines this with experience of the evidence presented by the school.
Approaches elsewhere
The evidence suggests that worldwide, countries are increasingly using socio-economic data for value added modelling. In Sweden a model is used to assess a school’s expected performance by adjusting its actual results with regard to student characteristics including parental education. A comparison is made between the school’s expected and actual results to provide a measure of value added. In England published performance data includes the progress made by students between different key stages. However, it abandoned the use of contextual value added measures in 2011 over concerns that it can mask true underachievement. The Flemish Inspectorate of Education develops an individual profile of each school including contextual indicators over a six year period. The profiles are used to benchmark schools with others in comparable contexts.
Review processes for struggling schools
In line with many countries internationally, ETI monitors underperforming schools more frequently with follow-up inspections. It has been suggested that there can be “a firm
hand within the velvet glove” where follow-up is required. Schools found to be less than satisfactory enter the Formal Intervention Process (FIP), and the Department has recently consulted on a range of proposed changes to the process, including:
A school rated ‘satisfactory’ and not improving to at least ‘good’ at a follow-up inspection will be placed in the FIP. They will be given a further 12 months to improve or further action will be considered;
A FIP school improving to ‘satisfactory’ at the follow-up inspection will have a further 12 months to improve to at least ‘good’;
The managing authority must submit a plan for the restructuring of provision
within an area where a school entering the FIP has been identified as unsustainable in an area plan.
Factors influencing school improvement
The quality of teaching and learning and leadership are critical factors in school improvement. Where issues are identified within a school following inspection, the evidence also points to four key factors required to affect improvement:
Governors and staff must be convinced that findings are valid;
The school must have the resources required;
Staff must be motivated to change their ways of working; and
There must be effective systems of reward and sanctions.
In addition, the evidence suggests that the nature of inspection feedback has an important influence on school improvement. Research points to the benefits of longer and more detailed reports for struggling schools. However, ETI’s style of reporting has recently been described as “reductive”.
Support for struggling schools
The crucial importance of support for schools identified as underperforming is
highlighted in the literature. In addition, school improvement can be costly and requires appropriate resources. Actions can include professional development for teachers, personalised student interventions or hiring additional staff.
In NI support for underperforming schools is mainly provided by the Curriculum,
Advisory and Support Service (CASS) of the ELB. Such support may include advice for governors; training for management teams; and support or training across a range of areas. However, in recent years CASS resources have been reduced “substantially.”
Conclusion
This research paper has highlighted a number of areas that could be given further consideration, including:
The robustness and transparency of ETI’s approach to assessing value added; The Department’s plans to assess value-added using end of Key Stage
assessments given stakeholders’ concerns around their reliability;
The lack of proposals for assessing value-added at Key Stage 4 and post-16;
The reporting of inspection findings to individual schools, including the format of inspection reports and oral briefings;
The proposed changes to the FIP, for example the number of schools likely to be affected through their ‘satisfactory’ rating and the wider research suggesting that schools serving disadvantaged communities can be slower to improve; The availability and effectiveness of support for schools through CASS given
NIAR 520-13 Research Paper
Contents
Key Points ... 1
Executive Summary ... 3
Contents 1 Introduction ... 9
2 Factors influencing outcomes ... 9
3 Assessing value added ... 10
4 Review processes for struggling schools ... 15
5 Factors influencing school improvement ... 21
6 Support for struggling schools ... 23
1
Introduction
School inspections, together with examination results and mechanisms for parental choice, provide an accountability framework for schools. In light of this, there is increasing recognition of the need for robust school performance measures that accurately take account of the contribution schools make to student outcomes.1 This paper considers the factors in schools that can influence student outcomes, and potential approaches to measuring the value schools add. It also examines processes for reviewing school performance and supporting improvement within schools.
2
Factors influencing outcomes
The literature highlights a broad range of factors that may influence the educational outcomes achieved by students and schools.
One of the strongest predictors of academic achievement is the socio-economic background of pupils.2 Other factors relating to pupil background include parental education and the home learning environment, and the quality of early years education and care received prior to primary school.3
Nonetheless, a school’s policies, practices and resources help to account for the likelihood of students succeeding at one school compared to another.4 Indeed, the evidence indicates that school success is possible for students from less well-off backgrounds.5
School-level factors
A number of factors that influence examination results and inspection findings are within the remit of the school. For example, research here has found that schools serving disadvantaged populations and performing better than might be expected recognise that encouraging parental involvement is a key factor in raising attainment.6 Other key factors include:
Classroom teaching is widely thought to have the greatest influence on student outcomes;7 however in NI evidence from inspections suggests that half
1
OECD (2008) Measuring improvements in learning outcomes: Best practices to assess the value-added of schools Paris: OECD Publishing
3Melhuish, E. et al. (2010) Effective Pre-school Provision Northern Ireland (EPPNI). Pre-school experience and Key Stage 2
Performance in English and Mathematics Bangor: Department of Education
4
OECD (2010) PISA 2009 Results: What makes a school successful? Resources, Policies and Practices (Volume IV) Paris: OECD Publishing
5
OECD (2013) Synergies for Better Learning: An international perspective on evaluation and assessment Paris: OECD Publishing
6 PricewaterhouseCoopers (2008) Literacy and Numeracy of Pupils in Northern Ireland Bangor: Department of Education 7
NIAR 520-13 Research Paper
Northern Ireland Assembly, Research and Information Service 10
of lessons in primary schools and 60% of lessons in post-primary schools are not consistently ‘very good’ or better;8
School leadership: found to be second only to teaching in influence, 9 however ETI has found that management across all sectors requires improvement (it was inadequate in 30% of pre-schools, 22% of primaries and 39% of post-primaries inspected;10
The professional development of teachers and how they are helped to become more effective throughout their careers;11
School ethos and culture: international evidence suggests that schools can foster ‘resilience’ by developing practices that support disadvantaged students’ motivation and confidence;12
Effective use of data: data on pupil and school performance can play a key role in promoting better teaching and learning, however a 2008 report in NI identified “extensive” training requirements at all levels in education here.13
3
Assessing value added
The accuracy of school performance measures is thought to be particularly important where they are used in the evaluation of education. Internationally there have been concerns that where “raw” results are used without value added measures, school principals and teachers may perceive that their performance is being unfairly judged.14 The publication of “raw” examination results typically measures the school’s intake, rather than the school’s contribution to student outcomes. Using value added performance information is viewed as an “ideal complement” to external school evaluations, in that it provides an accurate measure of school performance. Approaches may include:15
The use of statistical models that aim to measure the value the school has added;
The inclusion of contextual information about the school’s intake alongside performance data (however this does not take into account a student’s prior attainment).
8
Education and Training Inspectorate (2012) Chief Inspector’s Report 2010-12 Bangor: Department of Education
9
Leithwood et al. (2004) How leadership influences student learning New York: The Wallace Foundation
10
Education and Training Inspectorate (2012) Chief Inspector’s Report 2010-12 Bangor: Department of Education
11
OECD (2013) Synergies for Better Learning: An international perspective on evaluation and assessment Paris: OECD Publishing
12
OECD (2011) Against the Odds: Disadvantaged Students Who Succeed in Schools OECD Publishing
13
Kirkup, C. et al. (2005) Schools’ use of data in teaching and learning DfES
14
OECD (2008) Measuring improvements in learning outcomes: Best practices to assess the value-added of schools Paris: OECD Publishing
15 OECD (2013) Synergies for Better Learning: An international perspective on evaluation and assessment Paris: OECD
Overview of approaches
In its analysis of approaches to assessing value added OECD concludes that it is not possible to identify a value added model that is appropriate for all education systems. Instead, it suggests that a number of factors should be considered, including:16
The suitability of particular models;
The implications of including socio-economic information, including in terms of complexity and the effect on the actions taken in light of the results;
Sample size (for example, for small schools the sample size may produce less reliable measures that tend to be less stable over time) and how reliability of results could be supported).
[image:13.595.69.525.338.678.2]There are two main types of value added measures that can be used in schools, outlined in Table 1.17
Table 1: Two key approaches to value added
Approach Measure Advantages and disadvantages
Simple Value Added
Progress made by an individual pupil (or group of pupils) between different stages of education
Uses prior attainment - does not account for other factors, such as socio-economic background;
However prior attainment has been found to have the greatest influence on pupil
attainment18
Contextual Value Added (CVA)
Takes into account factors relating to the context of individual pupils when comparing progress (not usually prior achievement)
Proponents argue that it takes into account factors outside of schools’ control and therefore provide a more accurate picture of the value added by schools19
Others express concerns about the validity of such measures20 and there may be a risk that over-reliance on CVA could mask true underachievement.21
16
OECD (2008) Measuring improvements in learning outcomes: Best practices to assess the value-added of schools Paris: OECD Publishing
17
PwC (2008) School and pupil performance data Bangor: DE
18 Mayston, D. (2006) Educational Value Added and Programme Evaluation London: Department for Education and Skills 19
PricewaterhouseCoopers (2008) School and pupil performance data Bangor: DE
20
Tymms, P., Dean, C. (2004) Value-Added in the Primary School League Tables NAHT
21 OECD (2008) Measuring improvements in learning outcomes: Best practices to assess the value-added of schools Paris:
NIAR 520-13 Research Paper
Northern Ireland Assembly, Research and Information Service 12
Research has identified some concerns around the use of statistical models for adjusting performance data, including their accuracy and (in some models) a level of obscurity that makes interpreting the data challenging.22
Depending on the model of value added used, a school’s estimated contribution to student outcomes may differ. For example, schools that have a high proportion of disadvantaged students and low academic performance might achieve a relatively low value added score using the simple value added approach, but including
socio-economic background within the CVA model may give a higher score.23 These scores may in turn influence the actions taken by the school or wider
stakeholders. For example, action may not be deemed necessary when reviewing the higher score provided through the CVA approach, which could disadvantage students in an underperforming school.24
Northern Ireland
Value added assessment in inspection
ETI notes that when undertaking an inspection, the inspection team will take into account a range of contextual factors, including:25
The percentage of pupils with free school meal entitlement (FSME);
Number of pupils on the special educational needs register;
Pupil enrolment trends;
School type;
The attendance, behaviour, motivation and work ethic of pupils;
Parental and community support.
The team also discusses the school’s work on monitoring and addressing underachievement, and will be informed by the district inspector in regard to the school’s particular context (the district inspector will have visited the school on many occasions over an extended period of time).26
In coming to its overall judgement, the inspection team draws on its experience of visiting schools working in a range of contexts, and combines this experience with the evidence presented by the school to come to its decision.27
22
OECD (2013) Synergies for Better Learning: An international perspective on evaluation and assessment Paris: OECD Publishing
23
OECD (2008) Measuring improvements in learning outcomes: Best practices to assess the value-added of schools Paris: OECD Publishing
24
As above
25
Information provided by the Education and Training Inspectorate, September 2013
26 Information provided by the Education and Training Inspectorate, September 2013 27
Value added performance data
Every School a Good School indicated that the Department would introduce a contextual value added measure to be used alongside other performance data.28 However, the Department now states that CVA measures can entrench low expectations for disadvantaged pupils and may mask underachievement.29
The Department intends to amend regulations so that from 2015/16, schools will have to publish the percentage of pupils making the expected progress between each Key Stage (there is an expectation that they will progress by at least one level between each). This aims to provide a measure of value added based on prior attainment.30 However, this will only apply to Key Stages 1-3 and the Department states that there are “no immediate plans to assess value added at Key Stage 4 and above,” although it does not rule out doing this “at some point in the future.”31
In addition, a recent survey by GTCNI highlighted a lack of confidence among stakeholders regarding the reliability of end of Key Stage assessments, with 65% of those surveyed stating that the outcomes were of limited or no reliability for their school and 88% saying that this was the case for the NI system as a whole.32
Other concerns around the current approach to assessing value added have been highlighted, including concerns around the robustness of FSME as a measure of deprivation and the reliance on measures such as five GCSEs at grades A*-C.33 Indeed, the recent review of A levels and GCSEs included recommendations around broadening accountability measures so that they recognise the achievements of all learners. CCEA recommended that achievements such as five A*-C GCSEs should not be referred to as “good” as it can infer that other achievements are not.34
Approaches in other jurisdictions
OECD notes that increasingly countries are collecting and using socio-economic data for value added modelling. This trend could be seen as part of an increasing drive worldwide for measuring performance within the public sector.35
England
With regard to inspection, schools with low attainment are not precluded from being judged as ‘good’ by Ofsted. In the most recent Annual Report 20% of post-primaries
28
Department of Education (2009) Every School a Good School: a policy for school improvement Bangor: DE
29
Information provided by the Department of Education, July 2012
30
Department of Education Consultation on the provision of performance and other information about schools and pupils Bangor: Department of Education
31
Information provided by the Department of Education, September 2013
32
GTCNI Professional Update, September 2013
33
Gallagher, C. (2013) Striking the Right Balance Belfast: GTCNI
34
Department of Education (2013) Fundamental Review of GCSEs and A levels: Consultation on proposed recommendations
35 OECD (2008) Measuring improvements in learning outcomes: Best practices to assess the value-added of schools Paris:
NIAR 520-13 Research Paper
Northern Ireland Assembly, Research and Information Service 14
judged to be ‘outstanding’ had average levels of attainment. The Chief Inspector has stated that pupils’ progress, rather than raw exam results, is the key factor in
determining a school’s effectiveness.36
In England performance data is reported online for each school, including information on the learning progress made by students between different key stages. The
proportion of students making “expected progress” is reported to highlight the value added by the school.37 CVA measures were previously used, using a multilevel model taking into account nine contextual factors such as prior attainment, deprivation, gender, ethnicity and age.38 However, this approach was abandoned in 2011 over concerns that it entrenched low expectations of pupils from particular backgrounds.39
Australia
In Australia the school reporting website My School uses a measure of socio-economic background (based on parental education and occupation) to present “fair”
comparisons of school performance on national assessments. It also uses a measure of “student gain” where students have taken national assessments at two year levels. This can be compared to the national average and averages in similar schools.40
36
House of Commons Education Committee (2011) The role and performance of Ofsted London: The Stationery Office Limited
37
OECD (2013) Synergies for Better Learning: An international perspective on evaluation and assessment Paris: OECD Publishing
38
DfES (2006) School Value Added Measures in England Department for Education and Skills
39
TES (2013) Where you come from matters after all, says Gove [online] Available at:
http://www.tes.co.uk/article.aspx?storycode=6314568
40
As above
Sweden: “Expected value” approach
In Sweden there are two databases providing data on schools. One includes basic statistical information and student test scores, and the other contains statistical measures of how a school performs against its “expected value.”
A model is used to calculate a school’s “expected value” by adjusting its actual
performance in relation to the student characteristics including parental education; the proportion of boys; and the number of students born abroad. For example, a school with a large proportion of students with parents at a lower educational level would be expected to perform less well than a school with a small proportion of such students.
A comparison of the school’s average student performance with the school’s “expected value” represents a proxy of the value the school adds.
Flemish Community of Belgium
The Flemish Inspectorate of Education develops an individual profile of each school including indicators on input, output and context over a six year period. It draws on information from the Ministry of Education’s Data Warehouse system and uses the profile to benchmark schools with others in comparable contexts.
This approach allows the Inspectorate to decide the focus of external evaluation. During the inspection contextual factors are also considered through analysis of documentation, interviews and observations.41
Prince Edward Island, Canada
Criteria for school evaluation in Prince Edward Island are presented within an analytical framework which takes into account the contextual background of the school.42
Table 2: Analytical framework for school evaluation in Prince Edward Island
Indicator type Details
Input indicators Indicators within the control of the school, for example curriculum, class size and teaching experience
Context indicators Indicators outside the control of the school relating to each student’s background, for example socio-economic status and demographics
Process indicators
Indicators relating to what the school does to fulfil its responsibilities for example the number of classes taught
Results indicators Indicators such as student achievement and outcomes
4
Review processes for struggling schools
Mechanisms for follow-up
The international evidence indicates that not all schools use feedback from inspection to drive improvement. External follow-up can ensure that schools use results to take action, although this places resource requirements onto the inspection body. Many
41
OECD (2013) Synergies for Better Learning: An international perspective on evaluation and assessment Paris: OECD Publishing
42 OECD (2013) Synergies for Better Learning: An international perspective on evaluation and assessment Paris: OECD
NIAR 520-13 Research Paper
Northern Ireland Assembly, Research and Information Service 16
countries tend to more closely monitor underperforming schools and review high-performing schools less frequently.43
ETI approach
One author notes that within the ETI inspection process there can be “a firm hand
within the velvet glove” where inspection findings indicate that improvement is necessary, and follow-up is required.44
[image:18.595.68.532.274.506.2]In Northern Ireland formal inspection follow-up is undertaken where a school is given particular ratings in a standard inspection at post-primary; a short or focused inspection at primary or an inspection of a pre-school setting.45
Table 3: ETI follow-up activity
Rating Follow-up
Good (with areas for improvement)
ETI monitors progress through a more informal visit conducted by the district inspector
Satisfactory ETI monitors and reports on progress in addressing areas for improvement over 12-24 months
Includes interim follow-up visits and follow-up inspection
Inadequate/ unsatisfactory
ETI monitors and reports on progress in addressing areas for improvement over 12-18 months
Includes interim follow-up visits and up to two follow-up inspections
Schools found to be less than satisfactory enter the Formal Intervention Process. A school in Formal Intervention is required to submit a detailed action plan outlining the measures being taken to drive improvement.46 Monitoring visits are undertaken in the period prior to the follow-up inspection, and a school is expected to have made “significant progress” in the areas identified as requiring improvement.47
Where a school remains unsatisfactory throughout the follow-up inspections, the Department meets with the relevant ELB, sectoral body, ETI and the school’s Board of Governors to discuss alternative approaches and take action. Actions could include:48
43
OECD (2013) Synergies for Better Learning: An international perspective on evaluation and assessment Paris: OECD Publishing
44
Penzer, G. (2011) School inspections: what happens next? Reading: CfBT Education Trust
45
Information provided by the Department of Education, October 2012
46
DE (2009) Every School a Good School Bangor: DE
47 ETI (2013) Annual Business Report 2011-12 Bangor: DE 48
Restructuring of the school’s governance, leadership and management
Merging the school with a neighbouring school;
Closing the school and reopening it with a new management team; Closing the school.
[image:19.595.113.509.270.553.2]ETI reports that of 83 providers where follow-up inspections were carried out between April 2011 and March 2012, 81% had shown improvement. It states that this pattern is similar to that seen in the previous three years.49 Figure 1 shows the extent to which these schools were found to have improved.50
Figure 1: Extent of improvement identified at follow-up inspections in 2011-12
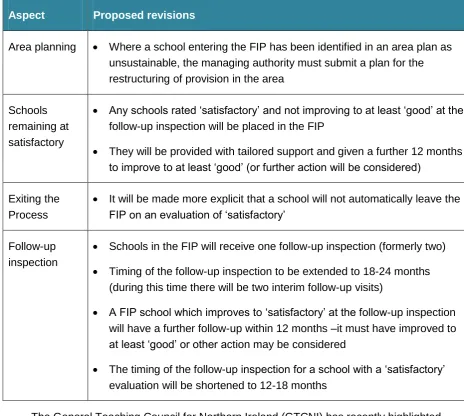
The Department wishes to make a number of changes to the Formal Intervention Process, and a consultation on these was due to close on the 30th September 2013. It states that some schools in the process and some rated “satisfactory” do not improve sufficiently. In addition, the changes aim to take account of policy developments such as area planning. The proposed revisions are set out in Table 4.51
49
ETI (2013) Annual Business Report 2011-12 Bangor: DE
50 ETI (2012) Inspection Leading to Improvement: Business Year 2011-2012 Bangor: DE 51
Correspondence from the Department of Education, June 2013
0% 5% 10% 15% 20% 25% 30% 35% 40% 45%
NIAR 520-13 Research Paper
[image:20.595.68.533.97.513.2]Northern Ireland Assembly, Research and Information Service 18 Table 4: Main proposed changes to the Formal Intervention Process (FIP)
Aspect Proposed revisions
Area planning Where a school entering the FIP has been identified in an area plan as unsustainable, the managing authority must submit a plan for the restructuring of provision in the area
Schools remaining at satisfactory
Any schools rated ‘satisfactory’ and not improving to at least ‘good’ at the follow-up inspection will be placed in the FIP
They will be provided with tailored support and given a further 12 months to improve to at least ‘good’ (or further action will be considered)
Exiting the Process
It will be made more explicit that a school will not automatically leave the FIP on an evaluation of ‘satisfactory’
Follow-up inspection
Schools in the FIP will receive one follow-up inspection (formerly two)
Timing of the follow-up inspection to be extended to 18-24 months (during this time there will be two interim follow-up visits)
A FIP school which improves to ‘satisfactory’ at the follow-up inspection will have a further follow-up within 12 months –it must have improved to at least ‘good’ or other action may be considered
The timing of the follow-up inspection for a school with a ‘satisfactory’ evaluation will be shortened to 12-18 months
The General Teaching Council for Northern Ireland (GTCNI) has recently highlighted concerns around the proposed changes, describing them as representing a “shift
towards an increasingly deficit approach.”52Any changes to the formal intervention
process are expected to be implemented by 1st January 2014.53
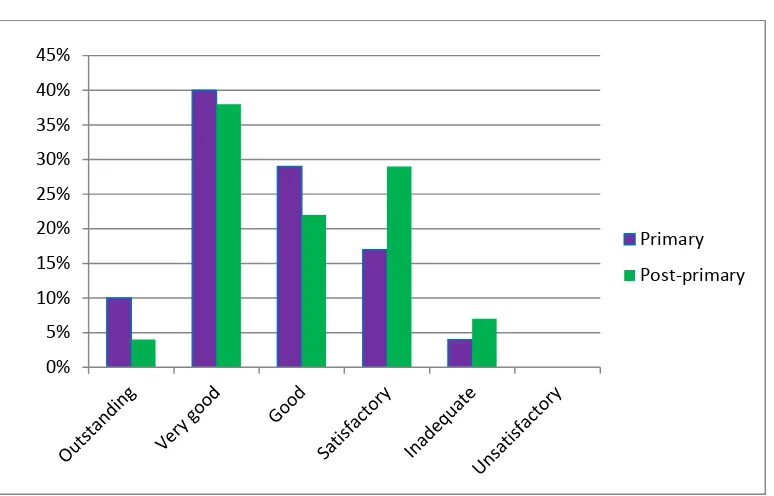
The proposed changes to the Formal Intervention Process are likely to affect many schools. In 2010-12, 29% of post-primaries and 17% of primaries inspected were rated as ‘satisfactory’.
Wider research suggests that disadvantaged students tend to be over-represented in schools that are rated ‘satisfactory’. In addition, schools serving disadvantaged
communities are often slower to improve from a ‘satisfactory’ grade than those serving better-off families.54 While this may be partly due to contextual factors, research
52
Gallagher, C. (2013) Striking the Right Balance Belfast: GTCNI
53 Information provided by the Education and Training Inspectorate, September 2013 54
suggests that such schools can improve through concerted efforts to improve
[image:21.595.100.487.127.375.2]teaching.55 Figure 2 illustrates the ratings given to schools inspected from 2010-2012.
Figure 2: ETI judgements of schools inspected 2010-1256
The following paragraphs consider approaches to following up with schools where areas for improvement have been identified in a number of other jurisdictions.
England: “Naming and shaming” and Special Measures
While the treatment of inadequate schools is neither strongly punitive nor strongly supportive, an important aspect is the “naming and shaming” of failing schools, which tends to be reported in local media. The stigma of failure for principals and governors can be a significant issue.57 Where Ofsted deems a school to be ‘inadequate’, it places it into one of two categories:58
Serious weaknesses: one or more areas are inadequate but leaders and governors are judged to be capable of securing improvement;
Special measures: school is failing to give pupils an acceptable standard of education, and the leaders or governors do not demonstrate the capacity to secure improvement in the school.
A school with serious weaknesses will undergo a monitoring inspection within six to eight months and a full inspection around a year after the initial inspection. The
55
Francis, B. (2011) (Un)satisfactory? Enhancing life chances by improving ‘satisfactory’ schools London: RSA
56
Information provided by the Education and Training Inspectorate, September 2013
57
Allen, R., Burgess, S. (2012) How should we treat under-performing schools? A regression discontinuity analysis of school inspections in England Bristol: Centre for Market and Public Organisation
58
Ofsted (2013) The framework for school inspection Manchester: Ofsted 0%
5% 10% 15% 20% 25% 30% 35% 40% 45%
Primary
NIAR 520-13 Research Paper
Northern Ireland Assembly, Research and Information Service 20
principal and chair of the governing body are invited to attend a seminar on school improvement, but are not required to attend.59
A school placed into Special Measures will receive its first monitoring visit within four to six weeks, and may receive a total of up to five monitoring inspections over the 18 months following inspection.60 Interventions that may be made include:61
Converting the school to an Academy with a strong sponsor;
Requiring the governing body to enter into specified arrangements with a view to improving performance (for example, taking steps to create or join a federation, or to collaborate with governors from another school);
Suspending the delegated budget of the school; Appointingadditional governors;
Closing the school.
Netherlands: Increased monitoring for failing schools
In the Netherlands, where a school is found to have serious weaknesses, the
inspectorate implements a more intensive regime and may even report the school to the Minister of Education.62
An ‘intervention’ phase follows school inspection in which the school is required to address the identified areas for improvement and the inspectorate monitors its
progress. If a school fails to improve the inspectorate may more intensively monitor the school, and may even impose sanctions.63
New Zealand: Proportionate approach
In New Zealand the nature of follow-up to a school inspection depends on the outcome of the inspection. This ranges from a subsequent review within 12 months where there are significant concerns, to a review in four to five years where a school has a track record of good performance and effective self-evaluation.64
59
Allen, R., Burgess, S. (2012) How should we treat under-performing schools? A regression discontinuity analysis of school inspections in England Bristol: Centre for Market and Public Organisation
60
Ofsted (2013) Monitoring inspections of schools that are subject to special measures Manchester: Ofsted
61
Department for Education (2012) Schools causing concern - guidance for local authorities
62
Penzer, G. (2011) School inspections: what happens next? Reading: CfBT Education Trust
63 Penzer, G. (2011) School inspections: what happens next? Reading: CfBT Education Trust 64
5
Factors influencing school improvement
The evidence highlights the importance of turning around failing schools quickly, in order to limit the educational disadvantages for students, and to reduce the damage to the school’s reputation (which may in turn make recovery more difficult).65
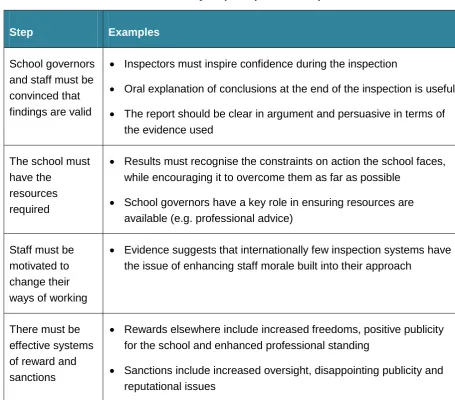
The literature identifies four steps required to achieve improvement. These are discussed in Table 5.66
65 National Audit Office (2006) Improving poorly performing schools in England London: The Stationery Office 66
Penzer, G. (2011) School inspections: what happens next? Reading: CfBT Education Trust
Republic of Ireland: Inspection follow up
In 2008 the Department for Education and Skills established a School Improvement Group (SIG) to ensure that improvement follows inspection in schools experiencing significant difficulty. The group coordinates actions tailored to the individual school, aiming to ensure that the school’s patron, management and staff work to improve provision. The interventions include:
Meetings with patrons, board chairpersons and/ or school principals;
Progress reports from the board of management;
Support for the school from school support services or services provided by patron or management bodies;
Further inspections; and
Sanctioning school management, where appropriate.
SIG dealt with more than 50 underperforming schools between 2008 and 2011 and has helped many schools to improve. SIG has found that it can take some time to achieve significant improvement, in line with findings on poorly performing schools in other countries.
NIAR 520-13 Research Paper
[image:24.595.67.523.86.486.2]Northern Ireland Assembly, Research and Information Service 22 Table 5: Four key steps required for improvement
Step Examples
School governors and staff must be convinced that findings are valid
Inspectors must inspire confidence during the inspection
Oral explanation of conclusions at the end of the inspection is useful
The report should be clear in argument and persuasive in terms of the evidence used
The school must have the
resources required
Results must recognise the constraints on action the school faces, while encouraging it to overcome them as far as possible
School governors have a key role in ensuring resources are available (e.g. professional advice)
Staff must be motivated to change their ways of working
Evidence suggests that internationally few inspection systems have the issue of enhancing staff morale built into their approach
There must be effective systems of reward and sanctions
Rewards elsewhere include increased freedoms, positive publicity for the school and enhanced professional standing
Sanctions include increased oversight, disappointing publicity and reputational issues
The evidence suggests that improving the quality of teaching and learning is one of the strongest factors in terms of school improvement.67 For example, schools in England that do not improve from a ‘satisfactory’ grade have been found to have too little good teaching.68 Leadership and management are also known to have a strong influence on school improvement.69
The international evidence indicates that the nature of feedback from external evaluation has an important influence on the impact on school improvement.70 Research recommends longer and more detailed reports for struggling schools, highlighting what changes are required, how they might be implemented and the
67
For example Faubert, B. (2012) A Literature Review of School Practices to Overcome School Failure OECD Publishing and Francis, B. (2011) (Un)satisfactory? Enhancing life chances by improving ‘satisfactory’ schools London: RSA
68
Ofsted (2011) Schools that stay satisfactory Manchester: Ofsted
69
Faubert, B. (2012) A Literature Review of School Practices to Overcome School Failure OECD Publishing
70 OECD (2013) Synergies for Better Learning: An international perspective on evaluation and assessment Paris: OECD
inclusion of milestones for achieving improvement.71 However, GTCNI suggests that there are concerns around ETI’s ‘reductive’ style of reporting.72
6
Support for struggling schools
The literature highlights the importance of a support system for schools seeking to improve provision and outcomes. It notes that teachers require support in order to build capacity, problem solve and innovate. Aspects of such a support system could
include:73
Teacher professional learning;
Planning time for teachers; and
Personalised student interventions.
Overcoming significant challenges within a school after inspection can be costly. The National Audit Office suggests that while a simple case of weakness in a small primary school may be overcome at little cost; a large post-primary with complex problems and a track record of poor performance can cost around £500m to improve.74 Actions to affect improvement may include:75
Hiring additional staff;
Improving professional learning;
Securing new facilities or equipment.
Other more costly approaches include closing the school and replacing it with a new school. An example of this is the Academies programme in England.76
NI approach
ETI states that it is not their responsibility to provide extended support for teachers and schools. Instead, support is provided mainly by the Curriculum, Advisory and Support Service (CASS) of the relevant Education and Library Board (ELB).77
71
Francis, B. (2011) (Un)satisfactory? Enhancing life chances by improving ‘satisfactory’ schools London: RSA
72
Gallagher, C. (2013) Striking the Right Balance Belfast: GTCNI
73
Faubert, B. (2012) A Literature Review of School Practices to Overcome School Failure OECD Publishing
74
National Audit Office (2006) Improving poorly performing schools in England London: The Stationery Office
75
Faubert, B. (2012) A Literature Review of School Practices to Overcome School Failure OECD Publishing
76 National Audit Office (2006) Improving poorly performing schools in England London: The Stationery Office 77
NIAR 520-13 Research Paper
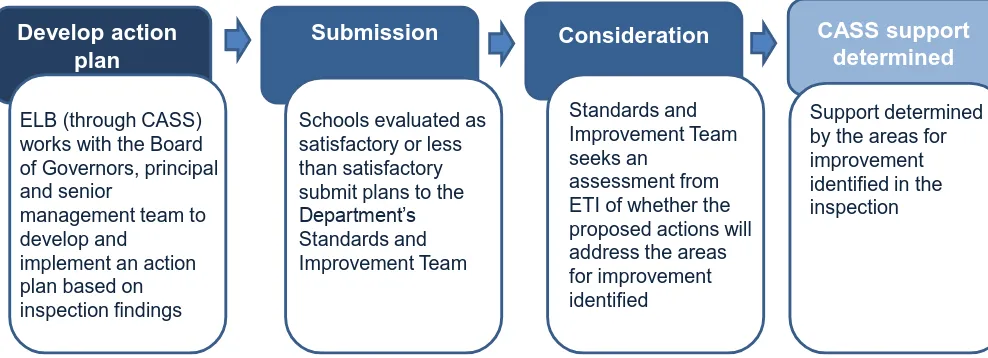
[image:26.595.79.573.113.292.2]Northern Ireland Assembly, Research and Information Service 24 Figure 3: Process for identifying support for schools judged to be satisfactory or
less than satisfactory
Schools placed in formal intervention are provided with targeted support by the Board’s CASS (working with CCMS as appropriate). CASS can provide a range of support to schools, including:78
Advice for Boards of Governors;
Support, guidance or training for school development planning, target setting or the effective use of data;
Training for senior or middle management teams;
Support for English, maths or special educational needs;
Liaison with other Board services and partner agencies.
While most support services for schools are available within the Boards, other bodies such as the Regional Training Unit and the Council for the Curriculum, Examinations and Assessment may also provide help. In addition, staff may visit other schools to observe good practice.79
However, the CASS resources for schools following inspection have been reduced “substantially” over recent years. ETI notes that in light of this, follow-up inspections and visits are increasingly important.80
School to school support
Some authors call for greater peer or school to school support for struggling schools. Francis suggests that the inspectorate could take on the role of facilitating advice, support and learning between schools, gathering and sharing best practice. This could
78
Information provided by the Education and Training Inspectorate, September 2013
79 Information provided by the Education and Training Inspectorate, September 2013 80
ETI (2013) Annual Business Report 2011-12 Bangor: DE Develop action
plan
Submission CASS support
determined
Schools evaluated as satisfactory or less than satisfactory submit plans to the Department’s Standards and Improvement Team ELB (through CASS)
works with the Board of Governors, principal and senior
management team to develop and
implement an action plan based on inspection findings
also be achieved by encouraging federations of schools and facilitating shared systems.81
In England a number of high performing schools have formed federations with lower-performing counterparts. Research has found that such ‘performance federations’ have resulted in improvements in student outcomes after a period of two to four years – with the positive impact found in both the higher and lower performing schools.82
7
Conclusion
Research points to the importance of using accurate and robust measures to assess the performance of schools, and in particular, the value they add to student outcomes. In addition, the need for schools identified as underperforming to be provided with adequate support is clear from the evidence. This research paper has highlighted a number of areas that could be given further consideration, including:
The robustness and transparency of ETI’s approach to assessing value added; The Department’s plans to assess value-added using end of Key Stage
assessments given stakeholders’ concerns around their reliability;
The lack of proposals for assessing value-added at Key Stage 4 and post-16;
The reporting of inspection findings to individual schools, including the format of inspection reports and oral briefings;
The proposed changes to the Formal Intervention Process, for example the number of schools likely to be affected through their rating as ‘satisfactory’ and the wider research suggesting that schools serving disadvantaged communities can be slower to improve from a satisfactory grade;
The availability and effectiveness of support for schools identified as requiring improvement through CASS given the substantial reduction in services; in addition, whether CASS will be able to provide support for the potentially increased numbers of schools entering the Formal Intervention Process.
81
Francis, B. (2011) (Un)satisfactory? Enhancing life chances by improving ‘satisfactory’ schools London: RSA
82 Chapman, C., Muijs, D., MacAllister, J. (2011) A study of the impact of school federation on student outcomes Nottingham: