Abstract- This paper describes an OCR system for printed text documents in Kannada, a South Indian language. Many commercial OCR systems are now available in the market, but most of these systems work for Roman, Chinese, Japanese and Arabic characters. There are no sufficient number of works on Indian language character recognition especially Kannada. In this work we proposed kannada character recognition system using texture features. Here we fuse the texture features like Local Binary Pattern, Local Binary Pattern Variance, Gray Level Local Texture Pattern, Gabor Filter Response and Wavelet Decomposition using concatenation rule and select discriminative texture features by employing wrapper feature selection methods. Finally, K-NN classifier is explored for the purpose of classification. In addition, we also explore the K-NN classifier with different distance functions. This method is simple to implement and realize, also it is computationally efficient.
Keywords: LTP, GLTP, KNN, SFS, SFFS
I. INTRODUCTION
Optical character recognition (OCR) lies at the core of discipline of pattern recognition where the objective is to interpret scanned images of handwritten or typewritten text into computer processa- ble format. Due to the advancement of digital computers many tools are available for word processing and large amount of paper documents are processed for various reasons all over the world. Extracting information from paper documents manually would add significant cost in terms of human labour. So, making com- puters able to read would allow for substantial savings in terms of the costs for data entry, mail processing, form processing and many other similar situations. This real world problem can be made easy by OCR. Character recognition can be divided into two major categories according to mode of the document given to it i) Online character recognition ii) Offline character recognition. Further, Offline character recognition is divided into i) Printed character recognition ii) Handwritten character recognition. Kan- nada, the official language of the south Indian state of Karnataka, is spoken by about 48 million people. The Kannada alphabets were developed from the Kadamba and Chalaukya scripts, de- scendents of Brahmi which were used between the 5 th and 7 th centuries A.D. The basic structure of Kannada script is distinctly different from the Roman script. Unlike many north Indian lan- guages, Kannada characters do not have shirorekha (a line that connects all the characters of any word)
Revised Manuscript Received on December 22, 2018.
First Author name, His Department Name, University/ College/ Organization Name, City Name, Country Name.
Second Author name, His Department Name, University/ College/ Organization Name, City Name, Country Name.
Third Author name, His Department Name, University/ College/ Organization Name, City Name, Country Name.
and hence all the charac- ters in a word are isolated. This creates a difficulty in word seg- mentation. Kannada script is more complicated than English due to the presence of compound characters. However, the concept of upper/lower case characters is absent in this script. Hence inthiswork we investigate the suitability of texture features in designing a system for kannada character classification. Character is seg- mented using a threshold based method and texture features viz., Local Binary Pattern, Local Binary Pattern Variance, Gray Level Local Texture Pattern, Gabor Filter Response and Wavelet De- composition. These features are used for training and classifica- tion using K-Nearest Neighbor Classifier.
II. RELATED WORK
For the past few decades, intensive research has been done to solve the problem of printed and handwritten character recognition. Various approaches have been proposed to deal with this problem. Challenging problems are being encountered and solutions to these are targeted in various ways to improve accuracy and effi- ciency. A brief overview of the numeral recognition work done on Indian scripts is presented below. M. Hanmandlu et al.,[1] pro- posed a method for recognition of handwritten Hindi numerals, written in Devanagari script. The method is based on a kind of exponential membership function fitted to the fuzzy sets derived from features consisting of normalized distances obtained using the box approach. The exponential membership function is modi- fied by two structural parameters that are estimated by optimizing the entropy subject to the attainment of membership function to unity. The overall recognition accuracy is found to be 96%. How- ever, the experiments are carried out on a limited database with size of 3500 samples. Rajashekaradhya et al.,[2] used zone cen- troid and image centroid based distance metric feature extraction method for recognition of Kannada, Telugu, Tamil and Malayalam numerals. The character centroid is computed and the numeral image is further divided into n equal zones. Average distance fromcharacter centroid to the each pixel present in zone is computed. Similarly zone centroid is computed and average distance from the zone centroid to each pixel present in zone is computed. Nearest neighbour and feed forward back propagation neural network classifiers are used for subsequent classification and recognition purpose. In [3], U Pal et al. have proposed a modified quadratic classifier based scheme towards
the recognition of off-line hand- written numerals of six popular Indian scripts.
Textural Features and Feature Selection in
KAN-NADA Character Recognition
One of the scripts is Kannada. The features used in the classifier are obtained from the directional information of contour points of the numerals. For feature computation, the bounding box of a numeral is segmented into blocks and the directional features are computed in each of the block. These blocks are then down sampled by a Gaussian filter and features obtained from the down sampled blocks are fed to modified quadratic classifier for recognition. A five-fold cross validation technique has been used for result computation and they have reported 98.71% accuracy for Kannada scripts obtained by performing experiments on their own data set. Benne at al. [4] proposed recognition system for isolated handwritten numerals recognition for three popular Indian scripts namely, Kannada, Devanagri and Telugu numeral sets. The proposed method is thinning free and without size normalization. The structural features viz. directional density of pixels, water reservoirs, maximum pro- file distances, and fill hole density are used for handwritten nu- merals recognition. A Euclidian distance criterion and K-nearest neighbour classifier is used to classify the handwritten numerals. A limited data set consisting of 5250 numeral images are consid- ered for experimentation, and the overall accuracy of 95.40%, 90.20%, and 98.40% is reported for Kannada, Devanagari and Telugu numeral respectively. Dinesh Acharya and et al. [5] have used 10-segment string concept, water reservoir, horizontal and vertical strokes, and end points as features and k-means to classify to classify the Kannada handwritten numeral. They have reported the overall recognition accuracy of 90.5%. G.G. Rajput et al. [6] described a system for isolated Kannada handwritten recognition using image fusion method. Several digital images corresponding to each handwritten numeral are fused to generate patterns, which are stored 8x8 matrices, irrespective of the size of images. The numerals to be recognized are matched using nearest neighbour classifier with each pattern, and the best match pattern is considered as the recognized numeral. The average recognition rate of 95.62% is reported by them obtained by performing experiments on the data set generated locally. In [7], handwritten Kannada character recognition system based on spatial features is proposed. Directional spatial features viz stroke density, stroke length and the number of stokes are employed as features to characterize the handwritten Kannada vowels using K-NN classifier. The average recognition accuracy of 90.1% is reported for vowel characters. In [8], moment based features are used for recognition of Kagunita (the Kannada compound characters resulting from the consonant and vowel combination). These features are extracted using Gabor wavelets from the dynamically pre-processed original image. Mul- ti-Layer Perceptron with Back Propagation Neural Networks are employed for character classification. Average recognition rate of 86% is reported for vowels and for consonants the average recognition reported is 65%. From the work reported in the literature, we note the following. In many of the proposed methods, the dataset size is small in terms of number of samples used for each character/numeral. There is no clear explanation about training and test images in case of supervised algorithms used [9]. Experiments are not being performed on entire
of Kannada script are included.
III. PROPOSED METHOD
The proposed method has training and classification phases. In training phase, from a given set of training images the texture features (LTP/ Gabor/GLTP/WD) are extracted and later feature selection methods like sequential forward selection (SFS), sequential floating forward selection (SFFS), sequential backward selection (SBS) and sequential floating backward selection (SFBS) is used reduce the features. Final the system is trained using the K- nearest neighbor classifier. In classification phase a given test is segmented and then the above mentioned texture features are extracted for classification. These features are queried to K-nearest neighbor classifier to label an unknown Character.
3.1.1 FILTERING
Character data might have been corrupted due to jitters, redundant and extraneous wild points due to erratic pen movements. In addi- tion to this, the hardware limitations in the data collection equip- ment may also introduce noise to the raw data. So, it is essential to isolate the collected data from these redundant noise components to improve the performance of the recognition system. In practice, a moving average filter or a Gaussian filter is commonly used to remove these noise segments. But, a careful choice of a filter is necessary in order to avoid the loss of important structural fea- tures like cusps, dots, etc. In the present work, a Gaussian filter with a sliding window size of seven [10] is used to filter the noisy images.
3.1.2 Morphologica Processing
Binary images contain numerous imperfections. In particular, the binary regions produced by simple thresholding are distorted by noise. Morphological image processing pursues the goals of re- moving these imperfections by using morphological erode and dilate operations as shown in the below algorithm [11]. Algorithm
1)Define a square structuring element of size 3 2)Erode the image m number of times to removespur. 3)Dilate the image m+n number of times to fill the gaps in the edges and restore the structure.
4)Erode the image n number of times to restore the image
3.2
Texture Based Proposed ModelThe proposed texture based model consists of four stages: feature extraction, feature level fusion, feature selection and classification. Prior to the feature extraction stage, we required applying the segmentation process.
3.2.1
Feature ExtractionThe roughness is reflected by transitions in intensity levels on the surface of a Character in the form of uniform and non- uniform patterns. To exploit this, we recommend extracting texture features from gray scale images of segmented characters using the various texture based models viz., LBP, LBPV, GLTP, Gabor and Wavelets which are explained in the following sub-
sections.
3.2.1.1 Local
Pattern(LBP)
The LBP is a gray-scale and rotational invariant texture operator which characterizes the spatial structure of the local image texture [12]. The gray-scale invariance is achieved by assigning a unique pattern label to every pixel in an image depending on binary pattern generated by comparing its value with those of its neighborhoods. A pattern label is computed by
[image:3.595.48.278.325.640.2]Here, g c is the gray value of the central pixel of circularly sym- metric neighborhood g p ( p = 0,1...P-1) , g p is the gray value of its neighbors, P is the number of neighbors and R is the radius of the neighborhood.
Figure 2: Illustration of preprocessing stages of character Ja. (a) Original Image (b) Binearization (c) Filtered and Morphological Image sampled data sample.
(d) Size normalized data sample.
3.2.1.2 Wavelet Decomposition (WD)
We performed a single level wavelet decomposition on matrices of each channels of original RGB input image of charcter using Haar wavelet. It results into four coefficients matrix for each channel. They are approximation matrix coefficients (cA) and three detail coefficient matrices called horizontal (cH), vertical (cV) and diagonal (cD). To analyse the function of wavelet, we compute the reconstructed coefficients matrix for each of the details coefficients matrices of each channel. Then we extract features by calculating energy for each obtained reconstructed coefficients matrix. Since we obtained three reconstructed coef- ficients matrix for each channel, the number of features is 9.
3.2.1.3 Gabor Filter Response(GFR)
Frequency and orientation representations of the Gabor filter are similar to those of the human visual system. Therefore, we ex- ploited Gabor filter response to represent and discriminate tex- ture of characters. In our proposed model, RGB image is
trans- formed into a gray image for further processing. Gabor filter is a linear filter whose impulse response is defined by a harmonic function multiplied by a Gaussian function. Because of the mul- tiplication convolution property (Convolution theorem), the Fourier transform of a Gabor filter’s impulse response is the convolution of the Fourier transform of the harmonic function and the Fourier transform of the Gaussian function and it is giv- en by
where x ' =x cos θ + Ysin θ and y' = x sin θ + y cosθ represents the wavelength of the cosine factor, θ represents the orientation of the normal to the parallel stripes of a Gabor function, ψ is the phase offset, σ (sigma) is the Gaussian envelope and γ is the spa- tial aspect ratio specifying the ellipticity of the support of the Ga- bor function. A filter bank of Gabor filters with various scales and rotations is created. In this work we have considered scales of 0, 2, 4, 8 and 10 and, orientations of 0, 45, 90 and 135. For each ob- tained response image we extract first three moments as features and thus for an image we have totally 72features.
3.2.1.4 Local Binary Pattern Variance(LBPV)
3.2.1.5 Gray Level Local Texture Pattern(GLTP) The LBP model is computationally efficient but inadequate to represent a local region whereas the texture spectrum (TS) mod- el will reveal more textural information but it is computationally burden. The GLTP was developed by combining the advantages of the TS and the LBP (Ojala et al., [12]). The GLTP is compu- tationally acceptable and is robust against variations in the ap- pearance of the texture to meet the real world applications [14]. These variations may be caused by uneven illumination, differ- ent viewing angles and resolving power of the sensor system. Since it is a rotational invariant and gray-scale shift invariant, it is robust against variable illumination. The GLTP model detects the number of transitions or discontinuities in the circular presentation of texture patterns in a small region, thus it suits to our dataset. When such transitions are found to follow a rhyth- mic pattern, they are recorded as uniform patterns and are as- signed with unique labels. All other non-uniform patterns are grouped under single category. It assigns a GLTP label to every pixel in an image depending on uniformity of pattern around the pixel. This labeled image is represented using a one dimensional histogram with abscissa indicating the GLTP label and ordinate representing its frequency. The following rotational and gray- scale invariant GLTP operator [14] is used for describing a local image texture.here, ∆g is a small positive value that represents a desirable gray value and has its importance in forming the uniform patterns. Uniform measure (U) corresponds to the number of spatial tran- sitions in a circular direction to form a pattern string and is de-
fined as
For example, GLTP with R = 1 and P = 8 could generate 46
uniquelabels.ForU=0thereexist3GLTPlabels(0,8and72), forU=2thereare21GLTPlabels(1to7,9,16,18,24,27,32, 36, 40, 45, 48, 54, 56, 63 and 64) and for U = 3 there existanother
21 GLTP labels (10 to 15, 19 to 23, 28 to 31, 37 to 39, 46, 47 and 55). All other non uniform patterns are grouped
under one label 73. Since there are few holes in the GLTP labeling scheme, they are relabeled to form continuous numbering from 1 to 46 using a lookup table. The GLTP labels for some pattern strings are shown in Table 1.
IV. FEATURE LEVEL FUSION
Feature level fusion refers to combining different feature vectors that are obtained by employing multiple feature extraction algo- rithms. When the feature vectors are homogeneous, a single resultant feature vector can be obtained as a weighted average of the individual feature vectors. When the feature vectors are non homogeneous, we can concatenate them to form a single feature vector [15].The extracted feature vectors of LBP, LBPV, GLTP, Gabor response and Wavelets are fused in all possible combina- tions by concatenating the feature vectors. The fused feature vectors are normalized using min-max method.
1) 4.1 Feature Selection
Feature selection is the process of selecting a subset of relevant features for building robust learning models. Feature selection is broadly classified into two categories such as filter model and wrapper model. The filter model relies on general characteristics of the training data to select some features without involving any learning algorithm. The wrapper model requires one predeter- mined learning algorithm in feature selection and uses its per- formance to evaluate and determine best features for selection. A well known filter method Relief [16] relies on relevance eval- uation. Time Complexity of Relief for a dataset with M instanc- es and N features is O (MN) . However, the Relief method does not help to eliminate redundant features. Empirical evidence from feature selection literature shows that, along with irrelevant features, redundant features also affect the speed and accuracy of learning algorithms and thus should be eliminated as well[17]. Therefore, we have exploited feature selection methods based on wrapper model such as sequential forward selection (SFS), se- quential floating forward selection (SFFS), sequential backward selection (SBS) and sequential floating backwardselection
(SFBS) [18]. The criterion employed in these methods is the correct classification rate of the Bayes classifier assuming that the features obey the multivariate Gaussian distribution.
These methods
eliminate irrelevant features as well as redundant fea- tures but
they are
slightly expensive than the filter method.
V. CLASSIFICATION
In this model, the K-NN classifier based on G-statistic, Chi- square and Euclidean distance measure has been used to classify kannada character images.
1.1
DATASETSIn this work we have created our own database despite of exist- ence of other databases as these are less intra class variations or no change in view point. We collected Kannada character imag- es from World Wide Web in addition to taking up some photo- graphs of Characters that can be found in and around. The imag- es are taken to study the effect of the proposed method with large intra class variations. Fig. 3 shows a sample image of each different class. It is clearly understandable that there is a large intra class variation. The large intra-class variability and the small inter-class variability make this dataset verychallenging.
1.2
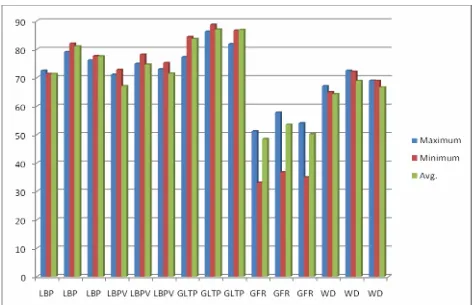
EXPERIMENTATIONIn the first part of experimentation, we conducted experiments for the proposed model based on individual texture models. During experimentation, we conducted four different sets of experiments. In the first set of experiment, we used 30% of the samples of each class of a dataset to create class representative vectors (training) and the remaining 60% of the samples for testing purpose. In the second set, third set and fourth set of experiments, the number of training and testing samples is in the ratio 40:60, 50:50 and 60:40 respectively. In each set of experi- ment, experiments are repeated 20 times by choosing the train- ing samples randomly. As measure of goodness of the proposed model based on individual texture model, we computed mini- mum, maximum, average and standard deviation of classifica- tion accuracy of all the 20 trails using the K-NN classifier. Clas- sification accuracy of the proposed model based on individual texture models (LBP, LBPV, GLTP, GFS and WD) for 30% training, 40% training, 50% training and 60% training are tabu- lated in figure 4, figure 5, figure 6 and figure 7 respectively. It is observed from figures that the GLTP texture model has achieved a better average classification accuracy in experiment 4 (60% training samples) when compared to other texture models. It is also observed that the proposed model has achieved a good clas- sification accuracy for all individual texture models in experi- ment 4 (60% training samples) when compared to experiment 1 (30% training samples), experiment 2 (40% training samples) and experiment 3 (50% training samples). Therefore, we present experimental results obtained for 60% training only for fusion of texture features and also for fusion of texture features and appli- cation of feature selection method. In second part of experimen- tation, we conducted experiments based on fusion of texture features and the application of feature selection method. That is, we applied the wrapper feature selection method (SFS, SBS, SFFS and SFBS) on fused texture feature vector to reduce the dimension of feature matrix and to obtain discriminative texture features. During experimentation, experiments are repeated 5 times by choosing the training samples randomly. Classification accuracy of the proposed model based on fusion of texture fea- tures and feature selection method for 2
features at a time, 3 features at a time , 4 features at a time and all 5 features are tabulated respectively in Table 2, Table 3, and Table 4. Here we presented results of G-statistic for 60% training as it was ob- served to have good results for the G-statistic based K-NN clas- sifier. It is observed from Table 2, Table 3 and Table 5 that the fusion of GLTP and WD
features with SBS feature
selectionmethodhasachievedbestaverageclassificationaccura cywhencompared to other combinations.
5.3
Discussion
From the experimental results, it is observed that the GLTP texture model has dominant features when compared to LBP, LBPV, Gabor response and Wavelet decomposition. Since the GLTP is build by the advantages of TS and LBP, it reveals more local texture information when compared to texture models such as Gabor response and Wavelet decomposition. The GLTP assigns a label (uniform label or non-uniform label) for each pixel in an image based on the uniformity or non-uniformity of neighborhood, where as the GFR is based on frequency and orientation of edge information. Though, the GFR is rotation invariant local texture information, fusion of Gabor response with the other texture models such as LBP, LBPV, GLTP and Wavelet decomposition has deteriorated the performance because the Gabor response will not represent edge information in the form of uniform patterns and non-uniform patterns. Fusion of LBPV with other texture models such as LBP, GLTP, Gabor response and Wavelet decomposition has also deteriorated the performance because global information such as variance is embedded with local information in the LBPV. Therefore, the LBPV will deteriorate the classification accuracy. Feature selection after fusion has improved the classification results for all combination of fusion of texture models. In all feature selection methods, the dominant features are selected. When analyzed we observed that, the SBS method on fusion of GLTP and Wavelets has selected only 15 features out of 55 features (GLTP – 46 features and Wavelets – 9 features). Out of 15 features, 10 features are from the GLTP and 5 features are from the WD. Therefore, the GLTP has more number of discriminating features with WD features and improve the classification accuracy. Similarly, the SFS on fusion of GLTP and LBP has selected only 6 features out of 56 features (GLTP – 46 features and LBP – 10 features). All 6 features are from the GLTP alone. This indicates that the LBP has no discriminating dominant features when it is with the GLTP features. Further, the SFBS on fusion of GLTP, LBP and WD has selected only 8 features. Out of 8 features, 4 features are from the GLTP and 4 features are from the WD. No discriminating features of LBP are selected when they are with GLTP and WD features.
The above observations make it clear that the GLTP and WD features have more discriminating and dominating features when compared to the other texture models such as LBP, LBPV and Gabor response.
VI. CONCLUSION
In this paper, we presented a novel model based on texture features for classification of kannada characters. We made a successful attempt to explore the applicability of texture features and wrapper feature selection methods for effective classification of character classification. In order to investigate the effectiveness and robustness of the proposed model, we conducted series of experiments on our own large dataset.
VII. REFERENCES 1. Hanmandlu M, A V
Forgaging , 6th IEEE/ACIS International Conference on Computer and Information Science(ICIS 2007), Computer Society, 2007.
2. S.V. Rajashekararadhya and Dr. P. Vanaja Ranjan, Efficient zone based feature extraction algorithm for handwritten numeral recogni- tion of four popular south Indian scripts, Journal of Theoretical and Applied Information Technology, pp. 1171-1180, 2005-06.
3. U. Pal, T. Wakabayashi, N. Sharma and F. Kimura, Handwritten Numeral Recognition of Six Popular Indian Scripts. In Proc. 9th In- ternational Conference on Document Analysis and Recognition. Curitiba, Brazil, September 24-26, pp. 749-753, 2007.
4. Benne R.G.,Dhandra B.V and Mallikarjun Hangarge, Tri-scripts handwritten numeral recognition: a novel approach:, Advances in Computational Research, Volume 1, Issue 2, pp 47-51, 2009.
5. Dinesh Acharya U, N V Subbareddy and Krishnamoorthy, Multi- level Classifier in Recognition of Handwritten Kannada Numeral, Proceedings of World Academy of Science, Engineering and Tech- nology, Vol. 32, pp 308- 313,2008. 6. G. G. Rajput and Mallikarjun Hangarge, Recognition of
Isolated Kannada Numeral Based on Image Fusion Method. PReMI 2007, LNCS 4815, pp. 153– 160, 2007.
7. B.V.Dhandra, Mallikarjun Hangarge and Gururaj Mukarambi. Spa- tial Features for Handwritten Kannada and English Character Recognition. IJCA, Special Issue on RTIPPR (3), pp 146–151, 2010.
8. Ragha, L.R., Sasikumar, M.: Feature Analysis for Handwritten Kannada Kagunita Recognition. International Journal of Computer Theory and Engineering, IACSIT 3(1), 1793–8201, 2011.
9. Suresh Kumar D, Ajay Kumar B R, K Srinivas Kalyan, Kannada Character Recognition System using Neural Network, National Journal on Internet Computing, Vol-1, 33-35, 2007.
10. Zhang, Jun & Hu, Jinglu (2008). "Image segmentation based on 2D Otsu method with histogram analysis". Computer Science and Software Engineering, 2008 International Conference on. 6: 105– 108.
11. Zhu, Ningbo and Wang, Gang and Yang, Gaobo and Dai, Weiming (2009). "A fast 2d otsu thresholding algorithm based on improved histogram". Pattern Recognition, 2009. CCPR 2009. Chinese Con- ference on: 1–5.
12. ]Ojala T., M. Pietikainen and T. Maenapaa, 2002. Multiresolution gray-scale and rotation invariant texture classification with Local Binary Patterns. IEEE Transactions on Pattern Analysis and Ma- chine Intelligence, vol. 24. no. 7, pp. 971-987.
13. Guo Z., L. Zhang and D. Zhang, 2010. Rotation invariant texture classification using LBP Variance (LBPV) with global matching. Pattern Recognition, vol. 43, Pp. 706-719.
14. Surliandi A and K. Ramar, 2008. Local Texture Patterns - A uni- variate texture model for classification of images. Proceedings of the 16th International Conference on Advanced Computing and Communications (ADCOM08), Tamilnadu, India, pp. 32-39
15. Jain A., K. Nandakumaran and A. Ross, 2005. Score normalization in multimodal biometric systems. Pattern Recognition, vol. 38, pp. 2270-2285.
16. Kira K and L. Rendel, 1992. The feature selection problem: tradi- tional methods and a new algorithm. Proceedings of the Tenth Na- tional Conference on Artificial Intelligence, San Jose, USA, pp. 129-134.
17. Hall M., 2000. Correlation-based feature selection for discrete and numeric class machine learning. Proceedings of the Seventeenth In- ternational Conference on Machine Learning, Stanford, USA, pp. 359-366.
sequen- tial floating forward feature selection with the Bayes
classifier ap- plied to speech emotion recognition. Signal Processing, vol. 88, no. 12, pp. 2956-2970.
19. K.P. Zaw and Z.M. Kyu, “Segmentation Method for Myanmar Character Recognition using Block based Pixel Count and Aspect Ratio”, 27th International Conference on Computer Theory and Application (ICCTA), October 2017
[image:6.595.302.590.59.429.2]20. H. S. Mohana, R. Pradeepa, B. Rajithkumar BK and M. Shiva- kumar, “Printed and Handwritten Mixed Kannada Characters Recognition using Template Matching Method. International Journal of Electronic and Communication Technology, Vol. 6, Iss. 2, 2015.
Figure 3: Sample Character images of different class mpatterns
Table 1: Examples for U
[image:6.595.311.561.429.686.2]Figure 4.
Classification accuracy of the proposed model for classification based on individual texture models in experiment 1 (30% training sample
[image:7.595.88.560.354.646.2]Figure 6. Classification accuracy of the proposed model for classification based on individual texture models in experiment 3 (50% training samples)
[image:8.596.74.547.403.708.2]International Journal of Innovative Technology and Exploring Engineering (IJITEE) ISSN: 2278-3075, Volume-8 Issue-6S2, April 2019
[image:9.595.58.267.109.375.2]148 Published By: Table 2. Classification accuracy of the proposed model based on fusion of
[image:9.595.49.279.418.622.2]all five texture models
Table 3: Classification accuracy of the proposed model based on fusion of two texture models at a time and feature selection method
Texture features
Feature selection methods
SFS SFFS SBS SFBS
GLTP 88.034 87.415 88.023 87.9115
LBPV 84.591 83.292 84.883 83.9350
GFR 87.540 87.163 88.652 86.5317
WD 86.965 87.408 90.434 86.0550
LBP 78.413 78.539 79.331 79.0528
Table 4. Classification accuracy of the proposed model based on fusion of all five texture models at a time and feature selection method
Texture features
Feature selec- tion methods
SFS SFFS SBS SFBS
GLTP + LBP
+ 70.84 69.42 71.38 68.54
LBPV + GFR + WD Textur e features
Simi- larity
Mini- mum
Maxi-
mum Avg.
Meas ures
accu- racy
accura- cy
accu- racy Euclidea
n
51.67 56.16 53.9
GLTP + LBP +
Distance
Chisquare
53.39 58.65 56.20 LBPV +
GFR + distance WD
G- statistic
[image:9.595.51.279.669.783.2]