CLOUD COMPUTING
Gregor von Laszewski
CLOUD COMPUTING
1 PREFACE1.1 Learning Objectives ☁ 1.2 ePub Readers ☁
1.3 Corrections ☁ 1.4 Contributors ☁ 1.5 Notation ☁
1.5.1 Figures
1.5.2 Hyperlinks in the document 1.5.3 Equations
1.5.4 Tables 1.6 Updates ☁ 2 OVERVIEW ☁
3 DEFINITION OF CLOUD COMPUTING ☁ 3.1 Defining the term Cloud Computing 3.2 History and Trends
3.3 Job as a Cloud/Data Engineer 3.4 You must be that TALLL 4 DATACENTER
4.1 Data Center ☁
4.1.1 Motivation: Data 4.1.1.1 How much data? 4.1.2 Cloud Data Centers
4.1.3 Data Center Infrastructure 4.1.4 Data Center Characteristics 4.1.5 Data Center Metrics
4.1.5.1 Data Center Energy Costs 4.1.5.2 Data Center Carbon Footprint 4.1.5.3 Data Center Operational Impact 4.1.5.4 Power Usage Effectiveness 4.1.5.5 Hot-Cold Aisle
4.1.5.5.1 Containment
4.1.5.5.1.1 Water Cooled Doors 4.1.5.6 Workload Monitoring
4.1.5.6.2 Scientific Impact Metric
4.1.5.6.3 Clouds and Virtual Machine Monitoring 4.1.5.6.4 Workload of Containers
4.1.6 Example Data Centers 4.1.6.1 AWS
4.1.6.2 Azure 4.1.6.3 Google 4.1.6.4 IBM 4.1.6.5 XSEDE
4.1.6.5.1 Comet 4.1.6.5.2 Jetstream 4.1.6.6 Chameleon Cloud 4.1.6.7 Indiana University 4.1.6.8 Shipping Containers 4.1.7 Server Consolidation
4.1.8 Data Center Improvements and Consolidation 4.1.9 Project Natick
4.1.10 Renewable Energy for Data Centers 4.1.11 Societal Shift Towards Renewables 4.1.12 Datacenter Risks and Issues
4.1.13 Exercises 5 ARCHITECTURE
5.1 Architectures ☁
5.1.1 Evolution of Compute Architectures 5.1.1.1 Mainframe Computing
5.1.1.2 PC Computing
5.1.1.3 Intranet and Server Computing 5.1.1.4 Grid Computing Computing 5.1.1.5 Internet Computing
5.1.1.6 Cloud Computing 5.1.1.7 Mobile Computing
5.1.1.8 Internet of Things Computing 5.1.1.9 Edge Computing
5.1.1.10 Fog Computing
5.1.5 Cloud Security Alliance Reference Architecture 5.1.6 Multicloud Architectures
5.1.6.1 Cloudmesh Architecture 5.1.7 Resources
5.2 NIST Big Data Referenece Architecture ☁ 5.2.1 Pathway to the NIST-BDRA
5.2.2 Big Data Characteristics and Definitions 5.2.3 Big Data and the Cloud
5.2.4 Big Data, Edge Computing and the Cloud 5.2.5 Reference Architecture
5.2.6 Framework Providers 5.2.7 Application Providers 5.2.8 Fabric
5.2.9 Interface definitions
5.3 The Y-Scheduling Architecture View ☁ 6 REST
6.1 Introduction to REST ☁ 6.1.0.1 Collection of Resources 6.1.0.2 Single Resource
6.1.0.3 REST Tool Classification 6.2 OPENAPI 3.0
6.2.1 REST Specifications ☁ 6.2.1.1 OPENAPI
6.2.1.1.1 Open API 3.0 Specification (OAS 3.0) 6.2.1.1.1.1 Definitions
6.2.1.2 RAML
6.2.1.3 API Blueprint 6.2.1.4 JsonAPI 6.2.1.5 Tinyspec 6.2.1.6 Tools
6.2.1.6.1 Connexion
6.2.2 OpenAPI 3.0 REST Service via Introspection ☁ 6.2.2.1 Verification
6.2.2.2 Swagger-UI 6.2.2.3 Mock service 6.2.2.4 Exercise
6.2.3.1 Service Endpoints/ Paths 6.2.3.1.1 Path kmeans/upload
6.2.3.1.2 Path kmeans/fit
6.2.3.1.3 Path kmeans/predict
6.2.3.2 Files
6.2.3.3 Running the example 6.2.3.4 Notes
6.3 Flask RESTful Services ☁ 6.4 Django REST Framework ☁ 6.5 Github REST Services ☁
6.5.1 Issues 6.5.2 Exercise
6.6 OpenAPI REST Services with Swagger ☁ 6.6.1 Swagger Tools
6.6.2 Swagger Community Tools
6.6.2.1 Converting Json Examples to OpenAPI YAML Models 6.7 REST WITH EVE
6.7.1 Rest Services with Eve ☁
6.7.1.1 Ubuntu install of MongoDB 6.7.1.2 macOS install of MongoDB
6.7.1.3 Windows 10 Installation of MongoDB 6.7.1.4 Database Location
6.7.1.5 Verification
6.7.1.6 Building a simple REST Service 6.7.1.7 Interacting with the REST service 6.7.1.8 Creating REST API Endpoints
6.7.1.9 REST API Output Formats and Request Processing 6.7.1.10 REST API Using a Client Application
6.7.1.11 Towards cmd5 extensions to manage eve and mongo 6.7.2 HATEOAS ☁
6.7.2.1 Filtering
6.7.2.2 Pretty Printing 6.7.2.3 XML
6.7.3 Extensions to Eve ☁
6.7.3.1 Object Management with Eve and Evegenie 6.7.3.1.1 Installation
6.7.3.1.3 Creating your own objects 6.8 OPENAPI 2.0
6.8.1 OpenAPI 2.0 Specification ☁
6.8.1.1 The Virtual Cluster example API Definition 6.8.1.1.1 Terminology
6.8.1.1.2 Specification 6.8.1.2 References
6.8.2 OpenAPI REST Service via Introspection ☁ 6.8.2.1 Verification
6.8.2.2 Mock service 6.8.2.3 Exercise
6.8.3 OpenAPI REST Service via Codegen ☁ 6.8.3.1 Step 1: Define Your REST Service
6.8.3.2 Step 2: Server Side Stub Code Generation and Implementation 6.8.3.2.1 Setup the Codegen Environment
6.8.3.2.2 Generate Server Stub Code 6.8.3.2.3 Fill in the actual implementation 6.8.3.3 Step 3: Install and Run the REST Service:
6.8.3.3.1 Start a virtualenv:
6.8.3.3.2 Make sure you have the latest pip:
6.8.3.3.3 Install the requirements of the server side code: 6.8.3.3.4 Install the server side code package:
6.8.3.3.5 Run the service
6.8.3.3.6 Verify the service using a web browser: 6.8.3.4 Step 4: Generate Client Side Code and Verify
6.8.3.4.1 Client side code generation:
6.8.3.4.2 Install the client side code package:
6.8.3.4.3 Using the client API to interact with the REST service 6.8.3.5 Towards a Distributed Client Server
6.9 Exercises ☁ 7 GRAPHQL ☁
7.1 Prerequisites
7.1.1 Install Graphene 7.1.2 Install Django 7.1.3 Install GraphiQL
7.2.2 Scalar Types
7.2.3 Enumeration Types 7.2.4 Interfaces
7.2.5 Union Types 7.3 GraphQL Query
7.3.1 Fields 7.3.2 Arguments 7.3.3 Fragments 7.3.4 Variables 7.3.5 Directives 7.3.6 Mutations
7.3.7 Query Validation 7.4 GraphQL in Python
7.5 Developing your own GraphQL Server 7.5.1 GraphQL server implementation 7.5.2 GraphQL Server Querying 7.5.3 Mutation example
7.5.4 GraphQL Authentication
7.5.5 JSON Web Token Authentication 7.5.5.1 Using Authentication with Curl 7.5.5.2 Expiration of JWT tokens 7.5.6 GitHub API v4
7.6 Dynamic Queries with GraphQL 7.7 Advantages of Using GraphQL 7.8 Disadvantages of Using GraphQL 7.9 Conclusion
7.9.1 Resources 7.10 Excersises 8 HYPERVISOR
8.1 Virtualization ☁ 8.1.1 Virtual Machines
8.1.2 System Virtual Machines 8.1.3 Hosted Virtualization 8.1.4 Summary
8.1.6 Virtualization Technologies
8.1.6.1 Selected Hardware Virtualization Technologies 8.1.6.2 AMD-V and Intel-VT
8.1.6.3 I/O MMU virtualization (AMD-Vi and Intel VT-d) 8.1.6.4 Selected VM Virtualization Software and Tools
8.1.6.4.1 Libvirt 8.1.6.4.2 QEMU 8.1.6.4.3 KVM
8.1.6.4.3.1 KVM vs QEMU 8.1.6.4.4 Xen
8.1.6.4.5 Hyper-V 8.1.6.4.6 VMWare 8.1.6.5 Parallels
8.1.6.5.1 VirtualBox
8.1.6.5.2 Wine – Wine is not an emulator 8.1.6.5.3 Comparison of some technologies
8.1.6.6 Selected Storage Virtualization Software and Tools 8.1.6.7 Selected Network Virtualization Software and Tools 8.2 Virtual Machine Management with QEMU ☁
8.2.1 Install QEMU
8.2.2 Create a Virtual Hard Disk with QEMU 8.2.3 Install Ubuntu on the Virtual Hard Disk 8.2.4 Start Ubuntu with QEMU
8.2.5 Emulate Raspberry Pi with QEMU 8.2.6 Resources
8.3 Manage VM guests with virsh ☁ 9 IAAS
9.1 Introduction ☁
9.2 Amazon Web Services ☁ 9.2.1 AWS Products
9.2.1.1 Virtual Machine Infrastructure as a Services 9.2.1.2 Container Infrastructure as a Service
9.2.1.3 Serverless Compute using AWS Lambda 9.2.1.4 Serverless Compute using AWS Lambda 9.2.1.5 Storage
9.2.3 Creating an account
9.2.4 AWS Command Line Interface 9.2.4.1 Introduction
9.2.4.2 Prerequisites 9.2.4.2.1 Install CLI 9.2.4.2.2 Configure CLI 9.2.5 AWS Admin Access
9.2.5.1 Introduction 9.2.5.2 Prerequisites
9.2.5.3 Setting up admin access using AWS CLI 9.2.5.3.1 Create an admin security group
9.2.5.3.2 Assign a security policy to the created group granting full admin access
9.2.6 Understanding the free tier 9.2.7 Important Notes
9.2.8 Introduction to the AWS console 9.2.8.1 Starting a VM
9.2.8.1.1 Setting up key pair 9.2.8.2 Stopping a VM
9.2.9 Access from the Command Line 9.2.10 Access from Python
9.2.11 Boto 9.2.12 libcloud
9.3 Microsoft Azure ☁ 9.3.1 Products
9.3.1.1 Virtual Machine Infrastructure as a Services 9.3.1.2 Container Infrastructure as a Service
9.3.1.3 Databases 9.3.1.4 Networking 9.3.2 Registration
9.3.3 Introduction to the Azure Portal 9.3.4 Creating a VM
9.3.5 Create a Ubuntu Server 18.04 LTS Virtual Machine in Azure 9.3.6 Remote access the Virtual Machine
9.4 What is IBM Watson and why is it important? ☁ 9.4.1 How can we use Watson?
9.4.2 Creating an account
9.4.3 Understanding the free tier 9.5 Google IaaS Cloud Services ☁
9.5.1 Cloud Computing Services and Products 9.5.1.1 Overview
9.5.1.2 AI and Machine Learning 9.5.1.3 API management
9.5.1.4 Compute 9.5.1.5 Data Analytics 9.5.1.6 Databases
9.5.1.7 Developer Tools 9.5.1.8 Internet of Things 9.5.1.9 Management Tools 9.5.1.10 Media and Migration 9.5.2 Migration
9.5.2.1 Networking 9.5.2.2 Security 9.5.2.3 Storage
9.5.2.4 Google IaaS Example
9.5.2.5 Google Cloud Console Overview 9.5.2.6 Use GCP Resources
9.5.2.7 Project navigation
9.5.2.8 Navigate Google Cloud Services 9.5.2.9 Section pinning
9.5.2.10 View activity across your GCP resources 9.5.2.11 Search across Cloud Console
9.5.2.12 Get support anytime
9.5.2.13 Manage users and permissions
9.5.2.14 Access the command line from your browser 9.5.3 Create a VM Example
9.5.3.1 Create a virtual machine instance 9.5.3.2 VM instances page
9.5.3.6 Cleanup 9.6 OpenStack ☁
9.6.1 Introduction
9.6.2 OpenStack Architecture 9.6.3 Components
9.6.4 Core Services
9.6.4.1 Nova - Compute
9.6.4.2 Glance - Image Services 9.6.4.3 Swift - Object Storage 9.6.4.4 Cinder - Block Storage 9.6.4.5 Neutron - Networking 9.6.4.6 Horizon - Dashboard
9.6.4.7 Keystone - Identity Service 9.6.4.8 Ceilometer - Telemetry 9.6.4.9 Heat - Orchestration
9.6.5 Access from Python and Scripts 9.6.5.1 Libcloud
9.6.5.2 DevStack 9.7 Python Libcloud ☁
9.7.1 Service categories 9.7.1.0.1 Compute
9.7.1.0.2 Key Pair Management 9.7.1.0.3 Block Storage
9.7.2 Installation 9.7.3 Quick Example
9.7.4 Managing your cloud credentials 9.7.5 Working with cloud services
9.7.5.1 Authenticating with cloud providers 9.7.5.1.1 Amazon AWS
9.7.5.1.2 Azure
9.7.5.1.2.1 Azure Classic Driver 9.7.5.1.2.2 Azure New Driver 9.7.5.1.3 OpenStack
9.7.5.1.4 Google
9.7.5.2.3 Starting Nodes 9.7.5.2.4 Stoping Nodes
9.7.6 Cloudmesh Community Program to Manage Clouds 9.7.7 Amazon Simple Storage Service S3 via libcloud
9.7.7.1 Access key
9.7.7.2 Create a new bucket on AWS S3 9.7.7.3 List Containers
9.7.7.4 List container objects 9.7.7.5 Upload a file
9.7.7.6 References 9.8 AWS Boto ☁
9.8.1 Boto versions 9.8.2 Boto Installation 9.8.3 Access key
9.8.4 Boto configuration
9.8.5 Boto configuration with cloudmesh 9.8.6 EC2 interface of Boto
9.8.6.0.1 Create connection 9.8.7 List EC2 instances
9.8.7.0.1 Launch a new instance 9.8.7.0.2 Check running instances 9.8.7.0.3 Stop instance
9.8.7.0.4 Terminate instance 9.8.7.1 Reboot instances
9.8.8 Amazon S3 interface of Boto 9.8.8.0.1 Create connection
9.8.8.0.2 Create new bucket in S3 9.8.8.0.3 Upload data
9.8.8.0.4 List all buckets
9.8.8.0.5 List all objects in a bucket 9.8.8.0.6 Delete object
9.8.8.0.7 Delete bucket 9.8.9 References
9.8.10 Excersises 10 MAPREDUCE
10.1.1.1 MapReduce Example: Word Count 10.1.2 Hadoop MapReduce and Hadoop Spark
10.1.2.1 Apache Spark
10.1.2.2 Hadoop MapReduce 10.1.2.3 Key Differences 10.1.3 References
10.2 HADOOP 10.2.1 Hadoop ☁
10.2.1.1 Hadoop and MapReduce 10.2.1.2 Hadoop EcoSystem 10.2.1.3 Hadoop Components
10.2.1.4 Hadoop and the Yarn Resource Manager 10.2.1.5 PageRank
10.2.2 Installation of Hadoop ☁ 10.2.2.1 Releases
10.2.2.2 Prerequisites
10.2.2.3 User and User Group Creation 10.2.2.4 Configuring SSH
10.2.2.5 Installation of Java 10.2.2.6 Installation of Hadoop
10.2.2.7 Hadoop Environment Variables
10.2.3 Hadoop Distributed File System (Hadoop HDFS) ☁ 10.2.3.1 Introduction
10.2.3.2 Features
10.2.3.3 HDFS Components
10.2.3.3.1 NameNode and DataNodes 10.2.3.4 Usage
10.2.3.4.1 Java Client API 10.2.3.4.2 FS Shell
10.2.3.5 References 10.2.3.6 Exercises 10.2.4 Apache HBase ☁
10.2.4.1 Introduction 10.2.4.2 Features 10.2.4.3 Configuration 10.2.4.4 Usage
10.2.4.4.2 Create a table 10.2.4.4.3 Describe a table
10.2.4.4.4 HBase MapReduce job 10.2.4.5 References
10.2.5 Hadoop Virtual Cluster Installation Using Cloudmesh ☁ 10.2.5.1 Cloudmesh Cluster Installation
10.2.5.1.1 Create Cluster
10.2.5.1.2 Check Created Cluster 10.2.5.1.3 Delete Cluster
10.2.5.2 Hadoop Cluster Installation 10.2.5.2.1 Create Hadoop Cluster 10.2.5.2.2 Delete Hadoop Cluster 10.2.5.3 Advanced Topics with Hadoop
10.2.5.3.1 Hadoop Virtual Cluster with Spark and/or Pig 10.2.5.3.2 Word Count Example on Spark
10.3 SPARK
10.3.1 Spark Lectures ☁
10.3.1.1 Motivation for Spark 10.3.1.2 Spark RDD Operations 10.3.1.3 Spark DAG
10.3.1.4 Spark vs. other Frameworks 10.3.2 Installation of Spark ☁
10.3.2.1 Prerequisites
10.3.2.2 Installation of Java
10.3.2.3 Install Spark with Hadoop 10.3.2.4 Spark Environment Variables 10.3.2.5 Test Spark Installation
10.3.2.6 Install Spark With Custom Hadoop 10.3.2.7 Configuring Hadoop
10.3.2.8 Test Spark Installation 10.3.3 Spark Streaming ☁
10.3.3.1 Streaming Concepts
10.3.3.2 Simple Streaming Example
10.3.3.3 Spark Streaming For Twitter Data 10.3.3.3.1 Step 1
10.3.3.3.4 Step 4 10.3.3.3.5 step 5 10.3.3.3.6 step 6
10.3.4 User Defined Functions in Spark ☁ 10.3.4.1 Resources
10.3.4.2 Instructions for Spark installation 10.3.4.2.1 Linux
10.3.4.3 Windows 10.3.4.4 MacOS
10.3.4.5 Instructions for creating Spark User Defined Functions 10.3.4.5.1 Example: Temperature conversion
10.3.4.5.1.1 Description about data set
10.3.4.5.1.2 How to write a python program with UDF 10.3.4.5.1.3 How to execute a python spark script 10.3.4.5.1.4 Filtering and sorting
10.3.4.6 Instructions to install and run the example using docker 10.4 HADOOP ECOSYSTEM
10.4.1 ELASTIC MAP REDUCE
10.4.1.1 AWS Elastic Map Reduce (AWS EMR) ☁ 10.4.1.1.1 Introduction
10.4.1.1.2 Why EMR?
10.4.1.1.3 Understanding Clusters and Nodes 10.4.1.1.4 Prerequisites
10.4.1.1.5 Creating EMR Cluster Using CLI 10.4.1.1.5.1 Create Security Roles
10.4.1.1.5.2 Setting up authentication
10.4.1.1.5.3 Determine the applicable subnet 10.4.1.1.5.4 Create the EMR cluster
10.4.1.1.5.5 Check the status of your cluster 10.4.1.1.5.6 Terminate your cluster
10.4.1.1.6 Creating EMR Cluster Using AWS Web Console 10.4.1.1.6.1 Set up authentication
10.4.1.1.6.2 Create the EMR cluster
10.4.1.1.6.3 View status and terminate EMR cluster 10.4.1.1.6.4 Submit Work to a Cluster
10.4.1.1.8 Create EMR in AWS 10.4.1.1.8.1 Create the buckets 10.4.1.1.8.2 Create Key Pairs
10.4.1.1.9 Create Step Execution – Hadoop Job 10.4.1.1.10 Create a Hive Cluster
10.4.1.1.10.1 Create a Hive Cluster - Screen shots 10.4.1.1.11 Create a Spark Cluster
10.4.1.1.11.1 Create a Spark Cluster - Screenshots 10.4.1.1.12 Run an example Spark job on an EMR cluster
10.4.1.1.12.1 Spark Job Description 10.4.1.1.12.2 Creating the S3 bucket 10.4.1.1.12.3 Copy files to S3
10.4.1.1.12.4 Execute the Spark job on a running cluster 10.4.1.1.12.5 Execute the Spark job while creating clusters 10.4.1.1.12.6 View the results of the Spark job
10.4.1.1.13 Conclusion 10.4.2 TWISTER
10.4.2.1 Twister2 ☁ 10.4.2.1.1 Introduction 10.4.2.1.2 Twister2 API’s
10.4.2.1.2.1 TSet API 10.4.2.1.2.2 Task API 10.4.2.1.3 Operator API
10.4.2.1.3.1 Resources 10.4.2.2 Twister2 Installation ☁
10.4.2.2.1 Prerequisites
10.4.2.2.1.1 Maven Installation 10.4.2.2.1.2 OpenMPI Installation 10.4.2.2.1.3 Install Extras
10.4.2.2.1.4 Compiling Twister2 10.4.2.2.1.5 Twister2 Distribution 10.4.2.3 Twister2 Examples ☁
10.4.2.3.1 Submitting a Job
10.4.2.3.2 Batch WordCount Example 10.4.3 HADOOP RDMA ☁
10.4.3.2 Launching Virtual Machines Manually
10.4.3.3 Extra Initialization when Launching Virtual Machines
10.4.3.4 Important Note for Tearing Down Virtual Machines and Deleting Network Ports
11 CONTAINER
11.1 Introduction to Containers ☁ 11.1.1 Motivation - Microservices
11.1.2 Motivation - Serverless Computing 11.1.3 Docker
11.1.4 Docker and Kubernetes 11.2 DOCKER
11.2.1 Introduction to Docker ☁ 11.2.1.1 Docker Engine
11.2.1.2 Docker Architecture 11.2.1.3 Docker Survey
11.2.2 Running Docker Locally ☁ 11.2.2.1 Instillation for OSX 11.2.2.2 Installation for Ubuntu 11.2.2.3 Installation for Windows 10 11.2.2.4 Testing the Install
11.2.3 Dockerfile ☁ 11.2.3.1 Specification 11.2.3.2 References 11.2.4 Docker Hub ☁
11.2.4.1 Create Docker ID and Log In 11.2.4.2 Searching for Docker Images 11.2.4.3 Pulling Images
11.2.4.4 Create Repositories 11.2.4.5 Pushing Images 11.2.4.6 Resources
11.2.5 Docker Compose ☁ 11.2.5.1 Introduction 11.2.5.2 Installation
11.2.5.2.1 Install on MacOS 11.2.5.2.2 Install on Linux
11.2.5.2.4 Test the installation
11.2.5.3 Docker Compose File Directives 11.2.5.3.1 Configuration
11.2.5.3.1.1 build
11.2.5.3.1.2 context
11.2.5.3.1.3 ARGS
11.2.5.3.1.4 command
11.2.5.3.1.5 depends_on
11.2.5.3.1.6 image 11.2.5.3.1.7 ports 11.2.5.3.1.8 volumes 11.2.5.4 Usages
11.2.5.4.1 Build A Service depending on MongoDB 11.3 DOCKER PAAS
11.3.1 Docker Clusters ☁ 11.3.2 Docker Swarm ☁
11.3.2.1 Terminology
11.3.2.2 Creating a Docker Swarm Cluster
11.3.2.3 Create a Swarm Cluster with VirtualBox
11.3.2.4 Initialize the Swarm Manager Node and Add Worker Nodes 11.3.2.5 Deploy the application on the swarm manager
11.3.3 Docker and Docker Swarm on FutureSystems ☁ 11.3.3.1 Getting Access
11.3.3.2 Creating a service and deploy to the swarm cluster 11.3.3.3 Create your own service
11.3.3.4 Publish an image privately within the swarm cluster 11.3.3.5 Exercises
11.3.4 Hadoop with Docker ☁
11.3.4.1 Building Hadoop using Docker 11.3.4.2 Hadoop Configuration Files 11.3.4.3 Virtual Memory Limit
11.3.4.4 hdfs Safemode leave command 11.3.4.5 Examples
11.3.4.5.1 Statistical Example with Hadoop 11.3.4.5.1.1 Base Location
11.3.4.5.1.4 Archiving Class Files 11.3.4.5.1.5 HDFS for Input/Output
11.3.4.5.1.6 Run Program with a Single Input File 11.3.4.5.1.7 Result for Single Input File
11.3.4.5.1.8 Run Program with Multiple Input Files 11.3.4.5.1.9 Result for Multiple Files
11.3.4.5.2 Conclusion 11.3.4.6 Refernces
11.3.5 Docker Pagerank ☁
11.3.5.1 Use the automated script 11.3.5.2 Compile and run by hand 11.3.6 Apache Spark with Docker ☁
11.3.6.1 Pull Image from Docker Repository 11.3.6.2 Running the Image
11.3.6.2.1 Running interactively 11.3.6.2.2 Running in the background 11.3.6.3 Run Spark
11.3.6.3.1 Run Spark in Yarn-Client Mode 11.3.6.3.2 Run Spark in Yarn-Cluster Mode
11.3.6.4 Observe Task Execution from Running Logs of SparkPi 11.3.6.5 Write a Word-Count Application with Spark RDD
11.3.6.5.1 Launch Spark Interactive Shell 11.3.6.5.2 Program in Scala
11.3.6.5.3 Launch PySpark Interactive Shell 11.3.6.5.4 Program in Python
11.3.6.6 Docker Spark Examples 11.3.6.6.1 K-Means Example 11.3.6.6.2 Join Example 11.3.6.6.3 Word Count 11.3.6.7 Interactive Examples
11.3.6.7.1 Stop Docker Container
11.3.6.7.2 Start Docker Container Again 11.3.6.7.3 Remove Docker Container 11.4 KUBERNETES
11.4.1.3 Kubernetes Architecture 11.4.1.4 Minikube
11.4.1.4.1 Install minikube
11.4.1.4.2 Start a cluster using Minikube 11.4.1.4.3 Create a deployment
11.4.1.4.4 Expose the servi 11.4.1.4.5 Check running status 11.4.1.4.6 Call service api
11.4.1.4.7 Take a look from Dashboard 11.4.1.4.8 Delete the service and deployment 11.4.1.4.9 Stop the cluster
11.4.1.5 Interactive Tutorial Online
11.4.2 Using Kubernetes on FutureSystems ☁ 11.4.2.1 Getting Access
11.4.2.2 Example Use 11.4.2.3 Exercises
11.5 Running Singularity Containers on Comet ☁ 11.5.1 Background
11.5.2 Tutorial Contents 11.5.3 Why Singularity? 11.5.4 Hands-On Tutorials
11.5.5 Downloading & Installing Singularity 11.5.5.1 Download & Unpack Singularity 11.5.5.2 Configure & Build Singularity 11.5.5.3 Install & Test Singularity 11.5.6 Building Singularity Containers
11.5.6.1 Upgrading Singularity 11.5.7 Create an Empty Container
11.5.8 Import Into a Singularity Container 11.5.9 Shell Into a Singularity Container 11.5.10 Write Into a Singularity Container 11.5.11 Bootstrapping a Singularity Container 11.5.12 Running Singularity Containers on Comet
11.5.12.1 Transfer the Container to Comet 11.5.12.2 Run the Container on Comet
11.5.12.5 Use Existing Comet Containers 11.5.13 Using Tensorflow With Singularity 11.5.14 Run the job
11.5.15 Resources ☁ 11.5.15.1 Tutorialspoint 11.6 Exercises ☁
12 SERVERLESS 12.1 FaaS ☁
12.1.1 Introduction
12.1.2 Serverless Computing 12.1.3 Faas provider
12.1.4 Resources
12.1.5 Usage Examples 12.2 AWS Lambda ☁
12.2.1 AWS Lambda Features
12.2.2 Understanding Function limitations 12.2.2.1 Execution Time
12.2.2.2 Function size
12.2.3 Understanding the free Tier
12.2.4 Writing your fist Lambda function 12.2.5 AWS Lambda Usecases
12.2.6 AWS Lambda Example 12.3 Apache OpenWhisk ☁
12.3.1 OpenWhisk Workflow 12.3.1.1 The Action and Nginx
12.3.1.2 Controller: The System’s Interface 12.3.1.3 CouchDB
12.3.1.4 Load Balancer 12.3.1.5 Kafka
12.3.1.6 Invoker
12.3.1.7 CouchDB again
12.3.2 Setting Up OpenWhisk Locally 12.3.2.1 Debugging quick-start 12.3.3 Hello World in OpenWhisk 12.3.4 Creating a custom action 12.4 Kubeless ☁
12.4.2 Programing model 12.4.3 System Architecture
12.5 Microsoft Azure Function ☁ 12.6 Google Cloud Functions ☁
12.6.1 Google Cloud Function Example 12.7 OpenFaaS ☁
12.7.1 OpenFaas Components and Architecture 12.7.1.1 API Gateway
12.7.1.2 Function Watchdog 12.7.1.3 OpenFaas CLI 12.7.1.4 Monitoring 12.7.2 OpenFaas in Action
12.7.2.1 Prerequistics
12.7.2.2 Single Node Cluster 12.7.2.3 Deploy OpenFaas 12.7.2.4 To Run OpenFaas
12.7.3 OpenFaaS Function with Python 12.8 OpenLamda ☁
12.8.1 Suggested Materials 12.8.2 Development
12.8.3 OpenLambda 12.8.4 Getting Started
12.8.4.1 Install Dependencies 12.8.4.2 Start a Test Cluster 12.8.5 Administration
12.8.5.1 Writing Handlers 12.8.5.2 Cluster Directory 12.8.6 Configuration
12.8.7 Architecture 13 MESSAGING
13.1 MQTT ☁
13.1.1 Introduction
13.1.2 Publish Subscribe Model 13.1.2.1 Topics
13.1.2.2 Callbacks
13.1.3.1 Using TLS/SSL 13.1.3.2 Using OAuth
13.1.4 Integration with Other Services 13.1.5 MQTT in Production
13.1.6 Installation
13.1.6.1 MacOS install
13.1.6.2 MacOS Advanced Service install 13.1.6.3 Ubuntu install
13.1.6.4 Raspberry Pi Setup 13.1.6.4.1 Broker
13.1.6.4.2 Client 13.1.7 Server Usecase
13.1.8 IoT Use Case with a Raspberry PI 13.1.8.1 Requirements and Setup 13.1.8.2 Results
13.1.9 Conclusion 13.1.10 Exercises
13.2 Python Apache Avro ☁
13.2.1 Download, Unzip and Install 13.2.2 Defining a schema
13.2.3 Serializing 13.2.4 Deserializing 13.2.5 Resources 14 GO
14.1 Introduction to Go for Cloud Computing ☁ 14.1.1 Organization of the chapter
14.1.2 References 14.2 Installation ☁
14.3 Editors Supporting Go ☁ 14.4 Go Language ☁
14.4.1 Concurrency in Go
14.4.1.1 GoRoutines (execution) 14.4.1.2 Channels (communication) 14.4.1.3 Select (coordination)
14.5 Libraries ☁ 14.6 Go CMD ☁
14.6.2 DocOpts 14.7 Go REST ☁
14.7.1 Gorilla
14.7.2 REST, RESTful 14.7.3 Router
14.7.4 Full code 14.8 Open API ☁
14.8.1 Install from Homebrew 14.8.2 serve specification UI 14.8.3 validate a specification
14.8.4 Generate a Go OpenAPI server 14.8.5 generate a Go OpenAPI client 14.8.6 generate a spec from the source 14.8.7 generate a data model
14.8.8 other editors
14.9 Create an Echo service using Swagger and Go 14.9.1 Dependencies
14.9.2 Initialize a Golang project
14.9.3 Define APIs and generate code in Go 14.9.4 Implement the functionality
14.9.5 Run and test the server 14.9.6 References
14.10 Go Cloud ☁
14.10.1 Golang Openstack Client 14.10.2 OpenStack from Go
14.10.2.1 GohperCloud 14.10.2.1.1 Authentication 14.10.2.1.2 Virtual machines 14.10.2.1.3 Resources
14.11 Go Links ☁
14.11.1 Introductory Material 14.11.2 The GO Language 14.11.3 How popular is Go? 14.11.4 OpenAPI and Go 14.12 Exercises ☁
1 PREFACE
Sat Nov 23 05:21:29 EST 2019 ☁
1.1 L
EARNINGO
BJECTIVES☁
Learning Objectives
Learn about how we distribute material as ePub’s.
Learn how to create an ePub with our material from source. Introduce elementary notations we use in the ePub’s.
See who contributed to the ePub’s.
1.2
EP
UBR
EADERS☁
This document is distributed in ePub format. Every OS has a suitable ePub reader to view the document. Such readers can also be integrated into a Web browser so that when you click on an ePub it is automatically opened in your browser. As we use ePubs the document can be scaled based on the user’s preference If you ever see a content that does not fit on a page we recommend you zoom out to make sure you can see the entire content.
We have made good experiences with the following readers:
macOSX: Books, which is a build in ebook reader
Windows 10: Microsoft edge, but it must be the newest version, as older versions have bugs. Alternatively, use calibre
Linux: calibre
If you have an iPad or Tablet with enough memory, you may also be able to use them.
in very good rendering allowing you to see the source code without horizontal scrolling.
1.3 CORRECTIONS
☁
The material collected in this document is managed in
https://github.com/cloudmesh-community/book/chapters
In case you see an error or like to make a contribution of your own section or chapter, you can do so in github via pull requests.
The easiest way to fix an error is to read the ePub and click on the cloud symbol in a heading where you see the error. This will bring you to an editable document in github. You can directly fix the error in the web browser and create there a pull request. Naturally, you need to be signed into github before you can edit and create a pull request.
As a result contributors and authors will be integrated automatically next time we compile the material. Thus even if you corrected a single spelling error, you will be acknowledged.
1.4 C
ONTRIBUTORS☁
Contributors are sorted by the first letter of their combined Firstname and Lastname and if not available by their github ID. Please, note that the authors are identified through git logs in addition to some contributors added by hand. The git repository from which this document is derived contains more than the documents included in this document. Thus not everyone in this list may have directly contributed to this document. However if you find someone missing that has contributed (they may not have used this particular git) please let us know. We will add you. The contributors that we are aware of include:
Laszewski, Hyungro Lee, Ian Sims, IzoldaIU, Javier Diaz, Jeevan Reddy Rachepalli, Jonathan Branam, Juliette Zerick, Keith Hickman, Keli Fine, Kenneth Jones, Mallik Challa, Mani Kagita, Miao Jiang, Mihir Shanishchara, Min Chen, Murali Cheruvu, Orly Esteban, Pulasthi Supun, Pulasthi Supun Wickramasinghe, Pulkit Maloo, Qianqian Tang, Ravinder Lambadi, Richa Rastogi, Ritesh Tandon, Saber Sheybani, Sachith Withana, Sandeep Kumar Khandelwal, Sheri Sanders, Shivani Katukota, Silvia Karim, Swarnima H. Sowani, Tharak Vangalapat, Tim Whitson, Tyler Balson, Vafa Andalibi, Vibhatha Abeykoon, Vineet Barshikar, Yu Luo, ahilgenkamp, aralshi,
azebrowski, bfeng, brandonfischer99, btpope, garbeandy,
harshadpitkar, himanshu3jul, hrbahramian, isims1, janumudvari, joshish-iu, juaco77, karankotz, keithhickman08, kkp, mallik3006, manjunathsivan, niranda perera, qianqian tang, rajni-cs, rirasto, sahancha, shilpasingh21, swsachith, toshreyanjain, trawat87, tvangalapat, varunjoshi01, vineetb-gh, xianghang mi, zhengyili4321
1.5 N
OTATION☁
The material here uses the following notation. This is especially helpful, if you contribute content, so we keep the content consistent.
if you like to see the details on how to create them in the markdown documents, you will have to look at the file source while clicking on the cloud in the heading of the Notation section (Section 1.5). This will bring you to the markdown tex, but you will still have to look at the raw content to see the details.
☁ or 
If you click on the ☁ or in a heading, you can go directly to the > document in github that contains the next content. This is > convenient to fix errors or make additions to the content. The cloud will be automatically added upon inclusion of a new markdown file that includes in its first line a section header.
Content in bash is marked with verbatim text and a dollar sign
[1]
References are indicated with a number and are included in the > reference chapter [1]. Use it in markdown with > [@las14cloudmeshmultiple].
References must be added to the refernces.bib file in BibTex format.
or
Chapters marked with this emoji are not yet complete or have some issue that we know about. These chapters need to be fixed. If you like to help us fixing this section, please let us know. Use it in markdown with :o2: or if you like to use the image with .
REST 36:02
Example for a video with the  emoji. Use it in
markdown with [ REST 36:02](https://youtu.be/xjFuA6q5N_U)
Slides 10
Example for slides with the  emoji. These
slides may or may not include audio.
Slides 10
Slides without any audio. They may be faster to download. Use it in markdown with [ Slides 10](TBD).
A section is release when it is marked with this emoji in the syllabus. Use it in markdown with .
Indicates opportunities for contributions. Use it in markdown with ! [Question](images/question.png).
Indicates sections that are worked on by contributors. Use it in markdown with .
Sections marked by the contributor with this emoji 
when they are ready to be reviewed.
Sections that need modifications are indicated with this emoji ![Comment] (images/comment.png).
A warning that we need to look at in more detail 
Notes are indicated with a bulb 
Other emojis
Other emojis can be found at
iBooks and MS Edge
This is the list of emojis that canbe converted to PDF. So if you like a PDF, please limit your emojis to
:cloud: ☁ :o2: :relaxed: ☺ :sunny: ☀ :baseball: ⚾ :spades: ♠ :hearts: ♥ :clubs: ♣ :diamonds: ♦ :hotsprings:♨:warning: ⚠:parking: :a: :b: :recycle:♻:copyright: © :registered: ® :tm: ™ :bangbang: ‼ :interrobang: ⁉ :scissors: ✂:phone:☎
1.5.1 Figures
Figures have a caption and can be refereed to in the ePub simple with a number. We show such a reference pointer while referring to Figure 1.
Figure 1: Figure example
Figures must be written in the md as
Note that the text must be in one line and must not be broken up even if it is longer than 80 characters. You can refer to them with @fig:code-example. Please note in
order for numbering to work figure references must include the #fig: followed by
a unique identifier. Please note that identifiers must be really unique and that identifies such as #fig:cloud or similar simple identifiers are a poor choice and will
likely not work. To check, please list all lines with an identifier such as.
and see if your identifier is truly unique.
1.5.2 Hyperlinks in the document
To create hyperlinks in the document other than images, we need to use proper markdown syntax in the source. This is achieved with a refernce for example in {#fig:code-example width=1in}
sections headers. Let us discuss the refernce header for this section, e.g. Notation. We have augmented the section header as follows:
# Notation {#sec:notation}
Now we can use the refernce in the text as follows:
In @sec:notation we explain ...
It will be rendered as: In Section 1.5 we explain …
1.5.3 Equations
Equations can be written as
$$a^2+b^2=c^2$${#eq:pythagoras}
and used in text:
a2 +b2 = c2 (1)
It will render as: As we see in Equation 1.
The equation number is optional. Inline equations just use one dollar sign and do not need an equation number:
This is the Pythagoras theorem: $a^2+b^2=c^2$
Which renders as:
This is the Pythagoras theorem: a2 +b2 = c2.
1.5.4 Tables
Tables can be placed in text as follows:
As usual make sure the label is unique. When compiling it will result in an error if labels are not unique. Additionally there are several md table generators
: Sample Data Table {#tbl:sample-table}
available on the internet and make creating table more efficient.
1.6 UPDATES
☁
As all documents are managed in github, the list of updates is documented in the commit history at
https://github.com/cloudmesh-community/book/commits/master
In case you do a lecture withus we recommend that you download a new version oof the ePub every week. This way you are typically staying up to date. You can check the commit history and identify if the version of the ePub is older than the committed version, if so we recommend that you download a new version.
2 OVERVIEW
☁
Learning Objectives
Gain an overview what currently is in this book Review the high level goals
Be aware that this book is not complete and is worked on as we speak Be aware to check out the book on a weekly basis to stay up to date
Be aware that additional material is distributed in separate books such as Linux, Python, and Writing in Markdown.
Be aware that books you may purchase may already be outdated by the time you order them.
In this book we provide a number of chapters that will allow you to easily get knowledge in cloud computing on theoretical and practical levels.
Although the following was originally covered in this book, we decided to split out its contents as to make the core cloud engineering book smaller. In case you take one of our classes using the book, we expect that you pick up the material covered also by these additional books. Please be aware that some of the class material is based on Python and Linux. You will need no knowledge of them as you can pick it up while reading this book.
Cloud Computing
Linux for Cloud Computing Python for Cloud Computing Scientific Writing with Markdown
The book is organized as follows:
Definition of Cloud Computing
Databases. We present you with evidence that Clouds are absolutely relevant to todays technologies. We see furthermore a trend to utilize AI and ML services on in the cloud. Technologies such as virtual machine and containers and Function as a Service are essential to the repertoire of a modern Cloud or Data engineer. There is more than ML … ☺
Data Center
This chapter will explain you why we need cloud data centers, how a cloud data center look likes and which environmental impact such data centers have.
Architecture
This chapter will introduce you to the basic architectural features and designs of cloud computing. We will discuss architectures for IaaS, and contrast it to other architectures. We will discuss the NIST definition of the cloud and the Cloud Security Alliance Reference Architecture. We will discuss the multi-cloud architecture introduced by cloudmesh as well as the Big Data Reference Architecture.
REST
This chapter will introduce you to a way on how to define services in the cloud that you can easily access via language independent client APIs. It will introduce you to the fundamental concepts of REST. We will more importantly introduce you to OpenAPI that allows you to specify REST services via a specification document so you can create APIs and clients form the document automatically. We will showcase you how to do that with flask.
We will showcase you on a very popular service such as GitHub how to easily interface with REST services in Python.
GraphQL
formulated to download what is needed. Other features include a type system. Github has added in addition to its REST service also a GraphQL interface. You will have the opportunity to explore GraphQl while interfacing with GitHub.
Hypervisors
Virtualization is one of the important technologies that started the cloud revolution. It provides the basic underlying principles for the development and adoption of clouds. The concept, although old and already used in the early days of computing, has recently been exploited to lead to better utilization of servers as part of data centers, but also the local desktops.
In this chapter we introduce you to the basic concepts and distinguish the various forms of virtualization.
We list virtualization frameworks such as Libvirt, Qemu, KVM, Xen, and Hyper-V. Dependent on your hardware you will be encouraged to experiment with one or more of them.
IaaS
In the IaaS chapter we will be reviewing many of the services offered by providers usch as AWS, Azure, Google, and OpenStack that is used by some academic clouds such as chameleon cloud.
In addition we will introduce you to elementary command line tools and programs to access this infrastructure.
In this section we will also provide you with information about multicloud management with cloudmesh which makes it extremly easy to switch between and use services from multiple cloud.s
Important to note is that the appendix contains very useful information that augments this section. This includes a more detailed list of services for some IaaS providers as well as information on how to use chameleon cloud which has been adapted by us for this chapter.
In this chapter we discuss about the background of Mapreduce along with Hadoop and it’s core components. We will also introduce Spark to you in this section to Spark. you in this section.
You will be presented on how you can use the systems on a single resource so you can explore them more easily, but we will also let you know how to install them on a cluster in principal.
We conclude this section with some important Map/Reduce frameworks used as part of the larger Map/Reduce ecosystem such as AWS Elastic Map/Reduce (AWS EMR). This also includes a discussion about Twister2 which is a version of Map/Reduce that could perform even faster then Spark.
In fact we have here two sections that need to be delineated a bit better which we hope we can do with your help.
Container
In the container chapter we will introduce you to the basic concepts of a container and delineate it from virtual machines as we have introduced you earlier. We will start the chapter with an introduction to Docker and than introduce you how to manage clusters capable of running many containers with the help of docker swarm and kubernetes. To showcase you its use on other PaaS and applications we even show you how to run Hadoop with docker as well as how to conduct a pagerank analysis. Kubernetes will be discussed in its own section.
As many academic datacenters do run queuing system, we will also showcase Singularity allowing you to use containers within a batch queuing system.
you will help us improving this section if you elect to conduct a project on comet.
We conclude the section with letting you know how to run Tensorflow via singularity,
Recently a new paradigm in cloud computing has been introduced. Instead of using virtual machines or containers functions with limited resource requirements are specified that can than be executed on function capable execution services hosted by cloud providers.
We will introduce you to this concept and showcase you some examples of FaaS services and frameworks.
Messaging Services
Many devices in the cloud need to communicate with each other. In this chapter we look into how we can provide alternatives to REST services that provide messaging capabilities. We will focus on MQTT which is often used to connect cloud edge devices between each other and the cloud.
GO
Go is a programming language used by Google and has been most famously used to implement Kubernetes. In this chapter we introduce you to the elementary features of Go and also take a closer look on how we can define REST services, use OpenAPI, and interface with clouds.
Cloud AI Services
3 DEFINITION OF CLOUD COMPUTING
☁
Learning Objectives
Compare different definitions of cloud computing. Review the History of cloud computing.
Identify trends.
The current hot job is data engineer which is sought after more than data scientists (a new trend). You have chosen the right course ☺
Be TALLL to be successful in cloud computing.
Videos:
Definition of Cloud Computing 2019
3.1 D
EFINING THE TERMC
LOUDC
OMPUTINGIn this presentation we review three definitions of cloud computing. This includes the definitions by
NIST Wikipedia Gartner
3.2 HISTORY AND TRENDS
3.3 J
OB AS AC
LOUD/D
ATAE
NGINEERWe look at some job related trends that especially focus on the newest hot job description called Data Engineer. It is motivated that current job offerings as data engineer is 13% versus 1% for data scientists. As this class is targeted towards bringing the engineering component towards the data scientists, computer scientists, and application developer, This class is ideally suited for increasing your marketability.
3.4 Y
OU MUST BE THATTALLL
We close this class with Gregor’s TALLL principle to succeed in Cloud Computing:
You must be that TALLL to survive in Cloud Computing and Big Data
This principle includes the following characteristics
Trend Awareness (TA)
We need to be aware not only what is currently a trend, but what will be future trends
Longevity Planning (L)
We need to be able to reproduce our services and results (e.g. can we reproduce them still in six month).
Leap Detection (L)
We need to be able to deal with technology Leaps
Learning Willingness (L)
We need to constantly learn to keep up as technology changes every 6 month
4 DATACENTER
4.1 D
ATAC
ENTER☁
Learning Objectives
What is a data center. What are import metrics.
What is the difference between a Cloud data center and a traditional datacenter.
What are examples of Cloud data centers.
4.1.1 Motivation: Data
Before we go into more details of a data center we like to motivate why we need them. Here we start with looking at the amount of data that recently got created and provide one of many motivational aspects. Not all data will or should be stored in data centers. However a significant amount of data will be in such centers.
4.1.1.1 How much data?
One of the issues we have is to comprehend how much data is created. It’s hard to imagine and put into a perspective how much total data is created over a year, a month, a week, a day or even just an hour. Instead to easily visualize the amount of data produced we often find graphics easier to comprehend that shows how much data was generated in a minute. Such depictions usually include examples of data generated as a part of popular cloud services or the internet in general.
Figure 2: Data Never Sleeps [2]
Figure 3: Data Never Sleeps [3]
Figure 4: Internet Minute 2018 [4]
Figure 5: Internet Minute 2017-2018 [4]
It is also interesting to compare such trends over a longer period of time (see
Figure 6, Figure 7). An example is provided by looking at Google searches
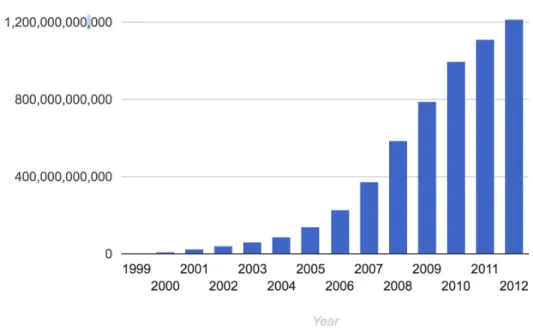
Figure 7: Big data trend. 2012 [5]
When looking at the trends, many predict an exponential growth in data. This trend is continuing.
4.1.2 Cloud Data Centers
supercomputers, but also Web server infrastructure and these days even private clouds that support the organizational users. In case of the latter we speak about supporting the long tail about science.
The latter is driven by the 80%-20% rule. E.g. 20% of the users use 80% of the compute power. This means that the top 20% of scientists are served by the leadership class super computers in the nation, while the rest are either served by other servers, cloud offerings through research and public clouds.
4.1.3 Data Center Infrastructure
Due to the data and the server needs in the cloud and in research such data centers may look very different. Some focus on large scale computational resources, some on commodity hardware offered to the community. The size of them is also very different. While a supercomputing center as part of a university was one of the largest such data centers two decades ago, they dwarf the centers now deployed by industry to serve the long tail of customers.
In general a data center will have the following components:
Facility: the entire data center will be hosted in a building. The building may have specific requirements related to security, environmental concerns, or even the integration into the local community with for example providing heat to surrounding residences.
Support infrastructure: This building will include a significant number of support infrastructure that addresses for example continuous power supply, air conditioning, and security For this reason you find in such centers
Uninterruptible Power Sources (UPS) Environmental Control Units
Physical Security Systems
Information Technology Equipment: Naturally the facility will host the IT equipment including the following:
Servers
Disks
Data Backup Services
Operations staff: The facility will need to be staffed with the various groups that support such data centers. It includes
IT Staff
Security and Facility Staff Support Infrastructure Staff
With regards to the number of people serving such a facility it is obvious that through automation is quite low. According to [6] proper data center staffing is a key to a reliable operation (see Figure 8).
Figure 8: Datacenter Staff Impact [6]
Another interesting observation is the root cause of incidents in a data center. Everyone has probably experienced some outage, so it is important to identify where they come from in order to prevent them. As we see in Figure 9 not every error is caused by an operational issue. External, installation, design, and manufacturer issues are together the largest issue for datacenter incidents (see
Figure 9: Datacenter outage [6]
4.1.4 Data Center Characteristics
Next we identify a number of characteristics when looking at different data centers.
Variation in Size: Data centers range in size from small edge facilities to megascale or hyperscale filling large ware houses.
Variation in cost per server: Although many data centers standardize their components, specialized services may be offered not on a 1K server, but on a 50K server.
Variation in Infrastructure: Servers in centers serve a variation of needs and motivate different infrastructure: Use cases, Web Server, E-mail, Machine Learning, Pleasantly Parallel problem, traditional super computing jobs.
Reliability: Although through operational efforts the data center can be made more reliable, failure still can happen. Examples are
https://www.zdnet.com/article/microsoft-south-central-u-s-datacenter-outage-takes-down-a-number-of-cloud-services/
https://www.datacenterknowledge.com/archives/2011/08/07/lightning-in-dublin-knocks-amazon-microsoft-data-centers-offline
https://techcrunch.com/2012/10/29/hurricane-sandy-attacks-the-web-gawker-buzzfeed-and-huffington-post-are-down/
Hence Data Center IaaS advantages include
Reduced operational cost Increased reliability Increased scalability Increased flexibility Increased support Rapid deployment
Decrease management: Outsourcing expertise that is not related to core business
Datacenter disadvantages include
Loss of control of the HW Loss of control of the data Model is preferring many users
Software to control infrastructure is not accessible Variations in performance due to sharing
Integration requires effort beyond login Failures can have a humongous impact
4.1.5 Data Center Metrics
4.1.5.1 Data Center Energy Costs
One of the easiest to monitor metrics for a datacenter is the cost of energy used to operate all of the equipment. Energy is one of the largest costs a datacenter incurs during its operation as all of the servers, networking, and cooling equipment require power 24/7. For electricity, billing is usually measured in terms of kilowatt hours (kWh) and kilowatts (kW). Depending on circumstances, there may also be costs for public purpose programs, cost recovery, and stranded costs, but they are beyond the scope of this book.
To provide a quick understanding, it is best to understand the relation between kilowatt hours and kilowatts. kWh is typically referred to as consumption while kW is referred to as demand and it’s important to understand how these two concepts relate to each other. The easiest analogy to describe the relationship is to think of kilowatts (demand) as the size of a water pipe while kilowatt-hours (consumption) is how much water has passed through the pipe. If a server requires 1.2 kW to operate then, after an hour has passed, it will have consumed 1.2 kWh. However, if the server operates at 1.2 kW for 30 minutes and then goes idle and drops to 0.3 kW for another 30 minutes, then total power consumed will be:
kW h = 0.3 * 30/60 + 1.2 * 30/60 = 0.75 (2)
Energy costs for a datacenter, then, are composed of two things: charges for energy and charges for demand. Energy is the amount of total energy consumed by the datacenter and will be the total kWh multiplied by the cost per kWh. Demand is somewhat more complicated: it is the highest total consumption measured in a 15 minute period. Taking the previous example, if a datacenter has 1,000 servers, the total energy consumption would be 750 kWh in the hour, but the demand charge would be based off of 1,200 kW (or 1.2 MW).
kW h = 0.75 * 24 * 30 * 0.12 * 1000 = 64, 800 (3)
kW = 1.2 * 8 * 1000 = 9, 600 (4)
This would total to $74,400. It’s important to note that fixing demand charges can have a tremendous payback: had the servers simply consumed 750 kW over the course of the hour, then our demand charges would’ve been halved to $4,800 while the energy costs remained the same. This is also why server virtualization can have a positive impact on energy costs: by having fewer servers running at a higher utilization, the demand charge will tend to level itself out as, on average, each server will be more fully utilized. For example, it’s better to pay for 500 servers at 100% utilization than 1000 servers at 50% utilization even though the amount of work done is the same since, if the 1,000 servers momentarily all operate at 100% utilization for even a brief amount of time in a month, the demand charge for the datacenter will be much higher.
4.1.5.2 Data Center Carbon Footprint
Scientists world wide have identified a link between carbon emission and global warming. As the energy consumption of a data center is substantial, it is prudent to estimate the overall carbon emission. Schneider Electric (formerly APC) has provided a report on how to estimate the Carbon footprint of a data center [7]. Although this report is already a bit older, it provides still valuable information. It defines key terms such as
Carbon dioxide emissions coefficient (carbon footprint):
With the increasing demand of data, bandwidth and high performance systems, there is substantial amount of power consumption. This leads to high amount of greenhouses gases emission into the atmosphere, released due to any kind of basic activities like driving a vehicle or running a power plant.
“The measurement includes power generation plus transmission and distribution losses incurred during delivery of the electricity to its point of use.”
energy in 2013, and they will use 139 billion kWh by
2020. Currently, data centers consume up to 3 percent of all global electricity production while producing 200 million metric tons of carbon dioxide. Since world is moving towards cloud, causing more and more data center capacity leading more to power consumption.
Peaker plant:
Peaking power plants, also known as peaker plants, and occasionally just peakers, are power plants that generally run only when there is a high demand, known as peak demand, for electricity. Because they supply power only occasionally, the power supplied commands a much higher price per kilowatt hour than base load power. Peak load power plants are dispatched in combination with base load power plants, which supply a dependable and consistent amount of electricity, to meet the minimum demand. These plants are generally coal-fired which causes a huge amount of CO2 emissions. A peaker plant may operate many hours a day, or it may operate only a few hours per year, depending on the condition of the region’s electrical grid. Because of the cost of building an efficient power plant, if a peaker plant is only going to be run for a short or highly variable time, it does not make economic sense to make it as efficient as a base load power plant. In addition, the equipment and fuels used in base load plants are often unsuitable for use in peaker plants because the fluctuating conditions would severely strain the equipment. For these reasons, nuclear, geothermal, waste-to-energy, coal and biomass are rarely, if ever, operated as peaker plants.
Avoided emissions:
Emissions avoidance is the most effective carbon management strategy over a multi-decadal timescale to achieve atmospheric CO2 stabilization and a subsequent decline. This prevents, in the first place, stable underground carbon deposits from entering either the atmosphere or less stable carbon pools on land and in the oceans.
lightening, cooking, heating and cooling systems. These are real emission reduction strategies and have created valid offset projects.
This type of carbon offset provides perhaps the simplest options that will ease the adoption of low carbon practice. When these practices become generally accepted (or compulsory), they will no longer qualify as offsets and further efficiencies will need to be promoted.
CO2 (carbon dioxide, or carbon):
Carbon dioxide is the main cause of the greenhouse effect, it is emitted in huge amount into our atmosphere with a life cycle of almost 100 years. Data centers emit during the manufacturing process of all the components that populate a data center (servers, UPS, building shell, cooling, etc.) and during operation of data centers (in terms of electricity consumed), the maintenance of the data centers (i.e. replacement of consumables like batteries, capacitors, etc.), and the disposal of the components of the data centers at the end of the lifecycle. Until now, power plants have been allowed to dump unlimited amounts of carbon pollution into the atmosphere - no rules were in effect that limited their emissions of carbon dioxide, the primary driver of global warming. Now, for the first time, the EPA has finalized new rules, or standards, that will reduce carbon emissions from power plants. Known as the Clean Power Plan, these historic standards represent the most significant opportunity in years to help curb the growing consequences of climate change.
The data center will have a total carbon profile, that includes the many different aspects of a data center contributing to carbon emissions. This includes manufacturing, packaging, transportation, storage, operation of the data center, and decommissioning. Thus it is important to notice that we not only need to consider the operation but also the construction and decommission phases.
4.1.5.3 Data Center Operational Impact
carbon impact using electricity certainly depends on the type of powerplant that is used to provide it. These energy costs and distribution of where the energy comes from can often be looked up by geographical regions on the internet or form the local energy provider. Municipal government organizations may also have such information. Tools such as the Indiana State Profile and Energy Use
[8].
may provide valuable information to derive such estimates. Correlating a data center with cheap energy is a key factor. To estimate both costs in terms of price and carbon emission Schneider provides a convenient Carbon estimate calculator based on energy consumption.
https://www.schneider-electric.com/en/work/solutions/system/s1/data- center-and-network-systems/trade-off-tools/data-center-carbon-footprint-comparison-calculator/tool.html
http://it-resource.schneider-electric.com/digital-tools/calculator-data-center-carbon
If we calculate the total cost, we need naturally add all costs arising from build and teardown phase as well as operational upgrades.
4.1.5.4 Power Usage Effectiveness
One of the frequent measurements in data centers that is used is the Power usage effectiveness or PUE in short. It is a measurement to identify how much energy is ued for the computing equipment versus other energy costs such as air conditioning.
Formally we define it as
PUE is the ratio of total amount of energy used by a computer data center facility to the energy delivered to computing equipment.
PUE was published in 2016 as a global standard under ISO/IEC 30134-2:2016.
The inverse of PUE is the data center infrastructure efficiency (DCIE).
offices and other cost surely will arise when we look at the formula
PUE =
PUE = 1 +
According to the PUE calculator at
https://www.42u.com/measurement/pue-dcie.htm
The following ratings are given
PUE DCIS Level of Efficiency
3.0 33% Very Inefficient
2.5 40% Inefficient
2.0 50% Average
1.5 67% Efficient
1.2 83% Very Efficient
PUE is a very popular metric as it is relatively easy to calculate and provides a metric that can easily compare data centers between each other.
This metric comes also with some drawbacks:
It does not integrate for example climate based differences, such as that the energy use to cool a data center in colder climates is less than in warmer climates. However, this may actually be a good side-effect as this will likely result in less cooling needs sand therefor energy costs.
It also forces large data centers with many shared servers in contrast to small data centers where operational cost may become relevant.
It does not take in consideration recycled energy to for example heat other buildings outside of the data center.
Hence it is prudent not to just look at the PUE but also at other metrics that lead to the overall cost and energy usage of the total ecosystem the data center is located in.
Total Facility Energy IT Equipment Energy
Already in 2006, Google reported its six data centers efficiency as 1.21 and Microsoft as 1.22 which at that time were considered very efficient. However over time these target has shifted and today’s data centers achieve much lower values. The Green IT Cube in Darmstadt, Germany even reported 1.082. According to Wikipedia an unnamed Fortune 500 company achieved with 30000 SuperMicro blades a PUE of 1.06 in 2017.
Exercises
E.PUE.1: Lowest PUE you can find
What is the lowest PUE you can find. Provide details about the system as well as the date when the PUE was reported.
4.1.5.5 Hot-Cold Aisle
To understand hot-cold aisles, one must take a brief foray into the realm of physics and energy. Specifically, understanding how a temperature gradient tries to equalize. The most important formula to know is the heat transfer Equation 5.
q =hcA(ta −ts) (5)
Here, q is the amount of heat transferred for a given amount of time. For this example, we will calculate it as W/hour as that is, conveniently, how energy is billed. Air moving at a moderate speed will transfer approximately 8.47 Watts per Square Foot per Hour. A 1U server is 19 inches wide and about 34 inches deep. Multiplying the two values gives us a cross section of 646 square inches, or 4.48 square feet. Plugging these values into our Equation 5 us:
q = 8.47 * 4.48 *(ta −ts)) (6)
1, 328.2 = 8.47 * 4.48 *(100 − 65)
664.0 = 8.47 * 4.48 *(100 − 82.5))
From the previous listing, we can see that a 35 degree delta allows the center to dissipate 1,300 Watts of waste heat from a 1U server while a 17.5 degree delta allows us to only dissipate 664 Watts of energy. If a server is consuming more than 664 Watts, it’ll continue to get warmer and warmer until it eventually reaches a temperature differential high enough to create an equilibrium (or reaches a thermal throttle and begins to reduce performance).
To combat this, engineers developed the idea of designating alternating aisles as either hot or cold. All servers in a given aisle are then oriented such that the AC system provides cool air into the cold aisle where it is drawn in by the server which then exhausts it into the hot aisle where the ventilation system removes it from the room. This has the benefit of maximizing the temperature delta between the provided air and the server’s processor(s), reducing the amount of quantity of air that must be provided in order to cool the server and improving overall system efficiency.
See Figure 10 to understand how the hot-cold isle configuration is setup in a data center.
4.1.5.5.1 Containment
While modern data centers employ highly sophisticated mechanisms to be as energy efficient as possible. One such mechanism which can be seen as a improvement on top of the Hot-Cold isle arrange is to use either hot isle containment or cold isle containment. Using a containment system can remove the issue with free flowing air.
As the name somewhat implies in cold air containment, the data centers is designed so that only cold air goes into the cold isle, this makes sure that the system only draws in cold air for cooling purposes. Conversely in hot isle containment design, the hot isle is contained so that the hot air collected in the hot isle is drawn out by the cooling system and so that the cold air does not flow into the hot isles[10].
4.1.5.5.1.1 Water Cooled Doors
Figure 11: Active Rear Door link
4.1.5.6 Workload Monitoring
4.1.5.6.1 Workload of HPC in the Cloud
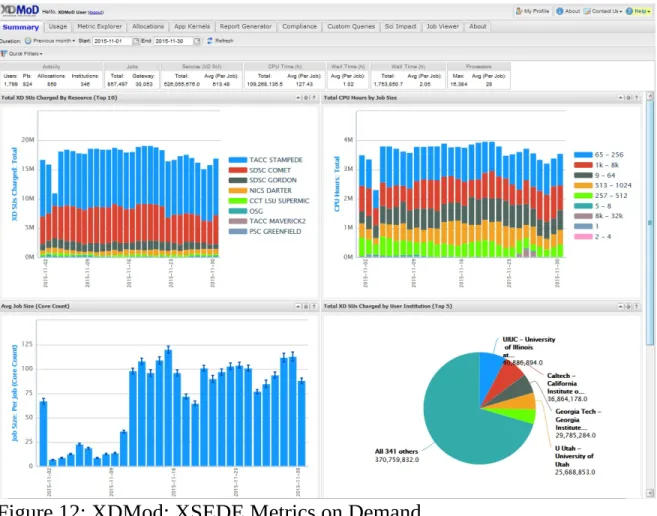
Clouds and especially university data centers do not just provide virtual machines but provide traditional super computer services. This includes the NSF sponsored XSEDE project. As part of this project the "XDMoD auditing tool provides, for the first time, a comprehensive tool to measure both utilization and performance of high-end cyberinfrastructure (CI), with initial focus on XSEDE. Several case studies have shown its utility for providing important metrics regarding resource utilization and performance of TeraGrid/XSEDE that can be used for detailed analysis and planning as well as improving operational efficiency and performance. Measuring the utilization of high-end cyberinfrastructure such as XSEDE helps provide a detailed understanding of how a given CI resource is being utilized and can lead to improved performance of the resource in terms of job throughput or any number of desired job characteristics.
Detailed historical analysis of XSEDE usage data using XDMoD clearly demonstrates the tremendous growth in the number of users, overall usage, and scale" [11].
Figure 12: XDMod: XSEDE Metrics on Demand
Additional information is available at
https://open.xdmod.org/7.5/index.html
4.1.5.6.2 Scientific Impact Metric
investment in terms of allocation by taking into account Field of Science or project based impact metrics. The findings from this analysis can be utilized by the XSEDE resource allocation committee to help assess and identify projects with higher scientific impact. Through the general applicability of the novel metrics we invented, it can also help provide metrics regarding the return on investment for XSEDE resources, or campus based HPC centers [12].
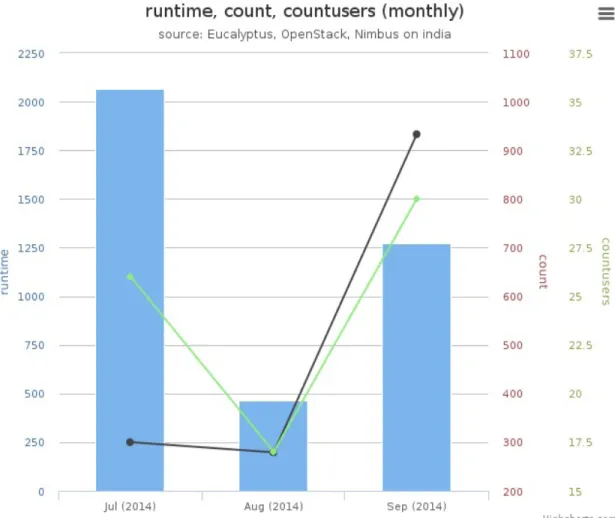
4.1.5.6.3 Clouds and Virtual Machine Monitoring
Although no longer in operation in its original form FutureGrid [13] has pioneered the extensive monitoring and publication of its virtual machine and project usage. We are not aware of a current system that provides this level of detail as sof yet. However, efforts as part of XSEDE within the XDMoD project are under way at this time but are not integrated.
![Figure 4: Internet Minute 2018 [ 4 ]](https://thumb-us.123doks.com/thumbv2/123dok_us/8126997.241224/47.918.209.766.104.764/figure-internet-minute.webp)
![Figure 5: Internet Minute 2017-2018 [ 4 ]](https://thumb-us.123doks.com/thumbv2/123dok_us/8126997.241224/48.918.172.805.107.471/figure-internet-minute.webp)
![Figure 7: Big data trend. 2012 [ 5 ]](https://thumb-us.123doks.com/thumbv2/123dok_us/8126997.241224/50.918.152.812.106.446/figure-big-data-trend.webp)
![Figure 8: Datacenter Staff Impact [ 6 ]](https://thumb-us.123doks.com/thumbv2/123dok_us/8126997.241224/53.918.153.809.104.495/figure-datacenter-staff-impact.webp)
![Figure 9: Datacenter outage [ 6 ]](https://thumb-us.123doks.com/thumbv2/123dok_us/8126997.241224/54.918.157.803.118.458/figure-datacenter-outage.webp)
![Figure 10: Hot Cold Isle [ 9 ]](https://thumb-us.123doks.com/thumbv2/123dok_us/8126997.241224/63.918.158.804.692.1036/figure-hot-cold-isle.webp)
![Figure 14: AWS regions [ 15 ]](https://thumb-us.123doks.com/thumbv2/123dok_us/8126997.241224/71.918.158.795.125.478/figure-aws-regions.webp)
