Abstract: The urban population of India has increased excessively during the past decades. This population increase is due to the migration of people from rural areas to cities. Utilization of land is determined to change according to the development of cities over the years. Urban sprawl leads to loss of agricultural lands, open spaces, and loss of surface water. Due to the rapid unplanned change in the environment, it is necessary to understand the changes in land use so as to identify the utilization of land for every city. With Geographic Information System (GIS), analysis of land use and land cover can be investigated. In this paper, efforts has been made to analyze the land utilization from 1999-2017 for a two decade period for the city of Lucknow. Urban sprawl has been quantified with landscape metrics using GIS. The analysis proved an increased dispersion of cities and conversion of vacant lands to developed lands with the growth of population. Therefore it is essential to understand the urban growth pattern for proper urban planning.
Index Terms: Urban sprawl, Remote sensing, Urbanization, Spatial metrics
I. INTRODUCTION
Cities are developed economically, socially and most importantly it is driven by population growth. In search of improved lifestyle and better job opportunities, there are high rates of rural-urban migration occurring in and around cities. With the development of cities, there is a need to quantify or measure the amount of growth taking place in these areas. The population of India has doubled during the last five decades, concurrently the urban population has increased by five times. Rapid urbanization has been taking place during the past thirty years in India[1]. Various researches were conducted in different manners to quantify urban sprawl. Over the years, remote sensing has played an important role in identifying land use and land cover changes. When population increases, population density per sq.km also increases, thereby more
amount of land that has been urbanized. Moreover, the social and economic conditions change with the increase in density of population[2]. The term sprawl is described as a low-density growth or an unplanned growth which spreads outside the urban development in the fringes and suburbs of the city. The basic idea of urban sprawl is the gradual development of a low-density area to a high-density area or a dispersed development over time undergoing alterations in the land consumptions in various manners. In some cases, the land becomes more compact, hence developed. Sometimes sprawl in small clusters or patches occurs outside the existing urban area which can be called as fragmentation. With the rapid growth of the cities, acquiring accurate data for the study of these sprawls becomes a substantial factor in order to clearly identify the changes occurring on the land. Traffic congestions, population growth, low price of lands, increased infrastructure, and reduction of environment quality are some of the consequences for sprawl[3]. Sprawl can be minimized by introducing various policies such as controlling travels, participation in providing infrastructures costs, creating urban boundaries, urban consolidation, controlling growth, protecting lands and considering the redevelopment of inner regions[3]Satellite images provide maps covering large geographical area giving accurate patterns of land use ranging from various time periods. Numerous studies have been done for various cities in India and other countries to measure the transformations taking place over time. [4]utilized Thematic Mapper(TM) images for three different decades to analyze the land use. The results showed an increased expansion of the city towards traffic infrastructure and industrial estates which also led to the loss of a huge amount of arable lands. [5]examined urban growth for 28 years and observed that agriculture land and vacant land has been converted to residential lands. While agriculture lands and vacant lands reduce it has also been proved that the existing built-up land has increased and rapid urbanization has developed in the fringes of the city[6]. [7]developed seven urban classes for the analysis of Kolkata urban agglomeration in which municipalities and the Kolkata Municipal Coperation located around the Hooghly River have evolved to fast urban growth, leading to 17% increase over ten year period. [8]attempts to find the change detection in Mansoura and Talkha cities of Egypt and the results showed that there has been a difference of more than 30% of urban land from 1985 to 2010 which subsequently decreased agricultural land by 33%. The rapid expansion of cities and sprawling of cities leads to loss of utility services, recreational services and these lands once converted cannot be recovered.
[9]explains 592 hectares of land being lost and unrecoverable with the
Spatio-Temporal Urban Sprawl Analysis And
Evaluation Using Gis For Lucknow City
M.B. Sridhar, R. Sathyanathan, Shalu Ann Shaji
Revised Manuscript Received on April 07, 2019.
Shalu Ann Shaji, Post Graduate Student, Department of Civil
Engineering, SRM Institute of Science and Technology, Kattankulathur, Chennai, India.
M.B. Sridhar, Assistant professor, Department of Civil
Engineering, SRM Institute of Science and Technology, Kattankulathur, Chennai,
R. Sathyanathan, Associate professor, Department of Civil
increasing demand for agricultural use. To quantify the land use and land dynamics, Delhi region was divided into 4 zones with 1 km incrementing buffer circles and the results showed more compact urban placements were in the center and the periphery and the buffer areas were more dispersed than the urban center[10]. Illegal urban settlements can be discovered through a multi-method process with human and remote sensing data and this method can be a better path for the assessment of illegal advancement[11]. Classifying of land use and land cover and while quantifying the land use, several names were given for the kind of sprawl taking place. Coalescence phase, diffusion phase, and marginal growth are several patterns of sprawl that have been identified for main cities, suburbs and cantonments[12]. There are several ways to measure sprawl and these are called spatial metrics. Quantitative metrics are used to compute the development patterns of a landscape [13]. There are different types of spatial metrics such as landscape metrics, patch density, shape metrics, clumpiness index, Shannon’s entropy, patch area distribution and many others[14]. Enumerating Shannon’s entropy adds to more specific details of sprawl such as region and rate of expansion and depicting probable sprawl regions[15]. Once the city has been classified and quantified urban sprawl can be defined in various dimensions such as continuity, clustered, centrality, nuclearity, proximity, concentrated sprawl, etc. Other indicators such as SCATTER (The Sprawling Cities And Transport: from Evaluation to Recommendations) and Cost of Sprawl: 2000 TRB (Transport Research Bureau, US) were also used to measure sprawl[16]. Seven spatial metrics were analyzed for 77 metropolitan cities and comparison was made between developed, developing and among world regions further cluster analysis was performed to classify each of the cities and finally it has been observed that urban concentrations are more compact than their counterparts in either Europe or North America[17]. [18]initiated the development of Land Use Geospatial Indices which included segregated land use, development planning consistency, urban density, strip and leapfrog development and the results stated that segregated land use and leapfrog development were salient indicators for strategic planning zone for alpha cities in Kuala Lumpur Metropolitan and these can be adopted for land use planning and strategic development. [19]states that urban sprawl is typically more of a planned sprawl where the urban development in the city of Shanghai has increased by 125% more than double the population, from 2000 to 2015 and proposing the use of Geo-detector, the analysis affirm that the detailed plan of the city has a pivotal role in the urban sprawl expansion. Indicators such as density and centrality (by using Moran’s I coefficient of developed land) reveal that there has been a decreased land consumption therefore increased urban sprawl. Besides, Moran’s coefficient showed that the urban lands intended to form clusters. A reversed U shape pattern was formed for both land consumption and Moran’s I coefficient[20]. Researches have been conducted on a global scale comparing cities from different geographical atmospheres having different economic situations. These cities were analyzed and categorized into high growth cities, low growth cities, expansive growth and frantic growth cities[21]. Cities tend to expand in an unpredictable manner
due to the rapid growth of population and therefore an unplanned increase in residential areas is more noticed than planned residential areas. This is due to the availability of barren land or unused agricultural land which paves the way to the increased outgrowth of cities[9]. Therefore it is important to have more of planned urbanization rather than encouraging the development of unplanned urbanization. Supervised classification is the most widely used method for extracting information from the raster for the analysis of land use and land cover. This research paper focuses on the study of the urban sprawl of Lucknow city from 1999- 2017 using the combined classification method. It also attempts to find out the proportion of area that has been dispersed for three years by considering Shannon’s entropy.
II. STUDYAREA
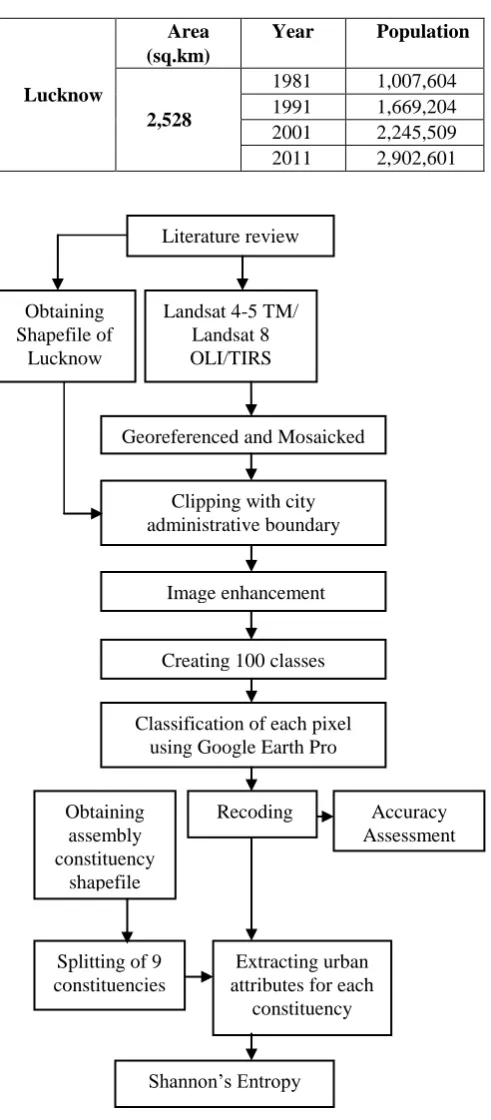
Being the largest city of Uttar Pradesh, Lucknow stands the eleventh most populous city and the twelfth most populous urban agglomeration of India. The district covers an area of 2,528 square kilometers and the population density was 690 persons per square kilometer. The city consists of six districts and the population is 2,902,601 according to 2011. The Gomati river flows through the city serving as a bed for the agriculture and divides the city into two regions namely Trans-Gomati and Cis-Gomati. Lucknow has a subtropical climate and in this research, the data’s of later summer from March to June is considered. The forest cover of Lucknow is 4.66 percent which is less than the state average of 7%. Table 1 below provides the population growth of Lucknow city from 1981- 2011.
III. DATAANDMETHODOLOGY The following data were used in this research:
1) Landsat 8 OLI/TIRS C1 Level -1 which has a resolution of 30 meters and consists of nine spectral bands
2) Landsat 4-5 Thematic Mapper C1 Level -1 which has a resolution of 30 meters and consists of six spectral bands. These data sets were used for the land cover and land use analysis. Landsat 8 was used for the 2007-2017 decade and Landsat 4-5 TM was used for 1999-2006 decade.
Table 1 Lucknow population count for 1981- 2011
Lucknow
Area (sq.km)
Year Population
2,528
[image:3.595.45.291.90.651.2]1981 1,007,604 1991 1,669,204 2001 2,245,509 2011 2,902,601
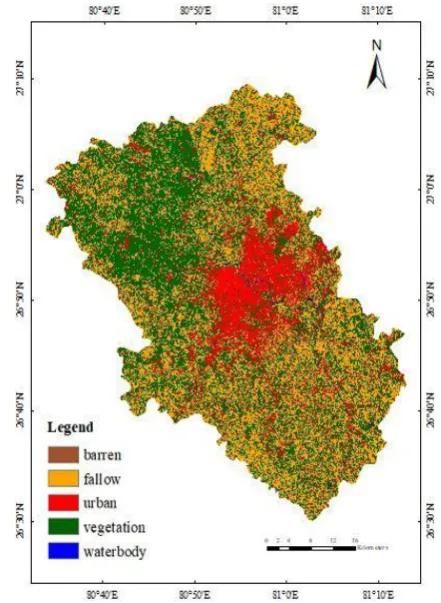
Fig. 2 Methodology for urban sprawl analysis Urban dynamics were analyzed using temporal remote sensing data for the period of 1999 – 2017. These satellite images were downloaded from the United States Geological Survey (USGS) public domain in GeoTIFF format which provides topographic and geographic maps of the required region. The methodology flowchart is presented in Fig 2. Satellite images of 1999 belonging to two different paths were projected to Universal Transverse Mercator having datum
WGS 1984 and subjected to coordinate system UTM Zone 44N. All the cloud-free satellite images were chosen around the same seasonal period of the year. These images are clipped in ArcGIS with the help of Lucknow’s shape file which consists of the administrative boundaries of the district. Fig 1 shows the shape file of Lucknow with the administrative boundary and assembly constituencies. In certain cases, the satellite image would not envelope the complete shape file of the city, in such cases, the images have to be mosaicked with the appropriate path and row to obtain the whole administrative area. This process has been carried out for the years 1999 and 2004 with the help of ArcGIS, whereas for the year 2015, the entire administrative area was covered in the imagery. Once the images are mosaicked, image enhancement methods were performed on the raster images and were then converted to thematic images to categorize the pixels. This generates clearer and precise pixels to perform an accurate analysis. Land use and land cover was performed to analyze the various land changes in the study area during the study period and was executed with ERDAS using the combined classification method. For Landsat 8 OLI/TIRS C1 Level-1, the bands 5(Near Infrared), 4(Red), 3(Green) were adopted and for Landsat 4-5 Thematic Mapper C1 Level -1, the bands 4(Near Infrared), 3(Red), 2(Green) were adopted. Combined classification method, being the most accurate method, uses the ISODATA algorithm to perform the classification. This algorithm adopts 100 arbitrary clusters of data in greyscale on the image by using the minimum spectral distance formula. The means of the clusters are shifted according to the number of iterations assigned for the analysis. Hence the clusters are shifted until the maximum number of iterations is reached. Each pixel was assigned by a color to the respective class by comparing with the land cover with Google Earth. With the help of these remote sensing band colors, various heterogeneous patches were located which assisted in identifying the various classes. The classes adopted were built-up area, waterbodies, fallow land, vegetation, and barren land. These training data were finalized with the recoding utility, in which all the equal classes are assigned to a single class. Accuracy assessment is test which randomizes equal number of points on the classified image in ERDAS to check the certainty of the results obtained and 84%, 93.3% and 90% accuracy were obtained with kappa coefficients as 0.8, 0.91 and 0.9 respectively. Finally using the urban count of the classified image, the proportion of built-up area was determined for calculating the extent of sprawl by Shannon’s Entropy using the formula
Hn = -⅀Pi loge (Pi)
Where Pi is the proportion of built-up land in the ith constituency and n represents the total number of constituencies.
The results of entropy values were obtained to know the rate of dispersion in the city over the years.
The proportion of built-up area for each assembly constituency of Lucknow is determined by using the formula
Where PBuiltup represents the proportion of built-up land for Literature review
Obtaining Shapefile of
Lucknow review
Landsat 4-5 TM/ Landsat 8 OLI/TIRS
Georeferenced and Mosaicked
Image enhancement Clipping with city administrative boundary
dary
Classification of each pixel using Google Earth Pro
Image enhancement
Georeferenced and Mosaicked Pro
Creating 100 classes
Recoding Obtaining
assembly constituency
shapefile
Shannon’s Entropy
Obtaining assembly constituency shapefile
Obtaining assembly constituency shapefile constituency shapefile annon’Georeferenced
and Mosaicked s Entropy
Extracting urban attributes for each
constituency Splitting of 9
constituencies
each constituency.
IV. RESULTSANDDISCUSSION
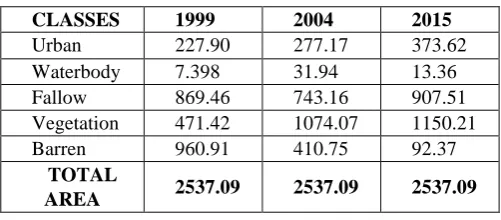
[image:4.595.70.279.273.796.2]Land use and Land cover: The total administrative area of Lucknow district is 2537.09 km2. Within the administrative boundary the land use has changed over the period of time. Contemplating on individual classes, the area has increased from 227.90 to 277.17 km2 in the year 1999 to 2004. In the year 2015, 3.8 % of increase in the built-up area is witnessed. Vacant lands is occupied as sprawl increases and this becomes a matter of concern for a sustainable environment[22]. From the classification, it is evident that barren land decreased from 960.91 km2 to 92.37 km2 over two decades. The results of classified images are shown in figures 3, 4 and 5. The areas of each class were taken for the years 1999, 2004 and 2015 and their percentages are represented in Table 2 and 3 respectively.
Fig.3 Combined classification for 1999
Fig.4 Combined classification for 2004
Lucknow has 9 assembly constituencies namely Bakshi Ka Talab, Lucknow Central, Lucknow Cantonment, Lucknow East, Lucknow North, Lucknow West, Malihabad, Mohanlalganj and Sarojini Nagar as shown in Fig 1. Each constituency has been considered as a separate spatial unit and the area of each constituency was found out from its respective shape file. By extracting the urban count of each spatial unit for the three years 1999, 2004 and 2015, the urban area was calculated with the pixel size which provided the built-up area for each constituency for all the years. The following formula was considered for the calculation of the proportion of built-up area and the results are given in Table 4.
[image:4.595.66.546.276.827.2]Where PBuiltup represents the proportion of built-up land for each constituency.
[image:4.595.318.539.309.611.2]Table 2 Areas of 5 classes in kms for 1999, 2004 and 2015
CLASSES 1999 2004 2015
Urban 227.90 277.17 373.62
Waterbody 7.398 31.94 13.36 Fallow 869.46 743.16 907.51 Vegetation 471.42 1074.07 1150.21 Barren 960.91 410.75 92.37
TOTAL
AREA 2537.09 2537.09 2537.09
Table 3 Areas of 5 classes in percentages for 1999, 2004 and 2015
CLASSES 1999 2004 2015
Urban 8.98 % 10.92 % 14.72 % Waterbody 0.29 % 1.25 % 0.52 % Fallow 34.26 % 29.29 % 35.76 % Vegetation 18.58 % 42.33 % 45.33 % Barren 37.87 % 16.18 % 3.64 %
TOTAL
AREA 2537.09 2537.09 2537.09
From Table 4, the proportion of built up area in terms of the total area of each constituency, has increased over the years. Mohanlalganj has experienced a small decrease of about 8% for 2004. From this analysis, it is observed that, throughout the years, as the population increases, there is an increase in the usage of land and decrease in the barren lands.
[image:5.595.41.294.262.368.2]Shannon’s entropy: The rate of dispersion of a spatial concern can be calculated using Shannon’s Entropy method and for each zone or ward, the rate of urban concentration can be found out[23].
Table 4 Proportion of built up areas for Lucknow Assembly Constituencies
Assembly
constituencies 1999 2004 2015
Bakshi Ka
Talab 0.0638 0.0854 0.1345
Lucknow
Cantonment 0.2891 0.2889 0.6254 Lucknow
Central 0.4531 0.5041 0.7455 Lucknow East 0.2954 0.4814 0.6754 Malihabad 0.0524 0.0649 0.8178 Mohanlalganj 0.0836 0.0804 0.0884 Lucknow
North 0.2265 0.4004 0.5599
Sarojini Nagar 0.0841 0.1051 0.1459 Lucknow
West 0.2109 0.3305 0.4677
Computation of Shannon’s Entropy is as follows:
Hn = -⅀ Pi loge (Pi)
Where Pi is the proportion of built-up land in the ith constituency and n represents the total number of constituencies.
In this analysis, for measuring the extent of sprawl, Shannon’s entropy was determined for the 9 constituencies of Lucknow city by calculating the proportion of the built-up area of each constituency with the total built-up area of all the 9 constituencies. Shannon’s entropy values range from 0 to log n, where n represents the total number of constituencies. The values closer to 0 indicate that there is less sprawl and land use is considered to be more accumulated in the central business district. The values closer to log n is considered to be more of a disseminated development. The following Table 5 shows the entropy values for the years 1999, 2004 and 2015.
Table 5 Shannon’s Entropy for 1999, 2004 and 2015 Entropy
value
1999 2004 2015 log n =
0.954 0.8692 0.8979 0.9116
In this analysis the sprawl rate was computed for the constituencies and the results indicated that sparse development has occurred in 2015 compared to 1999. The values obtained were 0.8692 in 1999 and 0.9116 in 2015 which indicates that the values are closer to log n, i.e., 0.954, which shows high degree of dispersion in the region.
V. CONCLUSION
This research has demonstrated that remote sensing has a major role to measure the urban sprawl which helps in urban planning. With the knowledge of geographic information system, utilization of land can be properly observed and monitored. The land use land cover was determined for two decades from 1999-2017 and the rate of sprawl was measured. The built up area tends to increase with the increase in population. Vacant lands have been converted with the development of cities. Entropy values proved high scale dispersion for the region. The reasons of sprawl maybe due to over populated areas which leads to high traffic congestion, high industrialization, economic growth of the city, living and property costs. Urban sprawl also has an impact on the natural resources. Sprawls lead to less availability of amenities and utilities outside the city area thus improper enforcement of land use may lead to high sprawls. Therefore it is important for urban planners to understand the growth pattern of the sprawl and have an effective utilization of resources and allocation of infrastructure.
REFERENCES
1. R. B. Bhagat and S. Mohanty, “Emerging pattern of urbanization and the contribution of migration in urban growth in India,” no. April 2013, pp. 37–41, 2009.
2. P. Knox, “Urbanization,” International Encyclopedia of Human Geography. pp. 112–118, 2009.
3. S. Habibi and N. Asadi, “Causes, results and methods of controlling urban sprawl,” Procedia Engineering, no. 21, pp. 133–141, 2011. 4. H. Xu, X. Wang, and G. Xiao, “A
remote sensing and GIS
[image:5.595.54.284.547.760.2]Fuqing city, Fujian Province, China,” Land degradation and development, vol. 11, pp. 301–314, 2000.
5. W. Bengal, R. Shaw, and A. Das, “Identifying peri-urban growth in small and medium towns using GIS and remote sensing technique : A case study of English Bazar Urban Agglomeration, West Bengal, India,”
The Egyptian Journal of Remote Sensing and Space Sciences, pp. 1–14, 2017.
6. S. F. Atiqur Rahman, Shiv Prashad Aggarwal, Maik Netzband, “Monitoring Urban Sprawl Using Remote Sensing and GIS Techniques of a Fast Growing Urban Centre, India,” Applied Earth Observations and Remote Sensing, vol. 4, no. 1, pp. 56–64, 2011.
7. M. Sahana, H. Hong, and H. Sajjad, “Science of the Total Environment Analyzing urban spatial patterns and trend of urban growth using urban sprawl matrix : A study on Kolkata urban agglomeration , India,”
Science of the Total Environment, vol. 628–629, pp. 1557–1566, 2018. 8. I. Rizk and M. Rashed, “Monitoring urban growth and land use change detection with GIS and remote sensing techniques in Daqahlia governorate Egypt,” International Journal of Sustainable Built Environment, vol. 4, no. 1, pp. 117–124, 2015.
9. S. Fazal, “Urban expansion and loss of agricultural land – a GIS based study of Saharanpur City, India,” Environment and Urbanization, vol. 12, 2000.
10. T. V Ramachandra, A. H. Bharath, and M. V Sowmyashree, “Monitoring urbanization and its implications in a mega city from space : Spatiotemporal patterns and its indicators,” Journal of Environmental Management, pp. 1–15, 2014.
11. J. Miguel, R. Lopez, K. Heider, J. Scheffran, and L. Alvarez-palacios, “Frontiers of urbanization : Identifying and explaining urbanization hot spots in the south of Mexico City using human and remote sensing,”
Applied Geography, vol. 79, pp. 1–10, 2017.
12. L. N. Kantakumar, S. Kumar, and K. Schneider, “Spatiotemporal urban expansion in Pune metropolis , India using remote sensing,” Habitat International, vol. 51, pp. 11–22, 2015.
13. R. V. O. Neill et al., “Indices of landscape pattern,” Landscape Ecology, vol. 1, no. 3, pp. 153–162, 1988.
14. B. Bhatta, S. Saraswati, and D. Bandyopadhyay, “Urban sprawl measurement from remote sensing data,” Applied Geography, vol. 30, no. 4, pp. 731–740, 2010.
15. H. S. Sudhira, “Urban Growth Analysis Using Spatial and Temporal Data,” Journel of the Indian Society of Remote Sensing, vol. 31, no. 4, 2003.
16. Z. A. Nengroo, M. S. Bhat, and N. A. Kuchay, “Measuring urban sprawl of Srinagar city , Jammu and Kashmir , India,” Journal of Urban Management, no. August, 2017.
17. J. Huang, X. X. Lu, and J. M. Sellers, “A global comparative analysis of urban form : Applying spatial metrics and remote sensing,” Landscape and Urban Planning, vol. 82, pp. 184–197, 2007.
18. N. Mohd, N. Aulia, M. Hashim, and A. Abdullah, “Developing land use geospatial indices ( LUGI ) for sprawl measurement in alpha cities : Case study of Kuala Lumpur , Malaysia,” Cities, no. November 2017, pp. 0–1, 2018.
19. L. Tian, Y. Li, Y. Yan, and B. Wang, “Land Use Policy Measuring urban sprawl and exploring the role planning plays : A shanghai case study,”
Land use policy, vol. 67, no. May, pp. 426–435, 2017.
20. W. Zhou, M. Jiao, W. Yu, and J. Wang, “Urban sprawl in a megaregion : A multiple spatial and temporal perspective,” Ecological Indicators, no. 18, pp. 0–1, 2017.
21. A. Schneider and C. E. Woodcock, “Compact , Dispersed , Fragmented , Extensive ? A Comparison of Urban Growth in Twenty-five Global Cities using Remotely Sensed Data , Pattern Metrics and Census Information,” Urban studies, vol. 45, no. March, pp. 659–692, 2008. 22. B. Athanasios Alexandru Gavrilidis, Mihai Răzvan Niță and I. I. N. ,
Diana Andreea Onose, Denisa Lavinia Badiu, “Methodological framework for urban sprawl control through sustainable planning of urban green infrastructure,” Ecological Indicators, pp. 2–12, 2017.
AUTHORSPROFILE
M.B. Sridhar Assistant professor,
Department of Civil Engineering, SRM Institute of Science and Technology, Kattankulathur, Chennai, India. Completed
M. Tech in Construction Engineering and Management from SRM Institute of Science and Technology and B.E from Kumaraguru College of Technology, Anna University.
R. Sathyanathan Associate professor,
Department of Civil Engineering, SRM Institute of Science and Technology, Kattankulathur, Chennai. Completed M.E in Irrigation Water Management from Anna University, Guindy, Chennai. Completed Ph.D from SRM Institute of Science and Technology, Chennai.
Shalu Ann Shaji completed her B. Tech from Bharath Institute of