Abstract: — Smart Meter data is trending at present. The Smart Meter data means data generated for every second. This kind of data is produced by smart meters so we are working on smart meter data for analysis. Smart meters have smooth way to use electricity effectively to compare with the digital meters in nature. These types of meters have been arranged across few nations since from 2ks. The universal organizations would utilizing these meters on provide exact electric Vitality utilization information with their clients. Those enormous sum from claiming information created Eventually Tom's perusing keen meters each particular interim could be utilized to information analytics Furthermore furnish Different insights that camwood be determined for example, such that determining the electric demand, actualizing ToU Also duty costs and so on. Which will help both existing organizations What's more clients. In this article we are analyzing data using 3 methods. Namely ARIMA, NAVIE & HOLT WINTER. We compare these methods by AIC measurements of their MAPE values.
Index Terms: IOT, NAVIE, Smart Meters, ARIMA.
I. INTRODUCTION
While access the smart meter data for analysis because smart meter is used not only used for accurate data. Enormous volumes from claiming genuine information created by keen meters [4] could make mined Eventually Tom's perusing vitality. Accepted organizations Furthermore new insights therefore processed could a chance to be drive business welfares. A number of the reasons for analysis are: to make efficient power buying selections based totally at the usage patterns, launching power performance[7], power fraud detection, evaluating and correcting metering service company performance, and detecting and decreasing unbilled power. As said SM data are time series [9] data that are series of capacities of the same variable gathered over time at ordinary intervals. SM data can be accessed for working out forecasting primarily based on the historic records. We enforce on few forecasting techniques, ARIMA [5] and Exponential Smoothing. Same time utilizing these models on perform time arrangement dissection and determining from claiming keen meter information Also with decide the a standout amongst the best model for foreseeing daily, weekly, month to month What's more quarterly aggravator information and additionally for picking suitableness time
Revised Manuscript Received on May 28, 2019.
Dr. P. Vidya Sagar, Dept of IT, V R Siddhartha Engineering College, Vijayawada, India.
Dr M. Nageswara Rao, Dept of CSE, V R Siddhartha Engineering College, Vijayawada, India.
Mr Mukesh Chinta, Dept of CSE, V R Siddhartha Engineering College, Vijayawada, India.
from claiming determining [1].
We integrate Apache Hadoop with statistic computing tool like R to solve the above mention forecasting. This integration can be done via hive. We utilized apache Hadoop, which is coordinated to RStudio [9] on perform time arrangement dissection What's more determining about time arrangement information transformed toward advanced mobile meter information. For comparison of two forecasting techniques we used the calculated MAPE values [11]..
II. LITERATURE REVIEW
In [8] Sentimental in Chandra Bhushan, V. V. Hara Gopal, and A. Vinay Babu investigates software of exponential smoothing and garch modelling techniques to match the historic statistics consisting day by day load of state AP in India, and estimation of coefficients for counting the earlier day power request. For this type of models R-Programming fits well[13]. By writing the code in R, the order of Exponential Smoothing model which is better for the data set can be raised out adopting the lower value of AIC .GARCH, which is a non-aligned model treats hetero elasticity in the form of variance which is to be modelled, for every inaccuracy phrase a prevision is anticipated to the variance other than modifying the insufficiencies of least squares.
Clinched alongside [10] Balaji k. Bodkhe and Dr. Sanjay P. Sood functioned by gaining entrance to advanced mobile meter information settling on utilization of An business discernment action apparatus with apache Hadoop. The technique included an orderly procedure custom-made on Indian states which At went with will bring about a totally compelling Furthermore appropriately figured out how advanced mobile power grid to 2024. Different functionalities are given for clients and also investigator clinched alongside GUI with visualize power utilization information Furthermore load profile dependent upon different parameters such as weekly, monthly[7] and so on.
To [6] Junwei Miaostudied the issue about power utilization china as a impact from claiming expanded population, and hence utilized ARIMA model to determining power interest from claiming china for the accompanying couple of a considerable length of time for making vitality What's more budgetary arrangements. The model indicated low lapse rate done prediction What's more will be more exact sufficient should conjecture power interest from 2013 to 2000.
Smart Meter Analytics for Optimizing the
Utilization of Electricity using Arima, Navie &
Holt Winter
III. ARCHITECTURE DIAGRAM
Fig.1 Architecture Diagram
IV. IMPLEMENTATION
[image:2.595.57.291.55.212.2]The dataset contains time series of 100 consumers and theirs corresponding meta data. This enormous information comprise of the date Furthermore occasion when alongside the control used. Those colossal dataset will make stacking under HDFS starting with the typical neighborhood record framework. We utilize HDFS as the database with store the significant measure about information which must a chance to be exported under Rsystem for load profile examination and in addition those determining. Those tremendous information will make stacking under An hive information table alongside those timestamp provided for in the information. The HDFS could be accessed from those RStudio Eventually Tom's perusing interfacing those hive for Rsystem. R studio and Hadoop camwood a chance to be associated utilizing 3 bundles for example, Java, RJDBC, DBI to r. Those HDFS will a chance to be accessed from r framework support. Those sm electric utilization information will be Notwithstanding foreign starting with hive information table should Rstudio[9]. Those streaming information will make stacking under HDFS done An hive table, which may be further exported under r in place on perform predictive examination Furthermore load profile examination.
Fig.2 Dataset
A. Integrating R and Hadoop via Hive
a) Create a Hive table over raw HDFS text data in a directory to make the HDFS data accessible from Hive. Load the dataset into hive table. Verify that the Hive table can be queried locally on the Hadoop [10] cluster before moving on to getting remote connectivity via R working. As we have
created only for sample data now we to create for main variable which we have to be get accessed.
b) Check if the hive service is running, if not restart it in terminal. RStudio [9] can be accessed in centos 6.7 from the browser by typing localhost:8787.
B. Integrating R and Hadoop via Hive
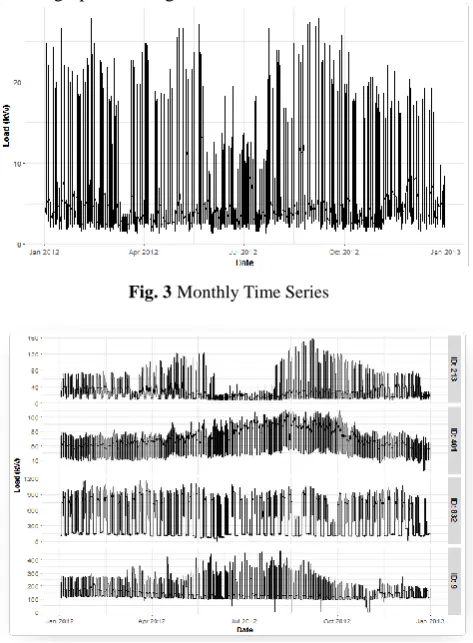
Ploting graphs on monthly time seriesT What's more, the lion's share of Corps parts don't stay in their starting work areas once their comm information speaks to those qualities from claiming accurate variable gathered again a period period. Information of TS would mossycup oak suitableness will do determining. We utilize A percentage bundles over r in information. Table, ggplot, for determining monthly, weekly, What's more Every day. Those load profile chart indicates the load of power utilized again. An specific time of time for graphical design.
Fig. 3 Monthly Time Series
Fig. 4 Graph of a Particular Day in Monthly Time Series
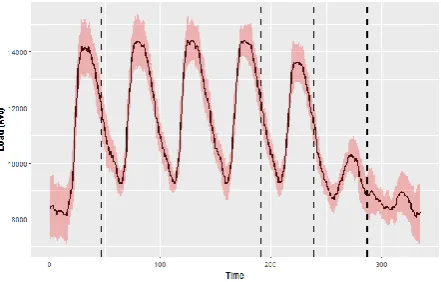
C. Plotting graph on weekly time series
[image:2.595.312.549.258.580.2] [image:2.595.55.289.544.697.2]Fig. 5 Graph Load Vs Time Graph in Weekly Profile
On Comparison with the models Navie and Holt-winter forecasting the statistics that we got were
Fig 6. Comparison on Aggregated Load
Fig 7 Comparison on Disaggregated Load
MAPE values for Aggregated Data:
SNO Model Values
1 Navie 4.3674
[image:3.595.59.280.51.192.2]2 Holt-winter 7.3208
Fig 8. Comparison between Navie & Holt_Winter Models in Terms Of Mape Values
Disaggregated Data:
SNO Model Values
1 Navie 5.5166
2 Holt-winter 7.1316
Fig 9 Comparison between Navie & Holt Winter Models in Terms Of Disaggregated Data
AIC VALUES For: Daily:
SNO Model Values
1 Navie 550.36
[image:3.595.312.541.52.245.2]2 Holt-winter 739.54
Fig 10 Comparison between Navie & Holt_Winter Models In Terms Of Aic Values Daily
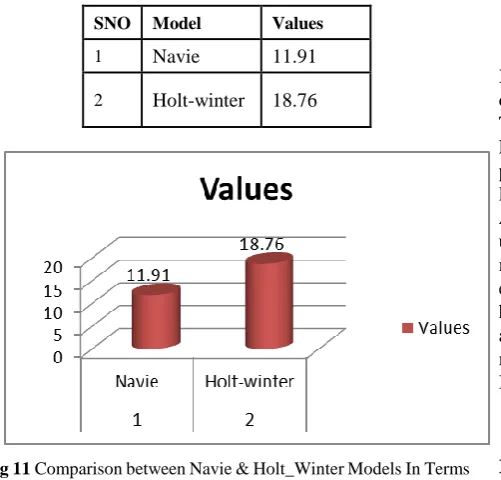
[image:3.595.48.558.207.803.2] [image:3.595.306.549.501.715.2]SNO Model Values
1 Navie 11.91
[image:4.595.55.306.48.288.2]2 Holt-winter 18.76
Fig 11 Comparison between Navie & Holt_Winter Models In Terms Of Aic Values Weekly
Monthly:
SNO Model Values
1 Navie 13.24
2 Holt-winter 20.43
Fig 12 Comparison between Navie & Holt_Winter Models In Terms Of Aic Values Monthly
[image:4.595.54.553.162.822.2]AIC Measurement Comparison:
Fig 13 AIC Measurement Comparisons
V. CONCLUSION
In this article, we utilized information about time arrangement of keen meter at an inspecting rate about person moment. Those streaming information will be stacked under HDFS Previously, A hive table, which is further exported under r in place should perform predictive examination Furthermore load profile Investigation. We utilized exponential Smoothing Also ARIMA model should foresee what's to come power utilization. We likewise evaluated the correctness of the models toward utilizing those MAPE values [11]. AIC estimation examination for Navie & Holt winter models might have been carried out and the comes about were demonstrated as needs be. The Straightforwardness and adaptability of r modifying may be great used to would those determining Investigation.
.
REFERENCES
[1] DammindaAlahakoon, Member, IEEE and Xinghuo Yu, Fellow, “Smart Electricity Meter Data Intelligence for future Energy Systems:A Survey”, DOI 10.1109/TII.2015.2414355, IEEE Transactions on Industrial Informatics, 2013
[2] T Zhang, G Zhang, J Lu, X. Feng, and W. Yang, “A new index and classification approach for load pattern analysis of large electricity customers”, IEEE Transactions on Power Systems, vol. 27, no. 1, pp 153-160, February 2012.
[3] GTM Research, 2012, “Understanding the Potential of Smart Grid Data
Analytics” (White
Paper).Available:http://www.emeter.com/documents/anylstpapers/Und erstanding-the-Potential-of-Smart-Grid-DataAnalytics.pdf [Accessed 26th April 2014]
[4] “Managing big data for Smart meter and Smart Grids” (Whitepaper), IBM Research,2012,Available:http:://www.ibm.com/research/2012/M anaging-big data-for-Smart-meter-and-Smart-Grids.pdf [Accessed 10th March 2014]
[5] Asad, Mohamad, “Finding the Best ARIMA Model to Forecast Daily Peak Electricity Demand”, Proceedings of the Fifth Annual ASEARC Conference - Looking to the future - Programme and Proceedings, University of Wollongong, 2012
[6] Junwei Miao, “The Energy Consumption Forecasting in China Based on ARIMA Model” International Conference on Materials Engineering and Information Technology Applications (MEITA 2015) [7] ChandraBhushanKesavabhotla, Professor V. V. HaraGopal, Professor A. VinayBabu, “Application of Analytics using R Programming for Forecasting Day-ahead Electricity Demand”, IJCSI International Journal of Computer Science Issues, Vol. 9, Issue 6, No 1, November 2012. [7] N. Sree Aishwarya, N.V.G.K. Vamsi, G. Ramya, Ch.Pavan Kalyan, Ch.
Nanda Krishna “Time series data analysis by integration of R and Hadoop via hive ” An International Conference by IEEE, ICCS 2018 (978-1-5386-2842-3).
[8] OmidArdakanian, NegarKoochakzadeh, RaymanPreet Singh “Computing Electricity Consumption Profiles from Household Smart Meter Data”,theWorkshop Proceedings of the EDBT/ICDT 2014 Joint Conference,2014
[9] Robert H. Shumway & David S. Stoffer, “Time Series Analysis and Its Applications with R Examples,” 3rd ed. New York: Springer, 2011. [10] Balaji K. Bodkhe, Dr. Sanjay P. Sood“Analysis of Smart Meter data
using Hadoop”, International Journal of Current Engineering and Scientific Research (IJCESR), Volume-2, Issue9, 2015
[11] http://www.real-statistics.com/time-series-analysis/basic-time-series-fo recasting/holt-winters-method/
[12] https://www.otexts.org/fpp/2/3
[13] Nageswara Rao Moparthi, Dr. N. Geethanjili “Design and implementation of hybrid phase based ensemble technique for defect discovery using SDLC software metrics”, An International Conference by IEEE, PP. 268 – 274 ,2016
Author-1 Photo
Author-2 Photo
hor-3 Photo
Identification for BIRTHMARKS in Light of DYKIS" International Journal on Future Revolution in Computer Science & Communication Engineering, Vol 3,Issue 11, PP 221-226,2017
AUTHORS PROFILE
Dr P.Vidya Sagar received his Ph.D degree from Sri Krishnadevaraya University, Andhra Pradesh, India and he is presently working as Associate Professor in the department of Information Technology in Velagapudi Ramakrsihna Siddhartha Engineering COllege, Vijayawada.he has total 15 years of experience and his research interest includes Iot,data Analytice, cyber secirity and neworks.
Dr M.Nageswara Rao received his Ph.D degree from Sri Krishnadevaraya University, Andhra Pradesh, India and he is presently working as Associate Professor in the department of Computer Science and Engineering in Velagapudi Ramakrsihna Siddhartha Engineering COllege, Vijayawada.he has total 18 years of experience and his research interest includes Iot,data Analytice, cyber secirity and neworks.