Rochester Institute of Technology
RIT Scholar Works
Theses
Thesis/Dissertation Collections
5-1-1989
Navigational tool for the Graphic Design Archive
Ken Hayward
Follow this and additional works at:
http://scholarworks.rit.edu/theses
This Thesis is brought to you for free and open access by the Thesis/Dissertation Collections at RIT Scholar Works. It has been accepted for inclusion
in Theses by an authorized administrator of RIT Scholar Works. For more information, please contact
ritscholarworks@rit.edu.
Recommended Citation
Rochester
Institute
of
Technology
A thesis
Submitted
to the
faculty
ofthe
College
ofFine
andApplied
Arts in
Candidacy
for the
Degree
ofMASTER
OF FINE ARTS
'NAVIGATIONAL
TOOL FOR THE
GRAPHIC
DESIGN
ARCHIVE"by
Ken Hayward
May
Approvals
Advisor: Robert Keough
Date:
I i - ';)-
-'d"q
Associate Advisor: James Ver Hague
Date:
;2 -
S' -
<Ii
Associate Advisor: James Gray
Date:
I\ -
u .... -
8
S
Special Assistant to the Dean for
Graduate Affairs: Philip Bomarth
Dean, College of Fine and
APPlie~~1iTo,ert
H. Johnston
Date:
.,
I,
Ken Hayward
hereby grant permission to the Wallace Memorial Library
of RIT, to reproduce my thesis in whoie or in part. Any reproduction will not be for commercial
use or profit
j
-
I
~
G
Date:
\'d
r
~
_
-.l2 \
-Table
of
Contents
Title Page
1
Approvals
2
Table
ofContents
3
Acknowledgements
4
Proposal
5
Technical
Notes
6
The
Thesis
8
The Purpose
ofThis
Tool
8
Early
Ideas
10
Visual
Metaphor
vs.No
Visual Metaphor
10
Progressive
vs.Full
Disclosure
12
Creating
the Visual Representational Model
14
Problems
Creating
the Visual Representational Model
15
Creating
the Animated Rotation
21
Developing
the Navigational Tool
22
Magnifying
Buttons
While
Browsing
27
Developing
aGraphic Treatment
31
Creating
Layered Buttons
37
Relationships Between
HyperCard Buttons
andGraphics
39
Backward
Navigation
Strategy
40
End Notes
40
Professional Feedback
41
Scripts
42
Acknowlegments
A
sincerethank
you must goto
the thesis
committee ofJim
Gray,
Bob
Keough
andJim
Ver
Hague.
Without
their
insight,
guidance andpatience, this
projectwouldnothave
been
possible.Special
thanks to the
famous
Nancy
Ryan
for
many
words ofencouragementandfor
being
aProposal
The
purpose ofthis thesis
is
to
explorethe
possibilities ofusing
animationto
enable usersto
create a mental
map
oftheir
location in
a vastand complex sea ofinformation.
With
computers'growing ability
to
give uslarge
pools ofinformation
comesa needfor
usto
usevisual aidsto
help
usfeel
comfortable whileinterfacing
withthese
systems.This
thesis
willuse animated se quencesto
help
orient users asto
wherethey
are,
wherethey
have
been (their
path)
andwherethey
are ableto
go asthey
navigatethrough
a system.These
animationswillbe
created onthe
Macintosh
II
computer andwillbe
usedas abehavior
element associatedwiththe HyperCard
Technical
Notes
HyperCard
is
the
software packagethat
wasusedto
achievethe
interactive
qualitiesthat
are soimportant
to
this
project.HyperCard
uses
it's
ownprogramming language
calledHypertalk.
The
mostusefulfeature
that
HyperCard
has,
for
this application,
is
the
ability
to
create "buttons"These buttons
are notthe traditional
buttons
that
you would see on a controlpanel,
ratherthey
are "soft"buttons.
Soft buttons
aredesignated
areas onaMacintosh
screenthat
whenactedupon(by
clicking
witha mousefor
example) carry
out commands.Video Works
II2is
a software packagethat
allowsthe
creationof animationthat
is
much morecomplexand powerfulthan the
animationthat
canbe
created withHyperCard. HyperCard
animationis very
similar to the
animationthat
childrencreateby drawing
little
picturesin the
cornerof abook's
pages andquickly
flipping
throughthe
pages.Video
Works
II
software onthe
otherhand,
wasdesigned
specifically
to
create animation.
It
allows youto
usetransparency
effectsto
overlay
images
to
achieve adimensional
quality.This overlay capability
was akey
to the
visualsin
my
thesis.
HyperCard
has
afeature
whichallows youto
accessVideoworks II
files
and showthem
onthe Macintosh
screen whileHyperCard
is
run ning.This feature is
calledthe Videoworks
II
Drivel.
The driver is
runby
two
simplelines
ofHypertalk
codethat
needto know the
name ofthe Videoworks II
animationfile
to
be
accessed, the
range offrame
numbersin
the
file
to
be
played andthe location
onthe
screen wherethey
areto
be
played.In
English,
the
code mightsay, "Go to
animationfile
"X",
getframes
onethroughfive
andplay
them
in
the
middle ofthe
screen"be-cause
it
enabledmeto
overcomeHyperCard's
shortcoming
ofblack
and white
only
graphics.It
allowed meto
use more sophisticated ani mationtechniques than those
whichare possiblewithHyperCard.
The Videoworks II
Driver takes
a whileto
accessthe desired
frames
from
memory because it
must searchthrough
all ofthe Videoworks II
files
storedin memory
to
find
the
right one.This
delay
canbe annoy
ing
to
the
user.I had different Videoworks
II
files
for
rotations and graphicswhenI first
began. Later
I discovered
that
it is
possibleto
preload
oneVideoworks II
file
at atime
into
HyperCard's
memory
for in
stant access.
I
strung every
Videoworks II
file
that
I had
togetherto
makeonehuge
file
and pre-loadedit into
memory.This
eliminatedthe
delay
in retrieving
frames
and madethe interaction
runmore smoothly.In
orderto
preventconfusion,
it
is
important to
make adistinction
between
graphicbuttons
andHyperCard buttons.
Graphic
buttons
aresimply Video Works
II
pictures shown onthe
screenthat designate
a set ofboundaries in
which a mouse clickwillhave
some result.The
graphic
buttons
do
nothave
the
powerto
do
this
by
themselves.Hy
perCard
buttons
do have
the
powerto
carry
out orderswhena mouseis
clickedwithintheir boundaries.
Although the
usercan not seethem,
The Thesis
After
deciding
that the topic
ofmy
thesis
wouldbe
the development
of an
interactive
navigationaltool,
the
first
task that I
addressed waswriting
alist
ofexactly
whatI
wouldand would notdo
for
my
project.The
proposalthat
I had
written wasbroad
enoughthat
it
wouldhave
been easy
to
go off ontangents,
soit
wasvery important
that I
had
a preciselist
ofthings that this
project wouldinclude.
Some
things that I
would
have liked
to
work on were eliminatedbecause
oftime
constraints.
For
instance,
icons
wouldbe
very
helpful
for
quick recognitionof
buttons,
but it
wouldhave
been
athesis in itself to design
icons
for
the
72 different buttons in
the
dialogue.
By
making
myself a morepointed
statement,
I
wasableto
focus
on a strictlist
ofthings to
do
without
worrying
aboutbeing
sidetracked.The Purpose
ofThis
Tool:
The
function
ofthis
navigationaltool
is
to
provideafront
endfor
the
Graphic
Design Archive.
The
Graphic
Design
Archive is
in the form
ofa
HyperCard
stackcurrently containing
upwards of900
data
cards.A
user who wants
to
seethe
cardscontaining
examples of paperbackbook
coversdoes
not wantto
sortthrough
each ofthe
900
cardsto
find
them.
It
wouldbe
much easierto
goto
a nicelittle
pile ofcardsthat
have
the
attributesthat
you arelooking
for.
The
Graphic
Design Ar
chive
has been
broken
down
into
ataxonomy
that
categorizesthe
cards
into
groups.This
tool
is
intended to
presentthe
taxonomy
in
amanner
that
is
morevisually
concreteandtherefore
moreintuitive for
users.
This
tool
allows youto
enterthe
Graphic
Design
Archive
cards at aspecific point.
Once
inside,
the
useris
free
to
moveaboutthe
cardsusing
the
card's own means ofnavigation.The
cards are all equippedwitha
button that
has
the
word"navigation"
on
it.
When
pushedthis
button
willtake them back to the
front
endnavigationaltool.
built
specifically
for the
Graphic Design
Archive.
It
wasbuilt
as ameans
for
navigationthrough
any large database
andthe
Graphic De
sign
Archive
wassimply
the
database
that
was appliedto
it.
In
keeping
with
being
generic,
information
aboutthe
Graphic Design Archive
was notprioritizedin
any
way.If
it
were,
categories ofthe
mostimportance
orcategorieswith
the
greatest amount ofinformation
in them
wouldhave been
placedin
positionsonthe
visual representational modelwiththe
most visualimpact
or given aproportionally
larger
space allotmentthan
less important
categories.I
did
notfeel
qualifiedto
makejudge
ments about
the
information in
the
Graphic
Design
Archive
soinforma
tion
was alloted spacein
a randomfashion.
Early
Ideas:
At
the time
whenI
conceived ofthe
idea
for this project, I
had
afew
vague
ideas
of conceptsthat I
wantedto
use.To
keep
track
ofthese
ideas,
I
madethe
equivalent of a sketch padin HyperCard. This
sketchbook
consisted ofmany
roughHyperCard
animation prototypesthat il
lustrated
the
ideas
that
I
wasdeveloping.
These
conceptsbehind
these
little demos became
the
basis
ofthe
wholethesis
project.Laying
the
Groundwork-Visual
Metaphor
vs.No Visual
Metaphor:
Before I actually
began to
workonthis
projectI
decided
to
plan exactly
what coursethat
I
wantedto take in terms
ofthe look
andfeel
ofthe
interactive
dialogue.
One
ofthe
most sensitivedecisions
that
had
to
be
made waswhetherto
use avisual metaphoror not.Visual
metaphors are graphic
treatments
usedin interactive
mediathat
givethe
with
the
use offile folder icons.
Immediately
upon recognition ofthe
icon
eventhe
first
time
user will summon allthat
they
know
about realfile folders
andapply it
to the
icon.
They
know
that
whenthey
open afile
folder
in
the
real worldthey
see all ofthe
files
that
areinside
ofit.
Intuitively
they
know
that
if
they
open afile
in the Macintosh world,
they
will
have
accessto
all ofthe
files inside
ofit.
A large
part ofthe
battle
ofhaving
people understandhow
to
interface
with a system canbe
won
if,
by
simply
recognizing
afile
folder
icon,
a user can assume"This
must work
like
afiling
system"A
visualmetaphor,
when usedwellcanbe
a valuableframework
aroundwhich
to
organizethe
presentation of visual material.Problems
can,
however,
arise whenthe
metaphoris
taken
literally.
Using
the
file
metaphorfor
an exampleagain,
one can seethat,
whilethe
metaphor workswellin
revealing
simplethings
like
the
ability
to
open afile
and see whatis inside
ofit,
it becomes
a constraint whenthe
system needsto
do
things that
areinconsistent
withthe
metaphor.Say
Macintosh
wants
to
allow a personto
openfiles
that
areburied
three
layers
deep
withouthaving
to
openthe two
layers
aboveit
first.
The
whole meta phoris based
on what weknow
about realfile folders
and weknow
that
with real
file folders
you cannot open afile
that
is
three
layers
deep
withoutfirst opening
the
files
aboveit first.
Allowing
these
files
to
do
things that
realfiles
can notdo
violatesandin
some casesinvalidates
the
metaphorfor
the
user.At
that
pointthe
metaphorbecomes
an anchor around
the
dialogue designers
neckbecause it is
notflexible
enough
to
support new options.In my
opinionthere
is
atrade-off
withany
visual metaphor.Using
ametaphor
is
greatbecause
it helps inexperienced
usersget a quick sensefor how
the
system worksandit is
a niceway
to
organize a simple
interaction.
The
trade-offis
that if the
systemis going
to
grow andget more powerful and
complex, the
metaphor willinvariably
break
down.
At
some pointthe dialogue designers
willhave
to
decide
whethFor my
projectI decided to
sacrificethe
benefit
of a visualmetaphorfor
the
flexibility
of a system whereI
made all ofthe
rules.I decided to
design
an objectthat
wouldvisually
representthe
body
ofinformation
in the
Graphic Design
Archive.
This
object wouldbe
a symbolfor the
database
andit
wouldhave
a set of physical propertiesthat
pertainedto
it
only.The
trade
offfor
notusing
a metaphor wasthat there
wouldbe
alearning
curvethat
users would needto
digest
these
propertiesand understand
how to
work withthem.
To
shortenthis
learning
curveI
wouldhave
to
develop
ofa visualtreatment that
wouldbe
somewhatintuitive
to
users.For
the
graphictreatment,
I
wantedto
create avisualmodel
that
would representthe
Graphic
Design
Archive
taxonomy
andwould
illustrate
the three
layers
ofdepth
that
it
had.
Progressive
vsFull Disclosure:
Another
early
concernwaswhetherto
make all ofthe textual informa
tion
fully
disclosed
atthe
outset ordisclosed progressively
as youmove
through
the
Graphic
Design
Archive
taxonomy.
Progressive
dis
closure gives you
only
the
top
layer
ofinformation
atthe
beginning
anddispenses
more asthe
userneedsit. This
is particularly
usefulto
the
inexperienced
userbecause it
allowsthem
concentrate onthe
job
athand
withoutbeing
distracted
by
peripheralinformation that
is
notneeded yet.
Full disclosure better
suits power users who want all ofthe information
availablesothat
it
canbe
processedin
aless
structured fashion.
Power
usersdo
not wantto
gothroughA
andB
to
getto
C,
preferring
ratherto
jump directly
to
C.
The
solutionto the
progressiveversusfull
disclosure debate
that I
came
up
withwas acompromiseofsorts.I
wantedto
be flexible
enough
to
lead first
time
usersthroughthe
taxonomy
step
by
step
whileallowing
the
experienced usersto have the
powerto
skip
layers.
Infor
mationwould
be
chunkedto
acertaindegree
onthe
representationalHowev-er,
once an area ofthe
modelis
chosenthere
has
to
be
a meansfor
giving
the
userinformation,
whetherit
be
all atonce or alittle
at atime.I decided
to
fully
disclose
the information
within anareain
amannerthat
gave somefeeling
of orderto the
different
layers. This
would entail
making
the
top
layer the
focus
of attentionfor inexperienced
usersbenefit
while stillhaving
the bottom layer
accessableto the
experienced users.
Creating
the Visual Representational Model:
In
creating
avisual representationofthe
Graphic
Design
Archive,
I
was
faced
withtwo
mainconcerns,
screen space anddatabase
size.Since I
knew that I
wouldbe working
onaMacintosh
computerusing
HyperCard
software,I
was awarethat there
weregoing
to be
severe spaceconstraintsbecause the HyperCard
windowonthe
screenonly
measures
approximately
5
1/2x7 inches.
The
portion ofthe Graphic
Design Archive
taxonomy
that I
wasusing had
51 different
endpoints.This
told
methat
I had
to
be very
efficient withthe
spacethat
was avail able.I
consideredusing both
organic and geometricforms
to
repre sentthe
Graphic
Design Archive
taxonomy
but
chose geometric shapesbecause their
modular qualities allowfor
more efficient use ofspace.
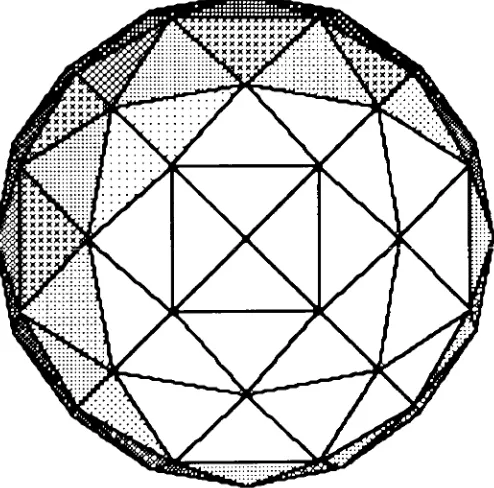
The
most spaceefficient shapesfor text
placement,I discov
ered,
were squares andrectanglesandthe
least
efficient were circles andtriangles.I
spent a greatdeal
oftime sketching
various shapesandconfigurationsof shapes and
finally
settled on a3-D
geodesicsphere.
This
spherewhichis
madeup
ofpentagonsandhexagon
is
similar
in
appearanceto
asoccerball.
The
hexagonal
panels onthe
sphere would each
be
aseparatebutton
and all ofthe
separatebuttons
wouldform
togetheras onewholeunitthat the
usercould rotate.This
unit, the
sphereis
extendablein that
it
canbe
sub-dividedto include
Problems
Creating
the
Visual
Representational Model:
At
this point, the
need aroseto
puttogether
a quick prototype ofthe
3-D
sphereto
seeif it
wasafeasable
solution.First,
I
learned
to
usethe
softwarefor
Pro
3-D
and withit,
I
created a sphere.In
constructing
asphere,
Pro
3-D
automatically
useshexagonal
panels.When
viewing
the
sphere straighton, the
centerhexagonal
panellooked
perfect
andthe
panelssurrounding it
wereskewedto
look convincingly
[image:14.529.87.335.322.572.2]like
they
werein
perspective(See figure
1).
However,
whenrotated one quarterturn the
center panel onthe
spherewasno
longer
ahexagon,
it
was a square.In addition, the
surrounding
hexagonal
panels werebadly
skewedbut
notin true
perspective,leav
[image:15.529.89.336.255.499.2]ing
me with unacceptable results(See figure
2).
Figure 2
This
distortion
is due
to the
problemswithdisplaying
a3-D
objectin
2-D
space.Looking
straighton, the
sphere appearsto
be
auniformandsymetricalobjectshown with
the
properperspective.When
the
objectis
rotated90
degrees,
it
becomes
apparentthat the
objectis
notuniform
atall,
it is
createdin
suchaway
asto
givethe illusion
of perspecThe
next attemptat a solution wasthrough the
use of anothersoftware
package,
Swivel
3-D5This package,
whichsupportscolor,
worksin
muchthe
sameway
asPro
3-D,
exceptthat
ratherthan
using
hexagonal
panels,
it
used verticle andhorizontal
circles,
like lines
oflat
itude
andlongitude,
to
constructits
sphere.This left
mewitha sphere [image:16.529.102.317.278.492.2]made
up
of paralellogramsratherthan
hexagons (See figure
3)
Figure 3
This
was aninteresting
possibility
since squares and rectangles arethe
most space efficient
for the
placement oftype.
The
problem wasthat
when rotatedvertically,
the
top
andthe bottom
ofthe
sphere(where
the
northand southpoleswouldbe
on aglobe)
weremadeup
oftrian
Figure 4
This
inconsistency
of shapeleft
mewith another unacceptableprototype.
There
were no more3-D
software packages atmy
disposal,
soI
had
no alternative otherthan
to
develop
a newgeometricalform.
This
form
was madeup
of cubes arrangedto
resemble a3-D
plus sign(See
Figure
6
This
objecthad
allofthe desirable
propertiesthat the
spherehad.
It
was
modular, geometrical,
3-D,
rotatableand extendable.I
usedSwiv
el
3-D to
constructthe
form,
whichwas madeup
of sixseparate cubes [image:19.529.60.352.178.459.2]Creating
The Animated Rotation:
As
mostpeopleknow,
to
create an animation you need a series of pictures of an object shown atdifferent
positions and playedquickly
to
givethe illusion
of motion.Swivel
3-D
helped
a greatdeal in
creationthe
images
that
I
neededto
animatethe
rotationofmy
object.After the
object was created all used afunction
called"'tweening".
To
"'tween"you
first
needto
designate
a start positionfor
your object.Next
youhave
to
move or rotateyourobject anddesignate
astop
position.Then
youspecify
the
number offrames
you wantbetween
the
start andthe
stop frame
andthe
computerwillmovethe
objectfrom
the
startto the
stop frame in
the
specified number offrames.
Swivel
3-D
has
abuilt in light
sourcethat
addsto the
feeling
ofdepth.
The light
sourcecasts a shadow onthe
objectthat
gives anir
regularappearancewhenthe
objectis
rotated.To remedy
this
problem,
I had
to
take
eachindividual
frame
out ofSwivel
3-D
and pasteit
into
a color paint package calledPixel Paint
andtouch
it
up.Developing
the
Navigation Tool
The
visual representation ofthe
Graphic Design Archive
as weknow is
a3-D
objectthat
when notrotating,
has only
oneface
visibleata
time.
The
object needsto
be
rotatedin
orderto
see whatis
onthe
other
faces. To
begin the
interactivity
it
wasnecessary
to
create ameans
for
manipulating
the
rotation ofthe
object.First
a navigationalsymbol needed
to
be
createdthat
wouldtell the
first
time
usersthat the
object was rotatable and
to
act as atool to
allowthem to
actually
rotate
it. After many
thumbnail
sketchesI
decided
on a symbolthat
had
four
arrowsradiating from
a center origin andpointing
up,
down,
left
and
right, the
directions
in
whichthe
object rotate(See figure
7).
Figure
7
The
navigationalsymbol was createdwiththe
HyperCard
painttools
and
it
was placeddirectly
onevery
cardin the
HyperCard
stack.This
enables
the
userto
rotatethe
representationalobject atany
time.
Now
that the
navigational symbol wascreated,
it
neededto
be
brought to
life
andgiventhe
powerto
actually
manipulatethe
representationalobject.
This
power was achievedby
applying HyperCard but
tons to the
symbol.I
createdfour invisible HyperCard
buttons slightly
larger
in
sizethan
the
arrowheadsofthe
navigationalsymbolandFigure
8
The
codefor the button
onthe
upward arrow saidin
essence,"When
this button
is
pushed,
showten
Video Works
II frames
ofthe
objectrotating
upwards.The
otherthree
arrowbuttons had
appropriatescriptfor
their indicated direction
ofrotation.Metaphorically,
HyperCard
is
a stack ofindex
cards groupedinto dif
ferent
relations.Each
card cancarry
out commandsby
itself.
One
type
of commandthat
wasparticularly
usefulin
this
project wasthe
"open
card"command.
This
command says"When
you cometo this
card,
do
this..."
Since
the
taxonomy
had five faces
worthofinforma
tion,
I
createdfive
different cards,
onefor
eachface.
Using
the
"opencard"
command,
the
codesaid, "When
you cometo this card,
showthe
Videoworks
II
frame that
has
a picture ofthis
face"
(See
script2).
By
combining the
rotational powerofthe
navigational symbol andthe
open cardcommandthe illusion
of a3-D
objectin full
rotationwasachieved.
The
rotationalframes
are generic-that
is
the
sameten
frames
ofrotation areshownevery
time the "rotate
right"button
is
pushed.
What
makesit
look different
is
that
afterthe ten
frames
areshown
there
is
acommandin
the button
scriptthat
sends youto
the
nextcard.
There the "open
card"
commands
takes
overand showsthe
appropriate
frame for that
sideofthe
representationalobject.When
the "rotate
right"
button
is
pushed on cardone,
you seeten frames
ofrotation
quickly
followed
by
the image
offace
two.
If
you pushthe "ro
tate
right"
button
again you seethe same
tenframes
of rotationfol
lowed
by
the image
offace three
and soon.Since
the
visual represenwhen you push
the
"rotate
right"button
on sidefour
you aretakento
side one again
to
completethe 360
degree
rotation.The
verticle rotation worksin
the
sameway
asthe horizintal
rotationwitha
few
exceptions.The
representational modelhas
sixfaces but
the
taxonomy
has only five faces
worthofinformation.
Rather than
having
five full
sides onthe
model and oneblank one, I
decided
to
eliminate
the
empty
sidefrom the
verticle rotation.This
meansthat
every
time that
you rotate eitherup
ordown from faces
one,
two,
three
or
four,
you aretaken to
face
five.
The
effectis like
that
offlipping
acoinover.
It does
not matterwhetheryourotate180
degrees
upwardsor
downwards,
you stillendup
onthe
opposite side.From
sidefive
everytime you rotate
vertically
you returnto the
face
that
you camefrom.
This
is
achievedby
using
the
"push"and
the
"pop"card com
mands.
To
"push"a card
is
to
putit into memory
andto
"pop"a cardis
to
retrieveit
from
memory.The
codefor the "rotate
up"button
oncards
one,
two,
three
andfour say, "When this button
is
clicked pushthis
card(remember
it),
showten
frames
ofupwardrotation and goto
card
five (See
script3)"The
"rotate
up"button
on cardfive
says,
"When this button
is
clicked,
showten
frames
of upward rotation andpop
the
card(retrieve
it
from
memory)"(See
script4).
The
visual representational modelcreatedwithSwivel
3-D
is simply
a skeletonwithno
data
attachedto
it.
Swivel 3-D does
not supportthe
use of
text,
soanothersolution neededto
be found
for
applying
textual
information to the
visual representationalmodel.At
this
stagethe
necessary Swivel
3-D
frames
for full
verticle andhorizontal
rotation werestored as
Videoworks II files.
What
was needed werethe
dividing
lines
for the different buttons
oneachface
andthe corresponding text
de
scribing
the button.
I
usedPixel
Paint to
createthe text
andthe
appropriate
dividing
lines for
eachbutton.
These
graphicswerein
essence aPixel
Paint overlay
that
was copied out ofPixel
Paint
and pastedinto
the Videoworks II
files
ofthe
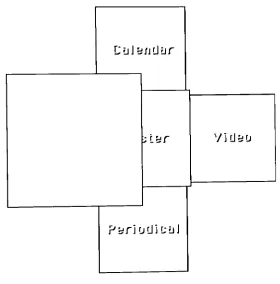
representationalmodel.The ruling lines
and
the text from Pixel
Paint
waslayed
overa side ofthe
representational
modelin
muchthe
sameway
asatransparentpiece of acetateup (See figure
9).
CLiJb/jdLjr
PULJLbir
LJU'J'/.
V i d
b D
P
b;r
1
dl!
i
fjli
J
[image:24.529.59.364.135.508.2]Magnifying
Buttons While Browsing:
In
an effortto
save space onthe
tiny
HyperCard
window,I devel
oped an animation
strategy
that
enlargedthe
area onthe
representational
modelthat the
userwaslooking
at,
making
the information
onit
morelegible.
It is physically impossible
to
cram all ofthe information
that I
had
ontothe HyperCard
windowat onceand stillhave it
allbe
a comfortabletype
size.Instead,
I fit
all ofthe information
onthe
screenin
an uncomfortabletype
size and created an animationthat
enlarged onebutton
at atime
like
amagnifying
glass might(See
figure 10).
rjLjJ
=niiur
r>JLjJ'.
;iztrV i
rJ
b;rj
PbriL
jrJJULlJ [image:25.529.71.346.327.599.2]I
madethe
assumptionthat
whereverthe
cursor moved onthe screen,
the
user's eyes wouldbe
moving.Based
onthat assumtion,
I decided
to
enlargewhatever area onthe
representational modelthat the
cursorwas
in.
To do
this
atransparent HyperCard button
was placed overthe
boundary
of each ofthe
top
layer
button
graphics onthe
representational
model.These HyperCard buttons had
an"on
mouseenter"com
mand.
These
commands are carried outevery
time the
mouse entersthe
boundaries
ofthat
HyperCard button. The
codefor
these
Hyper-card
buttons
saidbasically,
"If the
cursor entersmy
boundary,
showthe
Videoworks
II
frame
with a picture of meenlarged"
(See
script5).
This
meantthat I
neededto
create newVideoworks
II
frames showing
each of
the
button
graphicsin the
wholetaxonomy
enlarged.These
graphics were created with
Pixel
Paint.
Once
the
userhad
enlargedthe
button
graphics whilebrowsing
it
wasnecessary
to
eliminatethe
old
HyperCard
button that
did
the
enlarging
and replaceit
with newHy
perCard
buttons
that
had
the
powermovethrough
the taxonomy.
This
was
done
by
modifying
the
Hypertalk
scriptto say, "If the
cursor entersmy
boundary,
hide
this
HyperCard
button
and showthe layer
oneHy
perCard
buttons.
Then
showthe
Videoworks
II
frame
with a picture ofme
enlarged"
(See
script6).
Hiding
andshowing
HyperCard buttons
simply
makesthe
buttons
usable orunusable.A
"mouse
leave"command was usedto
stop
morethan
onebutton
from
being
enlargedat atime.
Whenever the
cursor exited abutton's
boundaries
a scripttold the button
graphicsto
shrinkto their
originalstateand
to
have
the
currentlayer's HyperCard buttons hidden (See
script
7).
The
actionofenlarging
the button that
you arelooking
at enablesthe
userto
have
the
powerofbrowsing
throughthe
areas onthe
representational model without
risking making
adecision
by
pushing
the
but
ton.
The
pressure ofmaking
a choice seemsto
create a greatdeal
ofanxiety,
especially
withinexperienced
users.It
seemsrefreshing
to
be
The fear
ofinteracting
with acomputer comesin
partfrom
people'sfear
ofbeing
in
unfamilliarsurroundings
or worseyet,
lost. The
real goal ofthis
projectwasto
createan enviromentin
which usersfelt
athome
andwere notapprehensive aboutmoving
around andpossibly
getting
lost.
A
fault
ofmany interactive
systemsis
that
they
changethe
usersenvironmentor world when a
decision like
abutton
pushis
made.
By
changing
their world, I
meanthat
users arehurled into
an atmosphere
that
has
adifferent
graphiclook. Often
times,
important but
tons
have
a newlook
and/orlocation
which compoundsthe
problem.The time
whenthe
useris
adjusting
to their
new surroundingsis
some whatdistressing
because
they
areforced
to take
a momentto
gettheir
bearings
straight andto
decide
whetherthey
arein
the
right place.In
experiencedusers seemto
equatemaking
choiceswiththe
unpleasentexperienceof
landing
themselves
in
some unknown surroundings.To
avoidthis
distressing
situation, I
wantedto
keep
the
userin
one en vironment at alltimes.
The
reinforcementofstaying
within a stable world seemsto
make people morewilling
to
explore withoutchancing
Developing
aGraphic
Treatment
Finding
asuitablegraphictreatment
for
each side ofthe
representational
model was atricky thing
to
do.
In the
early
stages ofplanning it
was
decided
to
have
all ofthe
information
on eachface
accessable atall
times.
This
meantin
some casesshowing
three
layers
worthofbut
tons
onthe
screen atonce,
hopefully
in
a non-chaoticfashion.
To
visually
orderthese
buttons into
ahierarchy
I
usedthe
graphicdesign
prin cipals ofproximity,
color and size manipulation.The
representationalmodel
itself is
a mediumintensity
blue.
I
wantedthe
top
level button
graphics
to
be
the
mostvisually
prominent sothat
they
wouldjump
out atthe
first
time
usersindicating
that
it
wasthe
mostimportant
thing
to
look
at.To do
this I
useda14
pointbold
typeface in
ahigh
intensity
yellow
to
contrast withthe
object.To
punchup
the
text
evenmore,
I
added a
dark
blue
drop
shadow.That
sameblue
was usedto
outlinethe
perimeter ofthe
buttons
andto
help
reinforce whatthe text
wentwith
this button.
The
text
wasplacedin the
center of eachbutton to de
mand maximum visual attention.
The
secondlayer button
graphics neededto
be visually strong
enough
to
be easily
readable withoutcompeting
withthe layer
one graphics.For
both the text
andthe
dividing
lines
I
selected a subdued shade ofblue
lighter in
chromabut
more subduedin
valuethan the
blue
ofthe
object.For
the text I
useda12
point normal weighttype
face
with nodrop
shadow.The
text
wasplacedin the
extreme cornersof
it's buttons
asfar away
from the layer
onetext
as possible.The
goalfor the layer three
graphics wasto
be
legible to
experienced users who
knew
whatthey
werelooking
for,
but visually less
prominentthan
the
rest ofthe
graphics.For
this
I
used avery
muddy
shade ofredthat
wasvery
closein
valueto the
blue
ofthe background.
This
color was usedfor both the text
andthe
dividing
lines.
The
text
wasa nine point
light
typeface that
waseasy
to
missif
youdid
notknow
whatyou werelooking
for.
transparen-cies over a
face
ofthe
object.The first layer
that
was placedoverthe
object was
the
layer
three graphics,
followed
by
the layer two
andfinal
ly
the layer
one.This
layering
effecthelped
to
accentuatethe
visualhierarchy
because in
somecases,
layers
ofgraphicsactually
layed
ontop
ofotherlayers clearly showing
the
ordering
from
top
to bottom (See
figure
11).
D
Lt
J
=!/j
d
Li
r
DULl!'.
Pu'^Lbir
V i
rJ
b 'j
pyr]
urJi l;lj
J
[image:29.529.66.346.275.551.2]As
the
usermovesalong
from layer
oneto layer
two the layer
onetransparency
is visually
peeled off(See figure
12).
LLiJb
si'Aur
Abf
ViUyrj
[image:30.529.68.348.218.502.2]pyriE
jU ]
t; u
J
Figure 12
The
graphicsfor
layer two then become the
mostimportant
and needto
be
adjusted.The
intensity
ofthe blue text
andlines
aregivenaThe
sameidea
carriesover whenmoving from layer
two to layer
three.
In this
casethe
layer two
graphics are peeled off andthe layer
three
graphics arepunchedup
in
lineweight,
typesize
and colorintensi
ty
to
be
perfectly
legible (See figure
13).
L-'LjJy/jrJrjr
Aur
V ]
rJ
bid
[image:31.529.70.347.249.522.2]P^rU
\U ]
[; u
J
From the layer three
buttons,
the
useris
taken
directly
to
the
Graphic
Design Archive
cards(See figure
14).
/
Data Cards
Designer
Date
Location
Medium
Title
Rand,
Paul
1975
Canada
Printed
image,
lithography
Two-page spread on
Paul Rand
from
membersbook,
Alliance
Graphique Internationale [image:32.529.31.519.233.572.2]1:1
Creating
Layered
Buttons:
The
challengeofkeeping
the
user'senvironment stableinvolved
some
very detailed Hypertalk
programming.To do
this
it
wasnecesse-sary
to
construct alayered
network ofbuttons
on each card.It
wasthis
layering
that
enabled afirst
time
userto
navigate onelayer
at atime
while
allowing
anexperienceduserto
skip layers. The
key
factor in
de
termining
how many layers
wouldbe jumped
wasthe
number oftimes
the
mouse was clicked.One
click advancedthe
useronelayer,
two
clicks moved
them two
layers
etc.The first
thing
that
wasneeded was a meansfor
keeping
track
ofthe
number oftimes the
mouse was clicked within a period oftime.
I
chose
to
keep
this
period oftime to
one secondto
differentiate
but-ween
first
time
and experienced users.I felt
that
in
this
short period oftime
a user mustbe deliberate
to
register multiple clicks.The
userswhoare unsure of
themselves
wouldprobably
make one click.If
they
accidentally did
maketwo clicks,
it
wouldbe unlikely
that
they
wouldcomewithina one second span.
The device
that
I developed
to
keep
track
ofthe
number of mouseclicks
is in
essence a counter.It
worksby
making
a container and putting
oneinto
the
container onthe
first
mouse click.For
each subsequent mouse click
in
the
next onesecond,
oneis
addedto the
container.
After the
one secondhas
elapsed, the
containerhas
the
number ofmouse clicks
(See
script9).
With
the
number ofmouse clicksavailable,
it is
possibleto
constructHypertalk
"if"statements. "If"statements are structured
to
say
"If
xis
true then
do
y".The
"if"statements
that
I
madeto
utilizethe
informa
tion
that the
counterheld
saidthings
like,
"If the
number2
is in
the
counter
then
goto layer
2"With
"if"statements you mustconsideran
alternative action
for
the times
when yousay
"If 2
is in
the
counter..."
and
there
is instead
a3 in
the
counter.Here
you use"else"
state
ments.
"Else"
says
"If that
does
notwork,
try
this.
"Else"stringsto
gether"if"
to
layer
1
eJse. if
2
is in the
counterthen
goto
layer
two"(See
scriptl0).
The
taxonomy
itself is very
general atthe
top
andit
gets more spe cificas you movedown. The Hypertalk
scriptsofthe
buttons
are structured
in
the
same way.At
the
top
layer
a single clickfrom
anywhere withinthe
graphicbutton
takes
youto
layer
two.
However,
atriple
click atany
two
different locations
withinthe
graphicbutton
willtake
youto
totally
two
different
places.The
thing
that
allowsthis
flexibility
is
the
structuring
ofthe
HyperCard button
scriptsfrom
generalto
specific.The
top
layer
graphicbuttons
actto
aninexperienced
userlike
onebig
button
that
whenclickedtakes them to
layer
two.
It is
in
fact many
different HyperCard buttons
that
do identical
things
when one clickhas
been
registeredin the
counter.This underlying HyperCard
button
structure
movesthe
inexperienced
useralong
astep
at atime,
but it is
too
slow
for
powerusers.To
givethem
moreflexibility,
the
many little
Hy
perCard
buttons
that
do identical
things
whenone clickhas been
registered in the
counterdo
different
things for
the
cases wheretwo
orthree
clicks
have
been
registeredin
the
counter.Triple clicking
ona Hyper-cardbutton
can cut outtwo
stepsfor
a poweruserandtake them di
rectly
to their
destination from
the
top
layer
graphics.Relationships
between
HyperCard Buttons
andGraphics:
The
powerofthis
layered HyperCard scripting is closely
tied to the
visual
layering
ofthe
screen graphics.The
graphics are structuredin
a visualhierarchy
that
correspondswiththe
scripting
heirarchy.
The
top
layer
graphicsjump
outfor
the inexperienced
user who canin turn
click anywherein
the
prominentarea and goto the
nextlayer.
The layer
three
graphics arevisually
submissivebut
they
arelegible to those
ex perienced who arelooking
for them.
At
the
top
layer
experienced us ers can seethese
graphics andtriple
click onthe
desired
button to
jump
to their destination.
As
abutton
is
pushed andthe
useris
taken
to
a newlayer,
the
ap
must also
be
newHyperCard buttons
to
correspondwiththe
new graphics. This is done
by
utilizing
the
"hide"and "show"commands.
When
the
button is
pushedsending
youto
a newlayer,
all ofthe
now obsolete buttons
onthe
currentlayer
arehidden
and allthe
buttons
for the
new
layer
are shown(See
script8).
Hiding
andshowing
buttons
in
HyperCard
affectsthe
screengraphics
from
Videoworks II.
If
aVideoworks
II
image is
onthe
screen and abutton is hidden
orshown,
an areathe
same size andlocation
ofthat
button
as erasedfrom
the
Videoworks II image. To
workaroundthis
problem,
it is
necessary
to
do
allhiding
andshowing
ofbuttons before
calling
the
Videoworks II image. There
are some caseshowever,
where
this
solutionis
not enough.Backward Navigation Strategy:
So
far,
all wehave
dealt
withis moving
deeper
into
the taxonomy.
In
somecases,
when auserrealizesthat
they
are onthe
wrong track,
there
is
a needto back
out ofthe taxonomy.
As
mentionedearlier, the
method
for
escaping any
graphicbutton
is
to
simply leave
the boundar
ies
ofthat
button
withthe
cursor.At
that time the
screen graphicsfor
the button
shrinkto the
originalstate, the
currentlayer's buttons
arehidden
andthe
browsing
button
is
shown.The
scriptthat
does
the
exiting
is in every HyperCard
button.
The
problemis
that
eventhough the
top
layer
actslike
it is
onebig
button,
it is in fact many
smallbuttons.
Each button says, "When the
mouseleaves my
boundary
hide
allthe
buttons
atthis layer
etc."(See
script8).
If
the
cursormoves out of asmall
HyperCard
button
but
you stillwantedto
stay
withinthe
graphicbutton,
there
is
a problem.I
had
to
develop
something that
only
shrunkthe
graphics andhid
the buttons
if
youleft
the
screenbutton's boundar
ies.
To do
this I
gotthe
coordinatesfor
the
screen graphics andtested
to
seeif
the
cursor waswithinthem
whenit
left
the HyperCard button.
within
the button
graphics coordinatesthen
do nothing but
if
it is
notwithin
the
button
graphics coordinatesthen
shrinkthe
graphics andhide
the
buttons"(See
script10).
Professional Feedback:
When
the
thesis
projectitself
wasfinally
finished,
I
decided
to
getsome expert
feedback
on its'performance.To
getthis
feedback,
I took
the
projectto
aninteractive
team
atthe
Xerox
Corporation. The
team
seemed
interested in
the
demo
that
I
showed,
particularly
by
the
concept of
representing information
as a physical object.They
alsofelt
that the
rotational qualities ofthe
representational model werestrong
and
that
having
the
buttons
enlarge whilebrowsing
workedwell.They
mentioned
that
they
would ratherhave
seenicons
than text in
some areas.
They
also saidthat
whenlooking
at aface
ofthe
representationalobject,
it
wasnot apparentthat there
were other adjacentfaces.
This
problem,
weagreed wouldhave
been
remediedif the
objecthad
been
a sphere
because
the
peripheralfaces
wouldhave
been
visible onthe
horizon.
The
team
was notentirely
happy
withthe treatment
ofthe
deepest
layer
graphicbuttons.
They
felt
that
they
werenot readableenough even
for
the
users whoknew
whatthey
werelooking
for.
Summary:
This
thesis
wasasuccessfulprojectfor
mein
that
I
was ableto
explore a
fascinating
topic
in
greatdetail.
The
concepts andideas
usedin
this
projecthad
been
in my
head for
sometime
andit
wasa pleasureto
finally
develop
them
andputthem
to the test
atmy
thesis
show.The
project stayed on schedulewhichwas a good exercise
for
workin
acorporateenvironment.
In
the
future,
I hope to
do
further
research andScript
1
CI ipUU
116,
31,
396,
311
PlayUU
UUIocation,
256,171,
uwnocI
ear ,vwnoupdate, vuirange,45,
1
Script 2
on OpenCard
I
ock screenput
"
53,
54,
55,
56,
60,
63,
64,
65,
66,
67,
68,
69,
70,
71,
72,
73,
put
"
16
,17 ,18,19,
20,
"
into
otherI DHol der
repeat iv
i
th
n =1
to
the
number ofitems
in
but
I
DHolder
set cursor
to
busy
hide
card buttonid
item
n ofbut
I DHol der
end repeat
repeat w
i th
n =1
to
the
number ofitems
in
otherI DHol der
set cursor
to
busy
show card
button
id
i tern
n of otherI
DHol der
end repeat
unlock screen
CI ipUW
116,
31,
396,
311
PlayUU
UUIocation,
256,171,
vwnoclear ,uunoupdate, vwrange,45,
1
Script
3
on
mouseup
CI ipUU
116,
31,
396,
311
PlayUU
UUIocation,
256,171,
uwnoclear,
vwrange,
23,
33
go
to
cardid 6246
push card
end
mouseUp
Script
4
on
mouseUp
CI ipUU
116,
31,
396,
311
PlayUU
UUIocation,
256,171,
uwnoclear,
vmnoupdate,
vwrange,
23,
33
pop
cardend
mouseUp
Script
5
on mouseEnter
CI ipUU
116,
31,
396,
311
PlayUU
UUIocation,
256,171,
vwnoclear ,vuinoupdate,
uuurange,
67,
1
Script
S
on mouseEnter
show card
button
id
99
show card
button
id
100
show card
button
id
101
show card
button
id
102
show card
button
id
103
show card
button
id
104
show card
button
id
105
show card
button
id
106
show card
button
id
107
show card
button
id
108
show card
button
id
109
show card
button
id
110
show cardbutton
id
111
show card
button
id
112
show cardbutton
id
113
hide
cardbutton
id
20
CI ipUU
116,
31,
396,
311
PlayUU
UU
ocati
on,256,171,
vwnoclear ,vuinoupdate,
vwrange,
end mouseEnter
Script
7
on mouseLeaue
hi de
cardbutton
i d
99
hi de
cardbutton
d
100
hi de
cardbutton
d
101
hi de
cardbutton
d
102
hi de
cardbutton
d
103
hi
de
cardbutton
d
104
hi de
cardbutton
d
105
hi de
cardbutton
d
106
hi
de
cardbutton
d
107
hide
cardbutton
d
108
hi de
cardbutton
d
109
hi de
cardbutton
d
110
hi
de
cardbutton
d
111
hi de
cardbutton
d
112
hi de
cardbutton
d
113
show cardbutton
id
20
CI ipUU
116,
31,
3<PlayUU
UUIocation
36,
311
,
256,
171,
uwnoc:lear .vwnoupdate, uwrange, end mouseLeaueScript
8
on mouseLeaue
if
item
1
ofthe
mouseLoc >122
anditem
1
item
2
ofthe
mouseLoc >104
anditem
2
ofof
the
mouseLoc <256
and-the
mouseLoc <237
then
exi t
mouseLeauee
I
sehide
cardbutton
d
99
hide
cardbutton
d
100
hide
cardbutton
d
101
hide
cardbutton
d
102
hide
cardbutton
d
103
hide
cardbutton
d
104
hide
cardbutton
d
105
hide
cardbutton
d
106
hide
cardbutton
d
107
hide
cardbutton
d
108
hide
cardbutton
d
109
hide
cardbutton
d
1 10
hide
cardbutton
d
1 1 1
hide
cardbutton
d
112
hide
cardbutton
d
113
show cardbutton
d
20
CI ipUU
116,
31,
3<>6,
311
PlayUU
UU
ocati on,
256,171,
uwnoclear endi f
end mouseLeaue
Script
9
message
box
on
mouseUp
put yes
into
the
put
1
into
temp
put
the
ticks
into
startrepeat until
the
ticks
-start >
15
if
the
mousedick
then
add1
to
temp
end
i
f
endrepeat]
endmouseUp
Script
10
on
mouseUp
put yes
into
the
messagebox
put1
into
temp
put
the
ticks
into
start repeat untiI
the
ticks
-start >
i f
the
mouseCI i
ckthen
add
1
to
temp
endi f
end repeat
if
1
is
in
temp
then
15
de
cardbutton
de
cardbutton
de
cardbutton
de
cardbutton
de
cardbutton
de
cardbutton
de
cardbutton
de
cardbutton
de
cardbutton
de
cardbutton
de
cardbutton
hide
cardbutton
id
110
hide
cardbutton
id
111
hide
cardbutton
id
112
hide
cardbutton
id
113
show card
button
id
1 14
show card
button
id
1 15
show card
button
id
116
show cardbutton
id
1 17
show card
button
id
118
show card
button
id
1 19
show card
button
id
120
show card
button
id
121
show card
button
id
122
show card
button
id
123
show card
button
id
124
show card
button
id
125
show card
button
id
126
show card
button
id
127
show cardbutton
id
142
CI
ipUU
116,
31,
396,
311
PlayUU
UUIocation,
256,171,
vwnocI
earvwnoupdate,
vwrange,
e
I
sei f 2
is
in
temp
then
hide
cardbutton
d
99
hide
cardbutton
d
100
hide
cardbutton
d
101
hide
cardbutton
d
102
hide
cardbutton
d
103
hide
cardbutton
d
104
hide
cardbutton
d
105
hide
cardbutton
d
106
hide
cardbutton
d
107
Script
10
(continued)
hi de
hide
hi
de
hi de
hi de
show show show show show show show show show show show show show show show card card card card card card card card card card card card card card card card card card card cardCI ipUU
116
button
button
button
button
button
button
button
button
buttonbutton
button
button
button
button
button
buttonbutton
button
button
button
31
d
d
d
d
d
d
d
d
d
d
d
d
d
d
d
d
d
d
d
d
396
PlayUU
UUIocation,
else push cardgo
to
cardend
i
f
end
i f
end mouseUp
109
110
111
112
113
128
129
130
131
132
133
134
135
136
137
138139
140
141
145
311
256, 171,
uwnoclear .uwnoupdate, vwrange,78,
1
d
18214
of stackBibliography
1
HyperCard,
Version
1.2,
Apple
Computer,
Inc.
Cupertino,
CA
2
Video
Works
II,
Version
2.02,
Macro
Mind,
Inc.
San
Fransisco,
CA
3
Video Works
II
HyperCard
Driver,
Version
1.2,
Macro
Mind,
Inc.
San
Fransisco,
CA
4
Pro
3-D,
Version
1.2,
Enabling
Technologies
Fresno,
CA
5
Swivel
3-D,
Version 1
.00L,6 Pixel
Paint,
Version
1.1,
Super Mac
Software,