1996
Employee retention through the use of an exit
interview
Martha Anne Stock Iowa State University
Follow this and additional works at:https://lib.dr.iastate.edu/rtd
Part of theBenefits and Compensation Commons,Business Administration, Management, and Operations Commons, and thePerformance Management Commons
This Thesis is brought to you for free and open access by the Iowa State University Capstones, Theses and Dissertations at Iowa State University Digital Repository. It has been accepted for inclusion in Retrospective Theses and Dissertations by an authorized administrator of Iowa State University Digital Repository. For more information, please [email protected].
Recommended Citation
Stock, Martha Anne, "Employee retention through the use of an exit interview" (1996).Retrospective Theses and Dissertations. 16956.
by
Martha Anne Stock
A Thesis Submitted to the
Graduate Faculty
in
Partial Fulfillment of the
Requirements for the Degree of
MASTER OF SCIENCE
Interdepartmenal Program: Industrial Relations
. 1 Relations
Signatures have been redacted for privacy
versity
TABLE OF CONTENTS
ACKNOWLEDGMENTS ... iii
INTRODUCTION ... 1
LITERATURE REVIEW ... 2
METHOD ... 27
RESULTS ... 36
DISCUSSION ... 55
REFERENCES CITED ... 73
APPENDIX A. ORIGINAL UNIVERSITY EXIT SURVEY ... 83
APPENDIX B. REVISED UNIVERSITY EXIT INTERVIEW ... 86
ACKNOWLEDGMENTS
I would like to thank the participants of this study who dedicated their time
and sincerity to cooperate and make this project possible. I would also like to
thank the Provost Office for their helpfulness and support of the study. Finally I
would like to thank Dr. Kathy Hanisch for the time and commitment she gave this
study, and the members of the research team who put a huge effort into this
INTRODUCTION
The purpose of this study was to develop and administer an exit interview
and questionnaire to identify possible issues that may be used to improve
retention of faculty at a midwestern state university. The interviews included
tenure-track faculty who were voluntarily resigning or retiring from their
University positions. A comparison group of employees who were employed by
the University was also included. The interviews were based on variables that
the literature shows to be important, such as some components of job satisfaction
(work, pay, promotion, co-worker, and supervisor) and employee voice. The
interviews also assessed organizational withdrawal behaviors that may precede
turnover or retirement. The interview consisted of primarily closed-ended
questions with a section of open-ended questions. After administering the
interviews from summer 1994 to fall 1995, statistical analyses were completed.
Descriptive statistics and correlational analyses were conducted. The results
were evaluated and possible problem areas identified. Recommendations to the
University administration will be made about possible methods to improve
LITERATURE REVIEW
The Importance of Employee Retention
An organization needs tools to help retain its employees because the cost of
turnover is significant. This cost not only includes the initial investment of hiring
a replacement, but many other factors such as the training costs accrued with the
previous employee, wages paid to the new employee while he/she is training,
errors and inefficiencies of the new employee, lower morale in present
employees due to attrition, and increased demand on managers of the new
employees (Hinrichs, 1971). Garretson and Teel (1982) mention other costly
factors involved in turnover including costs of the exit interview, lower
productivity prior to an employee actually resigning, costs of attracting the new
employee, interview costs, expenses associated with medical and psychological
exams of the employee being hired, and moving expenses. Some research has
estimated the cost of hiring a new employee. Hiring costs can range, now dated,
from $1,000 to hire a clerk (Hulin, 1966) to more than $300,000 for a combat ready
fighter pilot (Atchison & Lefferts, 1972). Mirvis and Lawler (1977) estimate the cost of replacing a non-managerial employee to be above $2,500. Garretson and
Teel (1982) estimate employee replacement costs between $2,290 to $10,360.
These replacement costs illustrate the importance of reducing turnover.
However, the assumption should not be made that all turnover is detrimental
to organizations or that organizations should reduce all turnover. There are
instances when turnover may be acceptable. For example, it may be that
technological change necessitates some degree of turnover. However, the case of
greatest interest and importance to the organization is when a low performing employee quits and can be replaced by a higher performing employee (Porter &
but to have "selective control of attrition" (Hinrichs, 1971). A human resources
program that is cost effective will attempt to minimize turnover among high
performers (Cascio, 1982). Dalton, Krackhardt, and Porter (1981) have made a
distinction between functional and dysfunctional turnover. Functional turnover
is defined as turnover that is beneficial to the organization. The individual wants
to leave the organization and the organization is not concerned about the loss
because it considers the individual a below average performer. Dysfunctional
turnover is the case in which an employee wants to leave the organization, but
the organization wishes to retain the individual because the individual has made
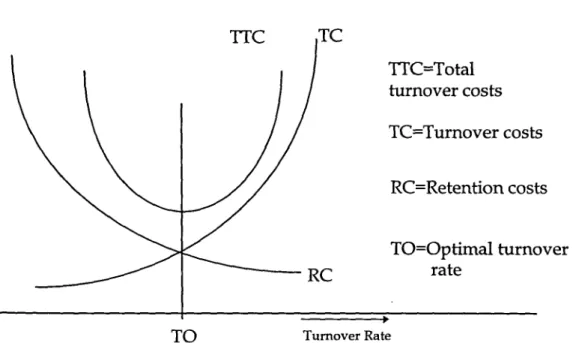
valuable contributions to the organization. Abelson and Baysinger (1984) agree
with these definitions, but expand on them further. They state that dysfunctional
turnover is divergence from the equilibrium where the costs of turnover equal
the costs of retention. This relationship is shown in Figure 1.
Diverging in either direction (spending more on turnover or more on
retention) is inefficient because it moves away from the organization's minimum
cost point. Abelson and Baysinger (1984) specify retention costs to include
higher compensation, promotion and intraorganization transfer, conflict
enhancement, and diminished staffing flexibility. Turnover costs include the
things mentioned earlier in this paper that Abelson and Baysinger (1984)
categorize as higher administrative overhead, new employee socialization,
opportunity costs to the organization, and group dynamics interfered with by
new staff. Even when the organization wishes to retain certain individuals
because of the benefits they bring to the organization, the cost of retaining them
may outweigh the value of keeping them in the organization. The organization
must however, realize that any point past the optimal turnover rate is
TO
TC
TTC=Total turnover costs
TC=Turnover costs
RC=Retention costs
TO=Optimal turnover rate
~
Turnover Rate
productive employee. The organization should then take the necessary steps to
retain productive employees. The goal is therefore to "minimize dysfunctional
turnover without artificially suppressing functional turnover II (Dalton et al.,
1981). When dysfunctional turnover exists, the organization wants to make
special efforts to meet the needs of the productive employees to keep them from
leaving the organization. However, an indication of what those needs are must
first be determined by the organization.
The Relationship Between Perfonnance and Turnover
The observation that turnover of the under productive or less productive
employees is beneficial to the organization, while the turnover of high
performers is harmful to the organization introduces the question of the
probability of an organization losing its high performers. If the organization
only lost the low performers, turnover would likely be welcomed by the
organization, in spite of the cost. On the other hand, if the high performers were
more likely to leave, the organization should be making significant investments
in reducing turnover. The question of whether stayers or leavers perform better
has produced mixed results (Martin, Price & Mueller, 1981; Wells & Muchinsky, 1985; Keller, 1984; Stumpf & Dawley, 1981; Karner, Brandt & Crosby, 1988).
There may be a general tendency, however, to suggest that higher performers are
more likely to leave than lower performers (Martin et al., 1981). Theoretically,
higher performers may be more likely to stay because they are more rewarded
by the organization than lower performers, which is positively related to the
productive employees' job satisfaction, and should reduce their probability of
mobility and ease of finding another job (Price, 1977). Therefore, higher
performance allows employees to translate dissatisfaction into leaving easier
(Lucas, Babakus & Ingram, 1990).
Schwab (1991) performed a study on the employee performance-turnover
relationship that is relevant to the proposed study. He measured the
relationship between performance and turnover of tenure-track professors at a
large midwestern public university. He chose to measure performance by
number of research citations, because research was an aspect of performance that
was emphasized by the University more than community service or teaching.
Citations are also externally visible to other employers (i.e., other universities).
He found a positive relationship between performance and turnover (r=.30) for
tenured faculty. High performing faculty were in a situation that was conducive
to a positive performance-turnover relationship. Because of their visible
performance through publications and presentations, they also have an external
labor market demand that leads to potential lateral mobility. This positive
relationship was found in spite of the fact that the University this study was
conducted at has a history of rewarding high performers. For untenured faculty
he found quite different results; a negative performance-turnover relationship
(r=-.31). This relationship could be due to two issues. First, low performers are
probably aware of the fact that they do not have a good chance of attaining
tenure and quit. Second, in this university, untenured faculty's salary was 97
percent of peer institutions, giving untenured faculty little incentive to move to
another university for pay increases (Schwab, 1991). Furthermore, untenured
faculty may not be as visible because they have not had time to produce as many
publications as well as the time lag between research publications and their
Lucas, et al., (1990) stated that there are two important issues in turnover.
First is the desirability of changing jobs, and second is the perception of difficulty
in finding other employment. In the case of high performing professors, they
may not typically perceive difficulty in finding other employment, and if they
are not satisfied with their job, they have all the incentive necessary to quit.
Schwab's (1991) study shows that retention of the faculty who are high
performers, especially tenured, is an extremely relevant issue in the University
setting. However, it is also important to look at untenured faculty, particularly
those who are high performers, for reasons they have in common with each
other, and with the tenured faculty for leaving such as co-worker or supervisor
dissatisfaction.
The Importance of Job Satisfaction and Turnover
An important variable to consider when investigating turnover is job
satisfaction. Job satisfaction is a logical variable to consider because when a
person holds positive regard for an object, that person will behave favorably
toward that object (Hom, Katerberg, & Hulin, 1979). Brayfield and Crockett
(1955) state " ... organisms tend to avoid those situations which are punishing and
to seek out situations that are rewarding. To the extent that worker
dissatisfaction indicates that the individual is in a punishing situation we should
expect dissatisfied workers to be absent more often and to quit the job at a higher
rate than individuals who are satisfied with their work (p. 415)."
Job satisfaction is a frequently studied variable as a correlate of employee
turnover. Overall, the relationship between job satisfaction and employee
turnover is consistently negative and usually about -.40 or less (Mobley, Horner,
decreased turnover by increasing job satisfaction of clerical employees (Ford,
1969; Hulin, 1968).
In Hulin's study (1968), he initially measured the job satisfaction of female
clerical workers. At the time of initial measurement, annual turnover was 30%.
In response to the areas where employees expressed a lack of satisfaction, the
organization implemented a program to increase satisfaction. Two years after
the implementation, Hulin measured the employees I job satisfaction and the
organization's turnover level again. He found a significant increase in job
satisfaction in four of the five areas measured (as the implementation was
intended to achieve). Furthermore, he also found that turnover had decreased to
12%. Mirvis and Lawler (1977) state that by increasing employees' job
satisfaction by .5 standard deviations in an organization, they expected a direct
savings of $17,664 in turnover costs, although this figure would be different for
every company.
Although job satisfaction is not the strongest correlate of turnover, it is
considered extremely valuable and practical because it gives organizations specific knowledge about what aspects of jobs need to be improved. This
knowledge is not afforded by some other stronger correlates such as intention to
leave or organizational commitment (Hom, et al., 1979).
Because there is a consistent relationship between job satisfaction and
turnover, job satisfaction is considered an important variable in the prediction of
turnover. However, because the relationship is consistently no stronger than it
is, many researchers have hypothesized intervening variables between job
satisfaction and turnover. These moderating variables imply conditional
these are found in the work of Arnold and Feldman (1982), Mobley, et al., (1978),
and Hanisch and Hulin (1991).
Arnold and Feldman's model, shown in Figure 2, is an example of a model
that uses an intervening variable between job satisfaction and turnover. In this
model, age has an effect on tenure, job satisfaction has an effect on intention to
search, and organizational commitment has an effect on perceived job security.
Tenure, intention to search for alternatives, and perceived job security cause
turnover.
Mobley, et al., (1978) proposed the model presented in Figure 3.
They theorize that in the turnover process job satisfaction leads to thinking of
quitting, which leads to intention to search, followed by intention to quit/ stay,
which finally leads to turnover or staying. They suggest that age/ tenure has an
effect on both job satisfaction and probability of finding an acceptable alternative;
and probability of finding an acceptable alternative has an effect on intention to
search and intention to quit/ stay. Their results indicated that intention to
quit! stay was the only variable that had a significant impact on turnover.
Mobley, et. aI's (1978) model uses these intervening variables to help explain the
relationship between job satisfaction and turnover. Miller, et al., (1979) collapsed
Mobley, et. aI's (1978) model into four general categories: Withdrawal behavior
(turnover), withdrawal cognitions (intention to quit, intention to search, thinking
of quitting), job satisfaction, and career mobility (age/tenure, probability of
finding an acceptable alternative). They replicated and supported the model
presented in Figure 3 with the exception of career mobility accounting for
significant variance beyond withdrawal cognitions and beyond both satisfaction
lI...a_g_e _ _ _ _
---'I-+
tenurejob
satisfaction
orgaruzatIOnal commitment L..-_ _ _ _ _ ...J
intention to search for alternatives
erceived
-+
job security---+~
I
turnover--Job Satisfaction
•
Thinking of
Quitting --~
Intention to
Agerrenure Search
-+"
4~
Intention to
~.
Quit/Stay4l
Probability of Finding An
Quit/Stay 4 Acceptable Alternative
Figure 3: Mobley, Horner, and Hollingsworth's (1978) model of the turnover
r
a1aryI
~
~\
~Ir"E-d"':;U'-ca-ti-o-n---'
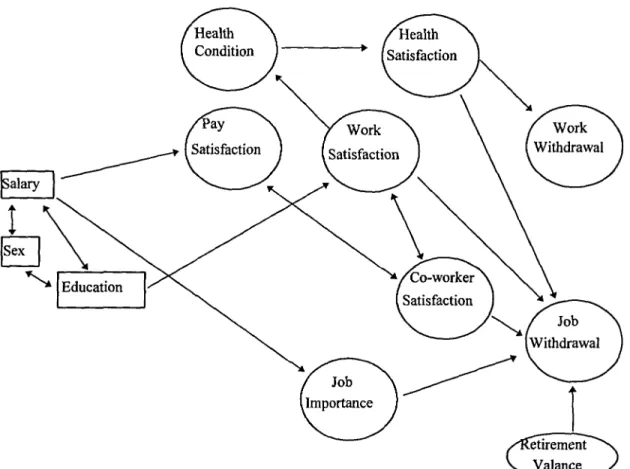
Hanisch and Hulin's (1991) model breaks job satisfaction down into more
specific components as shown in Figure 4. This model shows several specific
components of job satisfaction: Pay satisfaction, work satisfaction, and co-worker
satisfaction. Turnover is represented in this model by job withdrawal and
includes both resignation and retirement (the inclusion of retirement will be
discussed later). Along with the specific components of job satisfaction, other
variables important in the prediction of job withdrawal are health satisfaction,
job importance, health condition, and retirement valance. Not only does this
model emphasize the need for additional explanatory variables, it also shows the
importance of representing the specific components of job satisfaction separately.
A specific representation of the factors of job satisfaction will identify why an
employee is dissatisfied, that will potentially provide the organization with
specific information on how to retain the employee (Porter & Steers, 1973).
Summary of Models and Application to This Study
We did not use all of the intervening variables in the models described in
this paper (see Figures 2, 3, and 4). The intervening variables we did not use in
this study included: Intention to search for alternatives, probability of finding an
acceptable alternative, thinking of quitting, intention to search, and intention to
quitj stay. These variables are not relevant when a person has already resigned
or retired from his/her job, only when he/ she is considering leaving.
Furthermore, we were not testing a causal model, but were interested primarily
in understanding the attitudes and behaviors of those exiting from an
Variables
that
Influence Job SatisfactionPorter and Steers (1973) identify four categories that have an effect on job
satisfaction: Organization-wide factors, immediate-work-environment factors,
job-related factors, and personal factors. Organization-wide factors include
variables that affect an employee that are not determined within the employee's
immediate work group, such as pay and promotion policies.
A negative relationship has been found between pay and promotion and
withdrawal (turnover and absenteeism) in several studies (Friedlander &
Walton, 1964; Hulin, 1968; Knowles, 1964; Patchen, 1960; Ronan, 1967; Saleh, Lee
& Prien, 1965). The theoretical explanation of this negative pay and promotion
relationship with turnover that has the greatest support involves the wayan
employee perceives equity in the rewards hel she receives compared to the effort
hel she gives. If an employee can not find a way to restore equity, hel she may
increase the number of absences, ask for a transfer, or resign (Miner, 1992).
Knowles (1964) even found that failure to receive an "expected wage" was a
better predictor of voluntary turnover than the actual amount of the wage.
The second category that Porter and Steers (1973) mention having an effect on
job satisfaction is immediate-work-environment factors that include such things
as supervisory style and the nature of peer group interaction. Turnover was
shown to have a negative relationship with supervisor satisfaction in studies by
Saleh et al. (1965), Ley (1966), Hulin (1968), and Telly, French, and Scott (1971).
However, Taylor and Weiss (1969a, 1969b) did not find this negative
relationship. Satisfactory peer group interactions have also been shown to have
a negative relationship with turnover (Evan, 1963; Hanisch & Hulin, 1990,1991; Hulin, 1968; Faris, 1971). Co-worker satisfaction has been shown to be important
The third category of factors affecting job satisfaction is job-related factors,
that refer to variables such as the overall reaction to job content, job autonomy
and responsibility, and role clarity. Overall reaction to job content deals with
satisfaction with assigned tasks. Work satisfaction has been shown to have a
negative relationship with turnover in several studies (Saleh et al., 1965; Katzell,
1968; Hanisch & Hulin, 1990, 1991; Taylor & Weiss, 1969a, 1969b; Telly et al.,
1971; Wild, 1970). Hulin (1968) found no relationship between work satisfaction
and turnover. The general relationship seems to hold true however for both blue
and white collar positions (Porter & Steers, 1973). Job autonomy has to do with
being able to make decisions about the way you do your work, and
responsibility means that you take credit for the outcomes of your work. The
final job-related factor is role clarity. Several studies have found that role clarity
also has a negative relationship with turnover (Weitz, 1956; Youngberg, 1963;
Macedonia, 1969; Lyons, 1971).
The final category of factors that influence job satisfaction are personal factors
which include age and tenure with the organization (Porter & Steers, 1973).
Many studies have shown that age has a strong negative relationship with
turnover (Minor, 1958; Fleishman & Berniger, 1960; Shott, Albright & Glennon, 1963; Ley, 1966; Bassett, 1967; Downs, 1967; Stone & Athelstan, 1969; Faris, 1971;
Robinson, 1972). Although Downs (1967) and Shott et al.(1963) found mixed
results. Tenure also has shown a negative relationship with turnover in the
studies by Fleishman and Berniger (1960), Shott et al. (1963), Knowles (1964), and
Robinson (1972).
The Importance of Employee Voice and Turnover
Spencer's (1986) study has shown that organizations having a high number of
retention rates. Voice is defined as trying to change a problematic situation
(Spencer,1986). Past research has focused on leaving, only one of multiple
options for dissatisfied employees. Very rarely has previous research
emphasized the alternative of staying and trying to change the situation. When
employees have this alternative, they may choose it instead of resigning
(Spencer, 1986). The theoretical ground work for this research was laid by
Hirschman (1970, 1974) who proposed the two alternatives of exit and voice.
Voice is extremely important to the organization when people who make
decisions in the organization lack knowledge, in which case voice can be a rich
source of information (Hirschman, 1974). Spencer's (1986) study found that
employee voice mechanisms such as a grievance procedure or survey feedback
resulted in a significant negative relationship with employee turnover. His
results showed that the more opportunity the organization gives employees to
voice dissatisfaction about their work situation, the lower the turnover rate.
Spencer (1986) suggests that by offering mechanisms to voice dissatisfaction,
organizations may be able to stop intent to leave from ever happening.
Turnover as an Aspect of Job Withdrawal
Both absenteeism and turnover are generally seen as forms of withdrawal.
There are several general ways of conceptualizing the relationship between the
two variables (Burke & Wilcox, 1972; Gupta & Jenkins, 1982). One viewpoint
suggests that withdrawal behaviors are on a continuum. Absenteeism precedes
turnover, and represents the same decision, but on a smaller scale (Herzberg,
Mausner, Peterson & Capwell, 1957). A second viewpoint states that absences are alternative behaviors to turnover; this position is supported by several
Tavistock researchers (Hill & Trist, 1955; Rice & Trist, 1952). In support of the
relationship, while turnover is the severance of the relationship. Talachi (1960)
argued that employees who are dissatisfied find a minimum level of
performance, and maintain only that level, continuously enacting undesirable
organizational behaviors. Another position states that there is no relationship
between absenteeism and turnover (March & Simon, 1958).
Generally, past research has found the relationship between absenteeism and
turnover to be positive on the individual level (Beehr & Gupta, 1978; Behrend &
Pocock, 1976; Fleishman, Harris & Burtt, 1955; Gupta & Beehr, 1979; Gupta & Jenkins, 1982; Martin, 1971; Ronan, 1963; Van Zelst & Kerr, 1953; Waters &
Roach, 1971, 1979; White, 1960). Gupta and Jenkins (1982) believe these results
negate both the second and third view point (alternative and null relationships).
The third viewpoint is negated by a relationship being found, and the second
viewpoint is negated by the fact that it is a positive relationship.
Several researchers have found support for the first viewpoint, a progressive
relationship between absenteeism and turnover (Burke & Wilcox, 1972; Knox,
1961; Lyons, 1972; Melbin, 1961; Muchinsky, 1977). Kraut (1975) supports
viewing turnover as an extreme behavior along a continuum. Burke and Wilcox
(1972) found that absenteeism grew progressively worse until finally ending in
termination. They mention however, that part of this effect may have been a
result of strict attendance procedures. If the organization studied had not had
strict control over attendance, Burke and Wilcox (1972) believe they may have
gotten results that favored the alternative behaviors viewpoint. Employees
would have been able to choose to withdraw through absenteeism without being
held accountable and eventually terminated. Burke and Wilcox (1972) believe
that based on their findings, organizations should not make stricter absenteeism
policies, but they should use absenteeism as a flag, to get the organizationts
and Jenkins (1982) point out that absences immediately prior to turnover may
simply be due to job search activities, such as applying and interviewing. This
would appear to be a progressive relationship, but may not represent a
withdrawal behavior based on underlying dissatisfaction.
The work of some researchers (Hanisch & Hulin, 1990, 1991; Roznowski &
Hanisch, 1990) emphasizes the fact that organizational withdrawal is more than
just absenteeism and turnover. Several researchers (Gupta & Jenkins, 1980, 1982;
Hanisch & Hulin, 1990, 1991; Roznowski & Hanisch, 1990; Zaharia &
Baumeister, 1978) hypothesize that organizational withdrawal includes many
other behaviors such as lateness, early retirement, and escapist drinking.
Hanisch and Hulin (1990, 1991) and Roznowski and Hanisch (1990) suggest that
withdrawal behaviors occur in patterns or families of behaviors, not as isolated
events. These patterns of behaviors can serve as predictors of turnover, therefore
they argue that research should include a wider range of withdrawal variables
(Hanisch & Hulin, 1990). Employees have a general tendency to cope with
complex organizational environments in an adaptive way that manifests in many
behaviors. Attitudes lead to an entire repertoire of behaviors (Roznowski &
Hanisch, 1990) which should be looked at together, and not just individually.
When turnover is considered as an aspect of withdrawal, the cost of turnover
(described earlier) is only a portion of the entire costs of the behavioral pattern of
withdrawal.
Gupta and Jenkins (1980) define employee withdrawal as a "volitional
response to perceived aversive conditions, designed to increase the physical
and/ or psychological distance between the employee and the organization."
Hanisch and Hulin (1990, 1991) specify two components of organizational or
employee withdrawal; job withdrawal and work withdrawal. Job withdrawal is
themselves from a specific organization and their work role; withdrawal from
their job." Two manifestations of job withdrawal empirically supported by
Hanisch and Hulin (1990, 1991) were resigning and retiring. Work withdrawal is
defined as "behaviors dissatisfied individuals use to avoid aspects of their
specific work role or minimize the time spent on their specific work tasks while
maintaining their current organizational and work-role memberships" (Hanisch
& Hulin, 1990, 1991). A causal model with correlates of these withdrawal
behaviors was presented in Figure 4.
Retirement as an Aspect of Job Withdrawal
In the past, researchers have specifically said that retirement should not be
included in the category of voluntary turnover because it was typically not under
the volitional control of the individual (Abelson & Baysinger, 1984; Gupta &
Jenkins,1982). However, since congress abolished mandatory retirement in 1986
with tenured faculty exempt from compliance until January 1, 1994, it is now
functionally very similar to resigning and should be considered a part of the
withdrawal process (Hanisch & Hulin, 1990, 1991). No longer is an older person
forced to leave his/her job, it is his/her choice to leave. People are not expected
to continue working until a certain age nor to quit at a certain age. This change
in mandatory retirement leaves employees' voluntary decision to retire likely
due to such factors as how satisfied they are with their work, how they feel
about their co-workers and working conditions, how satisfied they are with the
pay they receive, and how important they feel their job is; the same factors that
play an important role in employees' decision to quit a job (Hanisch & Hulin, 1990). An employee who wants to remove him or herself from a specific
Retention of the retiring, who are typically the employees with the most
tenure, may involve some different considerations than the resigning employees,
however. Although the employees who have been with the company the longest
may have more to offer the company than employees who have not been with
the company as long, they may cost the company more than new employees.
Employees with more years of service are likely paid well and have more
benefits, and in some cases, they may have only maintained, or even decreased
performance output. If these conditions are true, they may be able to be replaced
by younger, less expensive employees with a great deal of potential at a lower
cost (Miner, 1992). This is certainly not always the case. For example, there are
times when an employee with more years of service has been continuously
gaining knowledge about the organization and his/her job, which is worth more
than the higher price that may be demanded to retain him/her. This is again an
issue of productivity. Older employees that are more productive should be
given extra retention efforts, while turnover of the under productive employees
with the most tenure (usually through retirement) may serve a function for the
organization. This is an area that organizations should investigate when
considering retention and retirement issues.
The Exit Interview
Retention of the high performers is important to an organization. One way
an organization can identify areas needing improvement in order to retain
employees is through an exit interview. An exit interview is a way of assessing why employees are leaving. Common denominators in dissatisfaction revealed
by the exit interview can be valuable information to the organization for future
employee retention and employee relations (Melcher, 1955). If the organization
interview can help specify what they are and help facilitate continuous
improvement. Giac10ne and Duhon (1990) state that the exit interview can be
used "as a tool to uncover organizational characteristics that may contribute to
employee turnover." Hilb (1978) comments that the goal of the exit interview is
"getting objective information about an employee's reasons for leaving. The
strengths and weaknesses of the company and the job (Diagnosis Function) and
realistic suggestions for improvement (Therapy Function) should also be
discussed. II
Exit interviews have been used in many different forms to attempt to uncover
the information that the organization feels is important. Smith and Kerr's (1953)
study of 48 companies' exit interviews investigated the frequency that employees
report for leaving such as inadequate pay, poor housing/ excessive rent,
promotion, communication with higher levels, supervisor, health, transportation,
confidence in management, company's interest in employee welfare, personal
happiness as affected by job experience, co-workers, job security, and working
conditions. The top five reasons they found for people leaving were pay,
transportation, working conditions, poor health, and job security. Although
these reasons are important, employees needs may have changed since 1953.
Lefkowitz and Katz (1969) looked at the following voluntary avoidable
reasons for leaving a factory job: Nature of the work, working conditions,
personal relations-peers or supervisors, piece rates, absolute amount of money
to be earned, and accepting another job. They found different responses to the
exit interview about why employees were leaving depending on if the interview
was done by a member of management or an outside consultant. If an outside
agent performs the exit survey instead of someone within the organization (such
• uncovering, by the outside agent, of additional factors, and entirely
different reasons for termination than management found
• more mention of management
• dissatisfaction with management (not mentioned before)
• more dissatisfaction with the job content
• employees reported lower earnings from their new jobs (Hinrichs, 1971)
Lefkowitz and Katz' (1969) research gives evidence to the sensitive nature of the
exit survey, and the benefits of it being performed by someone who is not a superior of the employee.
In an overview of 18 organizations, Garretson and Teel (1982) found the
topics covered in exit interviews, in the order most commonly covered were:
Reason for departure, new job and salary, rating of job, supervision, working
conditions, advancement opportunities, training, pay, the possibility of the
employee returning, the possibility of having prevented the departure, things
liked best about the job, things liked least about the job, and suggestions.
Unfortunately, the exit interview is not always used to its full potential to
improve the company, and sometimes the results are not used at all. In
Garretson and Teel's (1982) study of 18 major organizations, they found that 33%
of the organizations did not view the exit interview as a tool to improve the work
environment by identifying problems, and 42 % said they made no changes in policies, procedures, or the work environment in response to the exit interviews.
To which Garretson and Teel (1982) respond, IIIf they feel that the information
obtained is useless, why do they go to the trouble and expense of collecting it?"
Not only is the company expending unnecessary effort and time, they may be
hurting themselves by building a reputation among the employees of not acting
on their intentions of improving things by administering an exit interview, or not
Although the exit interview is an extremely useful tool for employee
retention, it does have some weaknesses. One of the most prominent weaknesses
is the risk of employee falsification. Joyce Lain Kennedy (1993), providing advice
to the general public said:
... Beware the exit interview. If you go through one, limit your remarks to happy
talk. Even if the company, in a sincere attempt to gain nuggets of wisdom,
brings in an outside consultant who comes back a year later for a second, and,
the consultant hopes, more candid exit interview, you have absolutely nothing to
gain by revealing just how incompetent your boss is, or whistle-blowing on
other corporate skeletons. Despite the assurances of confidentiality, be
relentlessly positive in your comments ... The exit interview is not the time to
unload years of pent-up rage ... Leave on an amicable note, realizing that one day
you may need every last one of your references. Gob Market, p.l)
Kennedy (1993) is openly encouraging leavers to falsify for their own benefit.
Organizations have no way of knowing if employees are being honest, and in
many cases it would be easier for employees not to be. Employees may view
negative comments as burning bridges behind them; they may later need the
organization's assistance in some way (e.g., future references). It may be easier, for example, for exiting employees to say that they are going back to school or
moving to a better climate than that they did not like their job or had been
sexually harassed by their supervisor. The category of employees leaving for
unavoidable reasons (e.g., moving or pregnancy) may be overstated due to this
type of falsification (Dalton, et al., 1980). These comments have been supported
by several other researchers (Garretson & Teel, 1982; Giacalone & Duhon, 1990;
Hilb, 1978; Lefkowitz & Katz, 1969). It is not difficult to imagine a scenario in Which an organization hires an employee who handles the job adequately
under the demands of the job or problems with the supervisor. If this person's
spouse is offered a job that requires relocation, the couple may decide to move; although they may have stayed if the employee had been satisfied and successful
in his/her job. In this case, the leaving employee can easily say that the reason
he/she is leaving is his/her spouse, when there is actually more to the situation
that he/ she does not wish to reveal to anyone in the organization.
There are several ways to reduce the problem of falsification in the exit
interview. The first wayan organization can enhance an employee's truthful
tendencies is to have someone who is not associated with the leaver's department
or management interview the employee, for instance the organization can use an
outside consultant (Lefkowitz & Katz, 1969). An employee may be afraid to be
honest with the department manager because of the need for future references
(Garretson & Teel, 1982; Giacalone & Duhon, 1990; Lefkowitz & Katz, 1969). In-house exit interviews tend to be deficient as compared to consultant exit
interviews in identifying dissatisfaction and conflict with management and in
identifying overall intensity of dissatisfaction (Hinrichs, 1975; Lefkowitz & Katz, 1969).
Another way to increase truthfulness is to ensure confidentiality and
anonymity. Some companies may not promise this because of the extra work
necessary, but it increases employee openness if they know nothing can be used
against their future (Smith & Kerr, 1953).
One issue of employee truthfulness on the exit interview that has not been
studied much (if at all) in the past is retirees' responses to the exit interview.
Historically, the exit interview has not been offered to retirees. However,
theoretically speaking, they may be more honest than employees who are
resigning. Retirees may not have the fear of getting poor recommendations in
that discussing the problems and giving suggestions to the organization they
have been a part of for a long time may benefit it in the future. Because they may
have a longer past with the organization than those resigning, doing something
beneficial for the organization (if they believe the exit interview will be used in a
beneficial way) may be more appealing to them. By including retirees in the
sample of people who participate in an exit interview, perhaps more accurate
and useful issues will be identified. There may however be a difference between
the type of response obtained from early retirees and late retirees. Early
retirement may be a manifestation of organizational withdrawal (Hanisch &
Hulin, 1990, 1991). While an employee retiring at an age that is older than the
mean retirement age may be a sign of job satisfaction.
Hypotheses
Given the previous literature review, the following results would be
expected:
• Pay satisfaction, co-worker satisfaction, work satisfaction, and supervisor
satisfaction should be higher in those who stay with the organization than
those who resign or retire.
• Health satisfaction should be higher, and health conditions should be better
in those resigning and their comparisons, than those retiring and their
comparisons (due to age).
• Those leaving should be less satisfied than those who are still employed with
the voice mechanisms available in the organization and less satisfied with job
characteristics.
Those who resign and retire should exhibit more work withdrawal behaviors
than those who stay, based on a progressive model of withdrawal (although this
METHOD
Subjects and Sample
Tenured and tenure-track faculty members at a large midwestern state
university were asked to complete a structured exit interview about their reasons
for leaving their job, work attitudes, withdrawal behaviors, and, where relevant,
retirement attitudes. The interviews were done in the 1994-1995 fiscal year, or
shortly before or after this time period. Two comparison groups of faculty,
employed by the University, also completed a structured interview with
questions that were the same or very similar as those leaving. One comparison
group was similar to those retiring, and one was similar to those resigning in
terms of department, sex, and age. The sample was comprised of 22 faculty who
resigned, 31 who retired, 29 employees that were similar to those resigning, and
29 employees that were similar to those retiring. (For each person that resigned
or retired, there was usually more than one person asked from the department to
be in the comparison group. So some leavers may have ended up with more
than one comparison individual participating, and some without any, if the
comparison individuals chose not to participate). The faculty that participated
represented a total of 33 different departments at the University. The total
sample included 82 males and 29 females. Eighty-eight percent were Caucasian.
The average age of individuals in this study was approximately 54 with a
standard deviation of 12.20. Most of those resigning were assistant professors
(67%), while most of those retiring were full professors (81 %). The participants
income on average was $62,644 with a standard deviation of $25,736.
Information about individual's age, tenure, and salary was obtained from
university personnel records to insure accuracy.
We have reason to believe that the leaving groups were comparable to
department, age, tenure (length of service) - which was more similar for the
retirees and their comparison group than the resigning group and their
comparison group, and gender. All of the comparison employees were chosen
from the same department, as those who were leaving. The average age for the
resigning group was 41.68, the resigning-comparison group was 42.66; the
average age for the retire group was 63.77 and the retire-comparison group was
62.48. The average years of service for the resigning group was 4.18; for the
resigning comparison group, it was 7.10; for the retirees it was 30.00; and for the
retire-comparison group, it was 30.45. Gender was coded as 1 =male and 2=female, so a mean of gender does not take numerical meaning, but it does show how similar the groups were by how close the numbers are. The mean for
gender of the resign group was 1.55, the mean for sex of the resign-comparison
group was 1.45, the retire group was 1.06, and the retire-compare group was
1.07.
Procedure
When employees informed the Provost Office of their resignation or
retirement, the research team sent the employees a letter to inform them of this
study and to request their participation in an exit interview. The letter was then
followed by a telephone call to set up a time for them to participate in the
interview. The interviews generally took place in the faculty member's office at
the time agreed upon by the interviewer and the faculty member. A member of
the department of the person leaving, who was still employed, was then chosen
(one who was as similar as possible to the leaving person on demographic
variables such as sex, race, age, years of service, and job title) to participate in an
interview. These employees were contacted and interviewed in the same manner
The data collection procedures were similar to the procedures used by
Hanisch and Hulin (1990, 1991) in their research with faculty and staff on
withdrawal behaviors.
Some of the participants who were resigning or retiring filled out a paper and
pencil version of the questionnaire if they were unable to schedule an interview
or if the researchers weren't notified soon enough before they left the University
to schedule an interview.
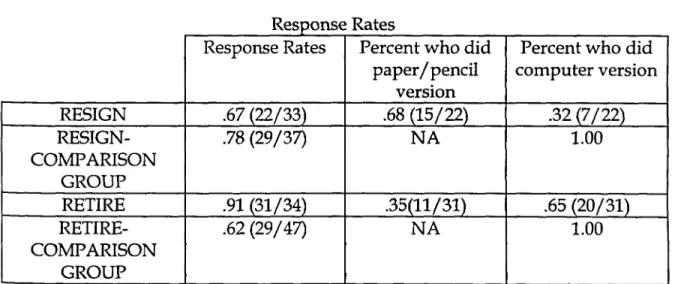
The response rates, by sample, are shown in Table 1.
Table 1
R esponse a es Rt
Response Rates Percent who did Percent who did
paper/pencil computer version
version
RESIGN .67 (22/33) .68 (15/22) .32 (7/22)
RESIGN- .78 (29/37) NA 1.00
COMPARISON GROUP
RETIRE .91 (31/34) .35(11/31) .65 (20/31)
RETIRE- .62 (29/47) NA 1.00
COMPARISON GROUP
The overall response rate was .75. Although the response rates did vary
between the groups, even the lowest group's response rate of .62 is still a
respectable response, and many of those who were unable to participate did not
outright refuse, but were out of town, or unable to be reached.
Although there was not enough information to figure the response rate of the
previous exit survey administered by the Provost's Office, only a handful
responded every year. The procedures used in this study represent an
The data were collected by trained graduate and undergraduate interviewers
using laptop computers. The interviewers met with the individuals at their
office, set up the computer, retrieved the questionnaire program from the disk,
and keyed in the individuals' identification numbers. The first part of the
interview consisted of open-ended questions, and in the second part of the
interview, participants read and answered the questions on the computer by
responding directly using the keyboard. During this time, the interviewer was in
the room away from the computer screen to insure privacy of response. The
interviews took between 30 minutes and two hours to complete.
The open-ended portion of the interview included such things as reason for
leaving, and if the individual was generally satisfied or dissatisfied. This information was typed into the computer by the interviewer.
Where necessary, a paper and pencil version of the survey was mailed to
faculty who could not be reached in person, were on vacation, didn't have time
because they were moving, or who left before the computer version was
completed and ready to be used. The paper and pencil version was the same as
the computer-based interview version, using the same questions and wording.
Table 1 shows how many individuals responded by paper and pencil and how
many participated in the interview. Those leaving (the retiring and the resigning
employees) were sent the paper and pencil version if they were unable to do the
interview because we were concerned that the sample size of these groups would
be very small if we did not try to reach them in this way. Because there was an unlimited pool of employees, they were not sent a survey version because
additional employees could likely be obtained (the sample size of those leaving
was predetermined and not within our control). To have enough data to increase
and retiring employees participate in the study, so the paper and pencil form
was used when necessary.
The Previous Suroey
The previous exit survey, presented in Appendix A, was sent to faculty who
voluntarily terminated their employment with the University. The previous
survey requested name and department was administered only to those
resigning, and completed surveys were sent to the Provost's Office. It was a pencil and paper questionnaire that was sent through campus mail or the
u.s.
postal service. It did not attempt to find many negative reasons for the termination, but appeared to look primarily at issues that were not under the
control of the University (e.g., location/ community). This survey and
administration procedures contained problems such as low response rate, lack of
confidentiality, and a lack of information about job satisfaction.
Changes to the Previous Suroey
This study improved the exit survey by increasing the response rate, adding
confidentiality, finding information about job satisfaction, and uncovering both
positive and negative reasons why faculty leave (resign and retire) the
University.
Confidentiality is an added dimension of the new survey because the
respondents were not asked to fill in their names, and they were assured that
their names would not be associated with their data. Employees may feel that it
is a threat to their future to say anything negative about their work experience or
their department with their name tied to it (Hinrichs, 1971). The research team
collected the data and have informed the Provost's Office of the trends and
Provost's Office will therefore not have access to individuals' data. This was
made clear to the participants, several of whom mentioned the importance of the
confidentiality, and after they were reassured of this aspect, proceeded to
provide sensitive information.
Reason for departure was assessed by an open ended question to keep from
restricting the employees' responses. The previous survey only offered
responses that appeared to be out of the control of the University (better job
elsewhere, personal, location/ community, change of careers, and other) except
employment terminated (see Appendix A). It did not attempt to elicit any
information about dissatisfaction with the job, department, department chair,
co-workers, organization, etc.
The item assessing the changes necessary to retain women and minorities (see
Appendix A) was generalized and asked of all employees completing the survey,
with additional response options. Having all employees complete all questions
allowed for assessing the retention needs and opinions of productive employees,
both those who were women or minorities and those who were not.
Items that were included from the previous survey in the current study were:
Future employment, employment search activity, encouraged to seek other
employment, actions taken to retain, actions which could have been taken to
retain, recommendations to the University, recommending the University to
other faculty, and other comments or observations.
Additions to the Previous Survey
The interview for those resigning/ retiring employees, shown in Appendix B,
was intended to find out what is causing the organizational withdrawal; to find
out why people are resigning and retiring. Appendix C shows the interview for
denominators as reasons for leaving, so an attempt to solve problems at the
University can be made. The interviews therefore focused on things that lead to
resigning and retiring to determine what had caused employees to engage in job
withdrawal. By identifying and then working to eliminate the source of the
problem (e.g., job dissatisfaction), we hope to eliminate the problem (withdrawal
behaviors, including dysfunctional turnover).
The Current Instrument
The interviews investigated specific components of job satisfaction. Work
satisfaction, co-worker satisfaction, pay satisfaction, supervisor satisfaction, and
health satisfaction as presented in a causal model by Hanisch and Hulin (1991)
were assessed. Work, pay and benefits, co-workers, and supervisor satisfaction
were measured by scales from the Job Descriptive Index aDI) (Smith, Kendall &
Hulin, 1969). The JDI is a standardized measure that has been demonstrated to
have high internal consistency and reliability and an acceptable level of
test-retest reliability (Kopelman, Rovenpor, & Millsap, 1992; Kinicki, Carson, &
Schriesheim, 1991; Hulin, 1968; Quinn & Kahn, 1967; Vroom, 1964;). It is also considered a valid measure (Hulin, 1968, Porter & Steers, 1973; Quinn & Kahn,
1967; Smith, Kendall, & Hulin, 1969; Vroom, 1964). The JDI co-worker
satisfaction scale is represented by the faculty satisfaction variable. The JDI work
satisfaction scale asks respondents to evaluate their satisfaction with the actual
tasks that they do on their job. The JDI pay satisfaction scale evaluates how
pleased participants are with the pay they receive from the University. The JDI
supervisor satisfaction scale is labeled as DEO satisfaction and represents
individuals' satisfaction or dissatisfaction with the department executive officer.
Health satisfaction was measured by a scale from the Retirement Descriptive
RDI health satisfaction scale is a measure of employees' perception of their
health. The health condition scale is a measure of participants' existent health
conditions.
Employees were also asked about their satisfaction with the amount and
quality of mechanisms available to them to voice their dissatisfactions, based on
the work of Spencer (1986) and Hirschman (1970,1974) (see Appendices Band C
for specific questions). There were three items in the questionnaire to assess
participants' feelings about their voice mechanisms, ways in which they can
make their dissatisfactions known and get something done about them.
However, the item that asked how effective their expressions of dissatisfaction
were, turned out to have a logical flaw, and the item that asked them how often
they actually voiced their dissatisfactions did not relate well with the item that
asked about their opportunity to express their dissatisfactions (r=.06). This left a
single item assessment of this concept (opportunity to express dissatisfaction),
which was not preferable, but was retained because of its importance to the
study.
The job characteristics scale was an experimental scale comprised of items on
job importance, job repetitiveness, job autonomy, job responsibility, and task
conflict (see appendices B and C for specific questions).
Questions about organizational withdrawal were also included to evaluate a
pattern of adaptive withdrawal responses correlating with the termination of
work. This included a range of what are considered organizationally
inappropriate work behaviors (Le., work withdrawal), such as lateness,
absenteeism, and using work time irresponsibly (Hanisch & Hulin, 1990, 1991). Questions were also included about behaviors that are positive and helpful to the
organization such as, volunteering to teach class for a colleague who was sick,
Performance measures used in the study include salary, average salary
increases, and average annual citations. Average annual percentage salary
increases were evaluated over the past eight years, or since the individual began
at the University, whichever was shorter. Average annual citations were looked
at for the past eight years, or since the person graduated with his/her Ph. D.,
which ever was shorter. Citations were found by looking up the individuals in
the Social Science Citation Index or the Science Citation Index. Percentage salary
increases were figured by using the personnel records to find the percent
RESULTS
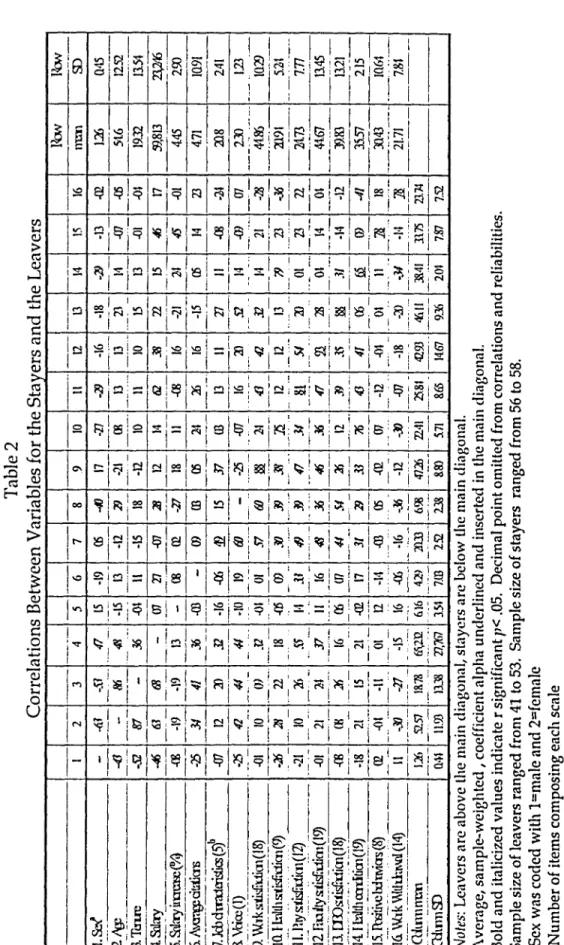
Correlations Among Scales
In the correlations shown in Table 2, the resign-comparison group and
retire-comparison group were combined to form a group labeled as stayers, and
the resigning and retiring employees were combined as the leavers. This
division into the two main groups represents the primary interests of this study,
namely retention of employees, and helps compensate for the small sample sizes
that make it difficult to generalize findings or detect statistical effects.
The JDI co-worker satisfaction (faculty satisfaction) scale had a reliability
of .93 and scores ranged from 0 to 57. The JDI work satisfaction scale had a scale
reliability of .88 and values ranged from 11 to 54. The JDI pay satisfaction scale
had a reliability of .84 and ranged from 6 to 36. The JDI supervisor (DEO)
satisfaction scale had a reliability of .88 and a range from 6 to 54. The RDI health
satisfaction scale had a reliability of .75, scores ranged from 5 to 27. The health
condition scale had a reliability of .65 and a range of 28 to 38. Positive behaviors
had a reliability of .78 and values ranged from 12 to 50. Withdrawal behaviors
also had a reliability of .78 and had a range of 14 to 55. The job characteristics
scale had a reliability of .49 and scores ranged from 14 to 25. The voice item
Similarities Between the Stayers and Leavers
Table 2 shows that there are many similarities and differences in the
relationships between variables across the two groups. The fact that there are
similarities suggests that there are some underlying relationships that are
consistent whether someone has left his/her job or not. Citation average and
salary both show a positive and in the case of the stayers, statistically significant
relationship (stayers r=.36, leavers r=.27). Salary also shows a significant,
positive relationship with pay satisfaction (stayers r=.55, leavers r=.62), and with
faculty satisfaction (stayers r=.37, leavers r=.38). There is a positive (and
significant for the stayers) relationship between citation average and pay
satisfaction for both stayers and leavers (stayers r=.33, leavers r=.26).
DEO satisfaction shows a positive, significant relationship with work
satisfaction (stayers r=.26, leavers r=.32), job characteristics (stayers r=.44, leavers
r=.27, p>.05), and voice (stayers r=.54, leavers r=.52) in both groups. Both groups
show a significant negative relationship between work withdrawal behaviors
and health condition (stayers r=-.34, leavers r=-.41), and between work
withdrawal behaviors and health satisfaction (stayers r=-.30, leavers r=-.36).
Differences Between the Stayers and Leavers
It is interesting to note that a t-test found significant differences (p<.05)
between the means of the two groups for salary increase, DEO satisfaction, and
health conditions, which is similar to the results produced by the ANOV A when
the entire sample was separated into four groups (i.e. resigning,
resigning-comparison, retiring, and retiring comparison groups).
The fact that there are differences in the two groups shows that there are
some relationships that, in this sample, are more pronounced for the leaving, and
The job characteristics scale shows positive significant relationships with
some of the satisfaction scales in the stayers that are not significant in the leavers: pay satisfaction-stayers r=.49, leavers r=.13; faculty satisfaction-stayers r=.48,
leavers r=.l1. The job characteristics variable also shows positive, significant
relationship in stayers with voice-stayers r=.60, leavers r=.lS; salary-stayers r=.32, leavers r=.-07; and health satisfaction--stayers r=.30, leavers r=.03.
Health satisfaction shows a larger, positive and significant relationship in
stayers with pay satisfaction, faculty satisfaction, and job characteristics than for
leavers: pay satisfaction-stayers r=.34, leavers r=.12; faculty satisfaction-stayers
r=.36, leavers r=.12, job characteristics-stayers r=.30, leavers r=.03 (as mentioned
above).
The voice item positively correlates (p<.OS) with all of the satisfaction
scales for the stayers, and for the leavers it has nonsignificant correlations for all
scales (except DEO satisfaction), and even small negative correlations for some:
work satisfaction-stayers r=.60, leavers r=-.2S; health satisfaction-stayers r=.39,
leavers r=-.07; pay satisfaction- stayers r=.39, leavers r=.16; faculty
satisfaction--stayers r=.36, leavers r=.20. The only satisfaction scale that this does not hold
true for is DEO satisfaction, where both groups show significant positive
correlations. Voice also showed a positive, significant relationship with health
condition (stayers r=.29, leavers r=.14) and job characteristics (as mentioned
above, stayers r=.60, leavers r=.lS) in the stayers.
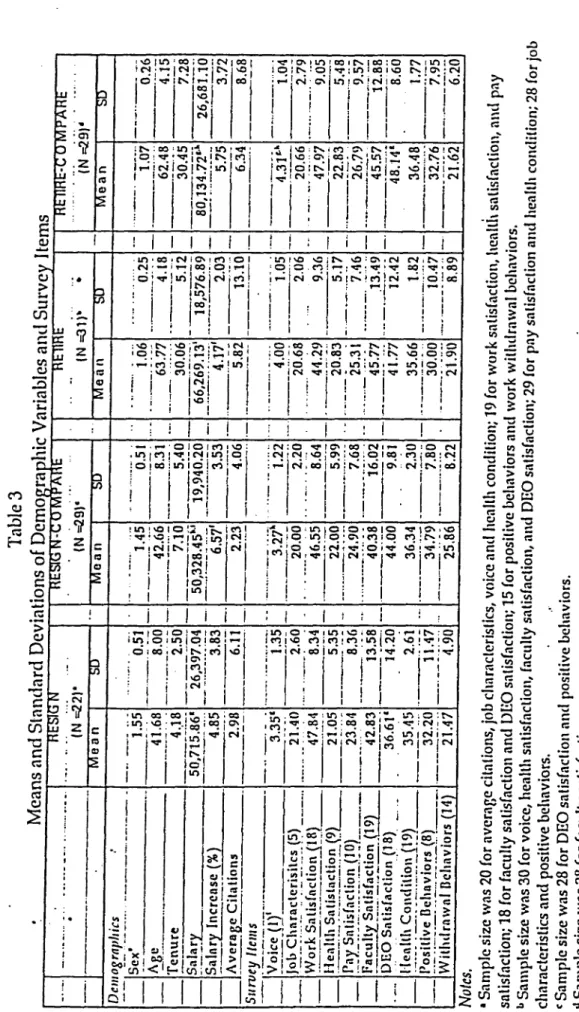
Means and Standard Deviations
The means and standard deviations of variables analyzed in the study
(demographics, voice, job characteristics, work satisfaction, health satisfaction,
pay satisfaction, faculty satisfaction, DEO satisfaction, health condition, positive
groups (retirees and their comparison group, and the resigning employees and
their comparison group). The samples were not combined at this point to
display all differences in the groups and to keep from masking any effects
resulting from differences that exist between groups.
The only variables that were found to be significantly different using a
one-way ANOVA, p < .05, were salary, salary increase, DEO satisfaction and
voice (see Table 3 for which specific groups were different). There were several
other variables that had noticeable differences (e.g., positive behaviors were
lower in both leaving groups relative to their comparison groups), however due
to the small sample sizes of the groups, the ANOV A did not detect them. Trends
in the data are noted below for the results in Table 3; future research with a
larger sample size is necessary to evaluate statistical significance.
Although they are not flawless measures, performance was assessed by
current salary, percent average salary increases, and citation average. The
resigning employees had more citations than their comparison group, however
the retirees did not have more than their comparison group. The resigning
employees earned slightly more salary than their comparison group, but again,
the retirees did not earn more than their comparison group. Both those resigning
and retiring were getting lower percent annual salary increases on average than
Table 3 Means Clnd Standard Deviations of Demo ra hie Variables and Survey Items
--...
;.
. ...
_..
.
. ...
\. ....
..
~~s~
21. (N~
91' IN : .... E 1-) .-.. -...i.-.,-I--rl-...
,...,RE ... 1 ...1~""~-,.:.C
....O....,M~P"1l'"~"'RE..---..
(N=291' __ .1 _________ · Mean SD Dell/og rfll'IJics--.
s~~·--_...
..---.--.
-..
--is5
0.5'1
.
.-.
-'''1.45'
·-....
-0.5
i .. . .. -_ ..i
.06
...
··0.25
..
-....
-...
-1".-07
--'-"-0.26 Age ... --41.68----·8.00 -.--·-.i'i.6·6
---'8:3i
...
-'-"-"63:77
'''-'''-4:18-'---6"2:48
'--4~j5 -'.~~~-;;-"---"--'4ja
--"-'-2.50
--'--7:-10
---'-'5'~40.-..
-..
---30:0'6
···--5.i2
----'30:45
7.28=:~~~iL-Ji_I!!.~~~~~i
=2.~J_?~']~
-=
~~!~3~~~~~i
=~~?_~~;~§
-=
__
~6.2~?:.W
~~_.!~J76:~?
=
B~!~~!~~:
2~,681~~
_.S_a_'n!y Jncrcll~~ (%) . __ 4:.~~ ___ 3_.~~ _. 6.57' ____ ~~~ ._ .. __ .~1.1: 2.03 5.75. ___ 3_.7_.2 _.~verl!ge CiI~tions . __ ..J.:.9~ ___ ~1_____
~~~___
4_.~~._ . ___ ~.:~~ ____ !.3.1~. ____ ~.~ ___ 8.:.6~ SII rvey lie III S'Voi~(ir"
-..
"3j5 i .----."--'1".35
---.. · ---..
· .. ·-ii
7
i. ...._.-1:22
...
-..
-....
4:00
.. ·-_
..
1:05---~jj~h -'''--'jj)-i -.---.. ---. .----... - ._---.-.. --. ---.. -. .-- ---·---1---· Job Chnrnclerisilcs (5) 21.40 2.60 20.00 2.20 20.68 2.06 20.66 2.79 =:~~l<'S;;~~~!~~~i~;Jt~)=:.--...
4!..:.~~...
-'--'
8:~~ ~. __
.
'-"4~:55 ~~~~~~:.~~_
...
__
~~:~?_
9.~~ ~ --" -··~7.9?._
...
·--"9.0~ _.~leal1~~~~.~~~~~.c.!!~!l_(?~ _.2!:~~__
. __
.~..
~~...
_ ...
_ .
...3~:~~___
._
..
~:??..
"'.'
__
~0.8~ __ ._ ... ~ .. ~7 _ ... ____ ~~~3 . __ .. _._ .. ~.~~ _.,~~y'_~~I!~f~~!!~.!~J~~L_.. _
.. __
. __
.~3.84 __ . __ .B:~~ ... _. ___ ~~.:~~ .. _. ___ .. ?:~8 ' ... _2~:~1 ... ____ . ~:.~~ __ ._. ___ ._~~9 ._. ____ .~:~Z _.f~cuIt1.~~~i~~~ionj19) ___ '!..2.:.B_~___
..!~.5~____
~~:~~__
16.~~ . _____ ~~_?? .... _._l~.:~?_
..
__
.~~~____
l~:~~ . __ ,oEOSatisfaclion(18) _._ . .36.61" . 14.2~ 44.00 ?~1 41.77 12.42 4B.14" 8.60 _,~!~_,,-I~I~?!~I.~!~~I~i~2) _____ ~~.~~ .. _._~'.~!....
__
._3.~:.~~ . ____ .~~~ __ .. _____ ~~:~6._ ...
__
..
_~:~?. _____
.
36:~.~. __ ._.t.:~? Positive Dehnviors (8) 32.20 11.47 34.79 7.80 30.00 10.47 32.76 7.95 --lw-iii;~f~~~'~ln;;,~~;j~~-s-(i14)'·----21:47
---'---4:9ii"
---·--is·.86
---..
i22·---·il~90 '--"---'8~89 ---'21~62 --"---"6j(jNoles. • Sample