1967
Development and comparison of some methods
for leaching saline soils
Helmy Mohammed Ahmed Bakr
Iowa State University
Follow this and additional works at:https://lib.dr.iastate.edu/rtd Part of theAgriculture Commons, and theSoil Science Commons
This Dissertation is brought to you for free and open access by the Iowa State University Capstones, Theses and Dissertations at Iowa State University Digital Repository. It has been accepted for inclusion in Retrospective Theses and Dissertations by an authorized administrator of Iowa State University Digital Repository. For more information, please [email protected].
Recommended Citation
Bakr, Helmy Mohammed Ahmed, "Development and comparison of some methods for leaching saline soils " (1967).Retrospective Theses and Dissertations. 3991.
This dissertation has been
microfilmed exactly as received 68-2799
BAKR, Helmy Mohammed Ahmed,
1930-DEVELOPMENT AND COMPARISON OF SOME METHODS FOR LEACHING SALINE SOILS.
Iowa State University, Ph.D., 1967 Agronomy
FOR LEACHING SALINE SOILS
by
Helmy Mohammed Ahmed Bakr
A Dissertation Submitted to the
Graduate Faculty in Partial Fulfillment of
The Requirements for the Degree of
DOCTOR OF PHILOSOPHY
Major Subject: Water Resources
Approved:
In Charge of Major Work
Hea^ of Major Department
Iowa State University Of Science and Technology
Ames, Iowa
1967 Signature was redacted for privacy.
Signature was redacted for privacy.
ii
TABLE OF CONTENTS
Page
INTRODUCTION ]_
General ]_
Adjustment 2
Leaching 3
Water and Salt Movement in Upper and Lower Egypt 4
Amount of Water Used for Leaching 6
Leaching Methods 6
Objective of Research 7
REVIEW OF LITERATURE 8
General 8
Some Aspects on Diffusion and Leaching 8
GENERAL DESCRIPTION OF EXPERIMENTS 20
Materials and Preparation of Soil Samples 21
Packing of Soil Columns 23
Measurement of Conductivity 24
PROCEDURES, RESULTS AND DISCUSSIONS 28
PROCEDURE FOR EXPERIMENT I 29
Salt Mixing by Diffusion 29
RESULTS AND DISCUSSION OF EXPERIMENT I 35
Salt Mixing by Diffusion 35
PROCEDURES FOR EXPERIMENT II 97
Leaching by Surface Water Application 97
RESULTS AND DISCUSSION OF EXPERIMENT IIa 101
RESULTS AND DISCUSSION OF EXPERIMENT lib 115
Intermittent Ponding of 4000 cc. (88 cm. Height) 115
RESULTS AND DISCUSSION OF EXPERIMENT lie 120
Intermittent Ponding of 2000 cc. (44 cm. Height) 120
RESULTS AND DISCUSSION OF EXPERIMENT IId 125
Intermittent Ponding of 1000 cc, (22 cm. Height) 125
RESULTS AND DISCUSSION OF EXPERIMENT He 130
Intermittent Ponding of 500 cc. (11 cm. Height) 130
RESULTS AND DISCUSSION OF EXPERIMENT Ilf 135
Intermittent Ponding of 200 cc. (4.4 cm. Height) 135
RESULTS AND DISCUSSION OF EXPERIMENT Ilg 140
Intermittent Ponding of 50 cc, (1.1 cm. Height) 140
COMPARISON OF RESULTS PROCEDURES a THROUGH g, OF
METHOD II 146
PROCEDURE FOR EXPERIMENT III 151
Upward Leaching With Surface Drainage Runoff 151
RESULTS AND DISCUSSION OF EXPERIMENT III 152
Upward Leaching With Surface Drainage Runoff 152
PROCEDURE FOR EXPERIMENT IV 158
Upward. Leaching With Gravity Drainage 158
RESULTS AND DISCUSSION OF EXPERIMENT IV 161
Upward. Leaching With Gravity Drainage 161
PROCEDURE FOR EXPERIMENT V 167
Leaching by Subirrigation to Bring Water Table Up to a Depth of 12,5 cm. From the Surface of
iv
RESULTS AND DISCUSSION OF EXPERIMENT V 170
Leaching by Subirrigation to Bring Water Table Up to a Depth of 12.5 cm. From the Surface of
25 cm. Long Columns 170
PROCEDURE FOR EXPERIMENT VI 173
Leaching by Subirrigation to Bring the Water Table Up to a Depth of 23 cm. in 25 cm. Long
Columns 173
RESULTS AND DISCUSSION OF EXPERIMENT VI 174
Leaching by Subirrigation to Bring the Water Table Up to a Depth of 23 cm, in 25 cm. Long
Columns 174
GENERAL DISCUSSION 177
Movement of Water in Soils 177
Spreading of Salts in Soil-Water System 180
What Happens to a Highly Permeable Soil Profile
After and. During Water Application? 181
Case of continuous-.ponding followed by
gravity drainage " 181
Case of intermittent ponding followed by
gravity drainage 183
Case of leaching upward with surface drainage 186
Case of leaching upward followed by gravity
drainage 187
Case of leaching by raising the water table
up to half the depth of sand, columns 188
Case of leaching by raising water table up to
2 cm, from the bottom of the sand column 189
Conclusions Regarding the Different Methods 189
V
SUMMARY AND CONCLUSIONS 191
The Six Methods of Leaching 191
Conclusions of the Respective Six Methods of
Leaching 194
Conclusions of Method I 194
Conclusions of Method. II 196
Conclusions of Methods III and IV 197
Conclusions of Methods V and VI 197
Final Word 198
BIBLIOGRAPHY 200
ACKNOWLEDGEMENTS 206
APPENDIX A 207
1
INTRODUCTION
General
The population of the world, as a whole is increasing. The
increase will be felt more and. more with the advance in medical
science and. hygiene. No permanent solution for regulating the
population in the world has been achieved.
One of the greatest tasks ahead of the future generation
will, therefore, be to find food for the increasing population
with the limited resources of land available. This will,
therefore, necessitate amongst other things reclamation of
agricultural land.
This is one side of the problem, the other side of it is
water. Someone has said: "Whether man drinks it, bathes in
it, removes his wastes by it, grows his food, and fiber through
it, meets his industrial needs with it regardless of how man
uses water — it is his most vital natural resource, a substance
for which there is no substitute," The demand for water is
steadily and. sharply increasing, due not only to the rise in
population but also to the increasing per capita consumption.
From the dawn of recorded history of mankind, people have
elected or have been compelled to move from places where water
was deficient in amount, inferior in quality, or erratic in
behavior. That is why in and. around, every river valley can
always be traced the growth of a particular form or system of
In short, life as we know it on this planet cannot exist
without water, A dependable source of water in a water-scarce
region must be conserved, developed and. effectively used with
out unnecessary waste. This naturally and perhaps inevitably,
leads to organized, planned activity in all fields of endeavor,
which is the basis of advanced civilization. The need, to in
crease efficiency in use of water is clearly evident.
In Egypt, the River Nile is the chief source of water.
The stringent natural limitations on the available land, and
water resources have made it imperative to rationalize their
use with a view to having the optimum product with the least
amount of water. On the whole, it is the amount of water
available and. not the lands with possible adaptation to agri
culture that limits the extent of and. scheme of development.
Adjustment
In many countries, such as India, Pakistan and. Egypt, the
system of irrigated agriculture has been known since ancient
times. Ancient systems now still in operation were mostly
built in flood plains and. deltas of the lower parts of rivers.
During several centuries of the operation of the ancient irri
gation systems large salty zones with highly fertile soils
have been formed, along large and. small irrigating canals.
First noticeable signs of the formation of these zones along
the irrigation canals are seen after the irrigation system has
3
tends to spread in old irrigation systems, but rather slowly.
The process of desalinization of the soils along the irrigation
canals depends on the influence of the filtrating water and the
local redistribution of salts. Soluble salts from soils,
subsoils and ground waters are replaced by local flows and
pushed aside to the lower lying areas, to the outer regions of
irrigation systems and to further parts of irrigated areas.
Stable and highly productive agriculture, with highly efficient
use of the soil, is possible in areas with ancient irrigation
systems without natural drainage, provided that they have a
well-developed and well-operated network of drainage canals.
Excessive salinization tends to deplete the agricultural
resources upon which the strength of any nation depends. That
is why we need to prevent salinization and to reclaim salinized
soils. The necessity for reclamation grows as the necessity
grows to produce more food and raw materials on salinized
areas, or on soils which are potentially subject to salinization.
Leaching
The process of leaching can be defined as the process of
dissolving and removal of soluble salts by the movement of
water through the soil in appropriate quantities and at ap
propriate times. Because salts move with water, salinity
depends directly on water management, i.e,, irrigation,
leaching, and drainage. These three aspects of water management
maximum efficiency is to be obtained. The process of leaching
also depends on the influence of the filtering water and the
local distribution of salts. Maximum water application ef
ficiency requires good water control equipment, proper land,
preparation, correct canal system designs, and proper management
of the system. This proper management requires increased under
standing of the fundamental mechanics of water movement of soil
leaching process, with which more accurate leaching — pre
diction techniques and improved, leaching control methods are
anticipated.
At present, vigorous attempts are made to increase leaching
efficiency, on the one side to avoid over leaching and. the subse
quent troubles as the subsequent rise of ground water table,
and on the other side to extend the reclaimed areas and. to
transform in this way as much water into agricultural products
and land, reclamation as possible. To attain the best results
it is necessary to depend, heavily on the experimental study and
on experience, and. in the event that computed results are at
variance with field experience, the equations should, probably
be considered less reliable than the field observations. A wise
approach to the problem is to modify the analytical approach to
make it agree with field experience.
Water and Salt Movement in Upper and Lower Egypt
Salinity problems in upper Egypt are different from those
5
contains some salts and is rising. In lower Egypt (below
Cairo) the water table often reaches the surface and is often
strongly saline. In both upper and. lower Egypt a large part of
the movement of salts is in connection with capillary action.
Surface tension in water and adhesive forces in the walls of
the capillary pores cause water to rise in soil pores. When
the water table is at great depth, evaporation in the upward
rising saline water occurs at great depth and the salt stays
behind it at great depths. In places that are undisturbed, by
flooding, as in areas of upper Egypt, and where the water table
is at considerable distance below the surface, soluble salts
tend to accumulate due to irrigation, at some distance beneath,
rather than at the surface of arid, soils. In all of Egypt the
rainfall is light, practically zero, and frequently so dis
tributed that the moisture penetrates only a small distance in
most soils. In upper Egypt much of the water that enters the
soil is needed by the plants growing upon it and. this water is
extracted some distance below the surface.
The fact that the water table is now at relatively great
depth (8 to 16 meters) in upper Egypt makes the salinity
problem of lesser importance than in lower Egypt where the water
table is often within a meter of the surface. In lower Egypt
the soil water with its salts easily rises the short distance
to the surface where evaporation causes the salts to remain
behind. These salts must be leached, out by excess irrigation
capillary action but very slowly. The salt effect will become
serious in upper Egypt only if the water table continues to
rise. In some places in upper Egypt the water table is rising
rapidly. Thirty years ago the writer's father pumped water
from a water table at 16 meters depth. The water table has now
(1967) risen to 12 meters depth.
Amount of Water Used for Leaching
Due to limited rainfall and water supply in many countries
including Egypt, the quantities of water used for leaching are
of great importance. In Egypt the rainfall is significant only
along the coastal region of the western desert where it amounts
to about 15-20 cms, per year. The rainfall breaks off sharply
to less than 2,5 cms, a few kilometers inland. The only other
water supply is the Nile River besides the underground water.
The quality of the Nile River water is excellent, low in salts
(200 p,p,m, soluble solids).
The amounts of water used for leaching vary considerably
from one locality to another. The differences in water use are
not only related to the severity of the problem of salinization
but also to the basic philosophy regarding the adequacy of
leaching.
Leaching Methods
The methods used for leaching in most countries of the
world are as follows :
7
2) Intermittent ponding
3) Ponding with a rice crop
4) Application of excess water during the irrigation of crops
Objectives of Research
The study reported in the following pages was conducted,
with the following objectives in mind:
la. To see how salt diffuses from soil into surface water
held at a steady depth. An objective here is to find out
whether it is better to leave water standing for some period on
saline soil while drains are "closed" than to have drains open
from start when leaching. By "closed" is meant that the outlet
ditches are not pumped out.
lb. To determine the effect of the time factor when
non-salty water is kept on the surface of presalinized soil. How
long should the water stand on the soil surface before subdrains
or drainage ditches are allowed to empty?
2a. To investigate several other methods of leaching
hoping to find out better processes of leaching than are now
used,
2b, To improve the leaching efficiency for economical use
of water. In other words to find, out more intelligent appli
cation of the water to the land with the utilization of the
combination of the water, soil and. climate to the best ad
vantage, that is to obtain the maximum returns from the amount
REVIEW OF LITERATURE
General
Reclamation and. leaching were known and. applied at the
dawn of history. It will be seen later that leaching is a
broad science drawing on many related fields as basic sciences
for many of its data and much of its theory. Its study is not
only a question of pure mathematics, but also of experimental
science. In the past years many papers have been published
dealing with the broad, problem of leaching and the diffusion of
salts. Because of the large number of publications and the
shift in the approach utilized, the author has tried to keep
this review limited to those publications that appeared to be
the most pertinent and up to date.
Some Aspects on Diffusion and Leaching
Hissink (1907) carried out in his laboratory some leaching
experiments with saline soils trying to prevent or to reduce
the deterioration of the structure of soils. Before Hissink,
Slichter (1904) attempted to follow groundwater movement
through aquifers using salt as a tracer. He observed that a
general dispersion or spreading of salt took place from the
point of injection which he accounted for by flow velocity
distribution in the pores.
Later, Sigmond (1924) described different methods of
reclamation dividing them into four groups according to their
9
1) Physical reclamation methods,
2) Methods of removing alkali,
3) Chemical methods of reclamation, and
4) Biological methods of reclamation.
In the report of the U.S. National Resources Committee,
Scoffield and Hill (1938) proposed a formula for what was called
"service equivalence", in which the concentration of the
drainage water and the concentration of the irrigation water
are taken into account. In addition to the salt removed through
drainage, it is inherent with this formula that soluble salt is
removed from the soil at a rate equal to the consumptive use of
water times half the concentration of the irrigation water.
Carman (1948) indicated that the permeability of a medium
to water or any other fluid under the action of a pressure
difference may arise in various ways :
1) The fluid may dissolve and be transported by diffusion
along a concentration gradient produced by the pressure
difference,
2) In a porous medium the fluid may be absorbed, at the
internal walls of the capillary structure and be transported by
diffusion along a concentration gradient,
3) The fluid may flow through capillaries of a porous
medium at a rate limited merely by its viscosity.
Almost one year after Carman, Glueckauf (1949) developed,
his theory, assuming that at the boundary between leaching
the diffuse boundary is caused by ionic or molecular diffusion.
According to Glueckauf the disturbing factors operating in
actual soil columns may be caused by the following factors:
finite grain size, diffusion in the liquid between the grains,
and nonequilibrium conditions,
A soil moisture law was proposed, by Richards (1950) which
he called the "outflow law". The law states that water will
not flow out of the soil unless the soil water is at a pressure
greater than atmospheric,
A further contribution to this subject, according to the
U,S, Salinity Handbook (1954, p, 37), was made at the Irrigation
Conference sponsored by the Texas Agricultural Experiment
Station at Ysleta, Texas, in July, 1951, At this conference,
F, M, Eaton proposed what he called a "drainage formula" for
calculating the fraction of the irrigation water to be used, for
leaching. The U.S. Salinity Laboratory staff (1954) has a
mimeographed paper entitled "Formulas for estimating drainage
and gypsum requirements for irrigation waters" in which the
base for the Ysleta formula are presented.
The mixing process of salts into soil water was studied by
Danel (1953), who showed that as water flows between and. around
soil particles it mixes with the surrounding water and each
small volume of water thus loses its identity.
It seemed apparent to Yuhara (1954), as he concluded that
it was eddy diffusion rather than molecular diffusion that was
11
Rifai, Kaufman, and. Todd (1956) did an experiment involving
fluid flow through sands under laboratory conditions. It seemed,
to them that dispersion could be caused, completely by flow ve
locity distributions. Low (1955) developed an equation relating
the hydraulic and osmotic pressure gradients to the rate of
diffusion of water. His equation shows that the osmotic
pressure acts as a negative hydraulic pressure in its influence
on water diffusion. The equation was tested for clay sus
pensions and shown to be valid,
Richards, et al,, (1956) observed that the soil solution
of an irrigated soil was less saline than the irrigation water
with which it had been wetted. The salinity of this soil so
lution decreased, greatly as the soil drained to lower moisture
levels, except for the surface where some salts accumulated, due
to evaporation. They attributed this marked lowering of salt
concentration in the soil solution to negative adsorption effects
which became progressively more intense at lower moisture
levels.
Day (1956) reported that the dispersion of salt may occur
at a much greater rate than can be expected by ion diffusion.
The effect has been attributed to a mechanism referred to as
hydrodynamic dispersion, a general phenomenon arising from the
fact that the velocity of the moving stream through saturated.
sand varies from point to point in the porous system. Then he
concluded that diffusion must occur whenever a sharp concen
hydrodynamic dispersion mechanism brings close together the
"particles" of fluid originating in different parts of the flow
system and intersperses them, it does not completely mix them
because the streamlines never intersect. The final stage of
mixing must depend upon ionic and molecular diffusion, which
will become most effective when two streamlines carrying liquid,
of different chemical composition come close together.
Kaufman and Or lob (1956) indicated, that the degree of front
dispersion or dilution along the axis of flow may be considered
as a function of several individual phenomena, as follows:
1) Gross or macroscopic variations in permeability may
result in channeling of "fingering", causing very rapid, travel
of portions of the tracer front, while other portions of the
front may actually be retarded. Such fingering may be either
longitudinal or transverse to the major direction of flow,
2) Minute, or microscopic variations in permeability,
resulting from the differing diameters of adjacent pores, will
cause velocity differences from pore to pore and. increase the
length of the front,
3) Velocity distribution within a single capillary will
cause further longitudinal dispersion with additional
lengthening of the front.
4) Molecular diffusion in the direction of flow is proba
bly of relatively small significance except in cases where the
actual linear flow rate is extremely small. However, diffusion
13
to determine the characteristics of the tracer front.
5) The presence of cavities connected to pores by small
channels may help the interception and retention of some fluid
causing diffusion.
About the same time, Van der Molen (1956) used Glueckauf's
theory of chromatography to obtain theoretical curves which
showed general agreement with data taken during the désalini
sation of Dutch soils subsequent to innundation by sea water.
Gardner and Brooks (1957) conducted experiments in the
laboratory which indicated, that at the flow rates which normally
occur during the leaching of soils, the equilibrium condition
is probably too slow to be of great significance. They re
ported that if a saline soil solution is displaced by fresh
water, some of the saline water is bypassed and. mixing occurs.
As the flow continues, the mixing with the initially bypassed
solution continues and. leaching is accomplished. In other
words, soil leaching processes are dominated by dispersion.
They proposed equations in which it is assumed, the flow process
is responsible for the diffuse boundary between the soil so
lution and. the leaching water and for the subsequent removal of
the initially bypassed, salt. They obtained satisfactory
agreement between their theoretical equations and laboratory
field data.
Gerald and Radhakrishne (1958) presented a paper on hy
draulic characteristics of porous media. Their study indicated
materials may produce up to 15 percent reduction in effective
porosity. In more heterogeneous natural media the isolation of
pore volume by entrapped air would be even more pronounced.
Variations in the time of flow or in the volume displacement
may be partially accounted for by changes in the effective
porosity because of air accumulation.
Working with larger flow velocities Handy (1959) concluded
that ionic diffusion may be disregarded in its effect on tracer
distributions within water saturated sands. In contrast to the
above, Berg and Thomas (1959) measuring ion concentrations in
column eluates consider diffusion to be the principal cause of
dispersion, thereby entirely neglecting the effects of flow
velocity distribution. Their results clearly indicate, however,
that the amount of anion adsorption depends upon the chemical
and mineralogical characteristics of the soil.
One year later Saffman (1959) published a theory of dis
persion in a porous media. When a viscous fluid flows through
the pores a material quantity carried by the fluid which is a
substance in solution or heat is dispersed by: 1) molecular
diffusion and 2) convective diffusion or mechanical diffusion.
The latter effect arises from the irregular pattern of the
streamlines through the voids, and the consequent tendency for
fluid elements which are originally close together is to sepa
rate, This is actually similar to turbulent diffusion, the
difference is the irregularity of the streamlines through the
15
it.
Jost (1960) found that diffusion coefficients depends upon
concentration while Letey and Klute (1960) reported in the same
year the importance of these coefficients when diffusion takes
place in porous materials.
Another theory of dispersion in porous media is that of
Scheidegger (1955, 1961), He agrees with Saffman that com
plexity of the pore system is the cause of individual fluid
elements to be mixed with each other. This is the process of
dispersion which is distinguished from diffusion which is
caused by the intrinsic motion of the molecules. The dispersion
or miscible displacement phenomenon depends upon the geometry
of the pore-grain system of the porous medium,
Wilson, Luthin, and Biggar (1961) made studies that in
volved comparisons between: a) continuous ponding and inter
mittent ponding, b) continuous ponding and. intermittent
sprinkling and c) continuous ponding and. intermittent rainfall.
In each study the slow movement of water at the lower levels of
saturation achieved by intermittent ponding, sprinkling, or
rainfall resulted, in significantly higher leaching efficiencies,
i,e,, removal of more salt per unit of applied water,
Dutt and Low (1962) found that the apparent diffusion coef
ficients for steady state diffusion of NaCl decreased, with in
creasing salt concentration. They related the decrease to a
salt-induced change in the fractions of cations and. anions in
In agreement with Scheideger, Saddler, Taylor, Willardson,
and J. Keller (1965) carried on a field experiment on leaching
salt from soil. They reported that the individual elements of
the moving liquid are continuously changing direction owing to
collisions with the pore walls. This erratic flow causes indi
vidual fluid elements to be mixed with each other. The tortu
osity of the channels in the porous media complicates severely
the passage of the fluid through the media. They concluded
that the hydrodynamic dispersion and the ionic diffusion both
contributed salt to the effluent that was measured and analyzed
during this field experiment on leaching of salt from soil.
They also concluded that diffusion was of increasing importance
with time and that it was also of increasing importance in
removing salt from soil more distant from the drain, Israelsen
and Hansen (1962) indicated that the amount of excess water
that must pass through the root zone has been thought to be
dependent only on the crop being grown and on the quality of
the irrigation water.
Nielsen and Biggar (1961, 1962, 1963, 1964) worked ex
tensively with miscible displacement in soils. Their studies
indicate that miscible displacement results in a concentration
distribution which depends upon microscopic flow velocities,
diffusion rates, and other chemical processes. Owing to the
magnitudes of convection, diffusion and the chemical processes
which occur in different pore sequences, the paths of each
17
concentration or activity gradients of salts in aqueous so
lutions responsible for transfer by diffusion guarantees that
the displacing and the displaced, solutions do not generally
have identical densities or viscosities. The differences in
densities provide unbalanced, forces and. the differences in
viscosities provide unequal drag forces. Furthermore, the
presence of external force fields as a result of charges are
recognized. These force fields responsible for absorption,
adsorption, and exchange are also responsible for modifying
both the density and the viscosity of the solutions. In brief
Nielsen and Biggar showed that not only the flow velocity
distribution but also diffusional effects, especially at small
average flow velocities, are responsible for the mixing
processes.
In another paper of Nielsen and Biggar they pointed out
that the contribution of diffusion to the spreading of the
moving front might be expected to increase as the velocity is
decreased. Because the total number of contacts between aggre
gates decreases with increasing aggregate size, mixing becomes
less complete and the effluent concentration is dominated by
flow through the large pores. Nielsen and Biggar provided
evidence that the degree of saturation and the rate of water
movement affect the transport of salts through the soil. Their
studies made on soil columns in the laboratory showed that
small reductions in soil water content during leaching in
Furthermore, displacement of the soil solutions was signifi
cantly different whenever the average flow velocity differed by
several magnitudes,
Nielsen and Biggar (1962) tested the differential equation
developed by Lapidus and Amundson (1952) which describes solute
movement by molecular diffusion and velocity through porous ma
terial, They found general agreement between theoretical
curves tabulated, with this equation and actual displacement of
CI under different water contents and velocities,
A recent study by Carlson (1965) was made to determine the
hydraulic action of tile drains in removing saline ground
water. He constructed, a model with a two foot depth of porous
medium from the soil surface to a barrier» The two foot depth
was to simulate an actual depth of 80 feet of porous medium in
the field. Corresponding to field conditions the drains were
at eight foot depths, 315, 630 and 1260 foot spacings, A one
foot thick layer in the model of fine sand corresponded to 60
feet of fairly permeable surface soil in the field; and a one
foot thick layer of course sand below the fine sand corresponded
to material about 50 times (see page 17 and 19 of Carlson) more
permeable than the upper material. Eight tests were made with
different methods and rates of applying surface irrigation
leaching water flowing into the upper aquifer and a continuous
flow of drainage water from the drain(s). The lower aquifer
(and. in some tests the upper aquifer also) was charged with
19
cases discharged salt water with a maximiim concentration that
varied from about two-thirds to three-fourths of the salt
concentration of the lower part of the aquifer, Carlson's
results show that only after saline water is flushed from the
aquifer to the extent that a stable interface is formed between
the moving fresh water and the remaining stagnant salt water
that fresh water will be discharged from the drains. He shows
that a stable interface will always form eventually. The po
sition of this stable interface will depend on the steady rate
of surface leaching and the position of the drains. The po
sition of the stable interface depends also on the difference
GENERAL DESCRIPTION OF EXPERIMENTS
The goal is to determine the amount of water required to
remove the most salt per unit of applied water. Several porous
media were leached: Ida silt loam (loess), Clayton sand^ and
glass beads. In all cases the concentration of salt in the
leaching water was determined by an electrical conductivity
measurement with a solubridge (model RD-15),
Six methods of experiments for leaching were used. They
may be described as follows:
Experiment I, Surface standing of water followed by gravity
drainage (drains initially were kept closed).
In this experiment salt mixing by diffusion
was studied.
Experiment II. Surface leaching of different quantities of
applied distilled surface water, keeping a
head of 0-10 cm. during application, with
amounts of leaching water as follows being
applied:
a, 6000 cc. equivalent to 132,33 cm, height or more,
b, 4000 cc. equivalent to 88,22 cm, height,
c, 2000 cc. equivalent to 44.11 cm. height,
d, 1000 cc, equivalent to 22.05 cm, height,
e, 500 cc, equivalent to 11,028 cm, height,
f, 200 cc, equivalent to 4,41 cm. height and
21
g, 50 cc, equivalent to 1,1 cm, height.
Experiment III, Leaching of water upward through the soil by
subirrigation of distilled water applied under
pressure, followed by surface drainage.
Experiment IV, Leaching of water upward through the soil by
subirrigation of distilled water applied under
pressure to create a ponded water condition
followed by gravity drainage.
Experiment V, Leaching water was added by subirrigation to
bring the water table up to a depth of 12,5
cm,, for a soil column of 25 cm, length. The
water was then permitted to stand until the
capillary water rose to the soil surface
followed then by gravity drainage.
Experiment VI, Same as V except that the water table was kept
2 cm. above the bottom of the column.
Materials and. Preparation of Soil Samples
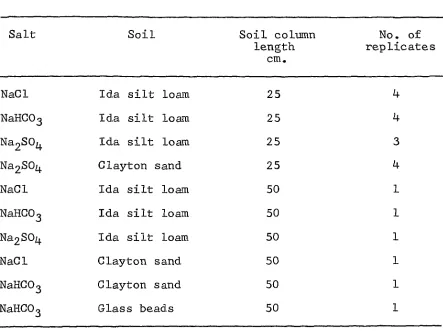
Soils for Experiment I are shown in Table 1, For the rest
of the experiments only Clayton sand was used. This sand con
tains 22,4 percent sand and. 0,60 percent clay and is similar to
an irrigated sand, in Egypt, Salts were sodium chloride, sodium
bicharbonate and sodium sulfate. In all experiments these
salts were mixed in the soil at a rate of 5 grams of salt per
hundred, grams of the sample soil. The reason for choosing this
high percentage of salts is that some layers were found to con
Table 1, Soil samples and. salts used in diffusion and leaching experiment
Salt Soil Soil column
length cm.
No. of replicates
NaCl Ida silt loam 25 4
NaHCOg Ida silt loam 25 4
Na2S0^ Ida silt loam 25 3
Na2S0^ Clayton sand 25 4
NaCl Ida silt loam 50 1
NaHGOj Ida silt loam 50 1
Na2S0^ Ida silt loam 50 1
NaCl Clayton sand. 50 1
NaHGOg Clayton sand 50 1
NaHGOg Glass beads 50 1
profile 1 in the Sacramento Valley (see Janitzky and Whittig,
1964. p. 254), To get this 5 percent by weight concentration
of salt in the soils a salt solution—enough to oversaturate
the soil—was prepared, and mixed, into the samples to make a
paste. This paste was then spread, in 1 cm. layers and. allowed,
to air-dry with stirring so that aggregates were formed and. the
salt would, be uniformly mixed, in the soil. This soil sample
was taken, screened through a 2 mm. sieve, mixed well and
[image:29.591.88.531.123.454.2]23
centimeters length. The dimensions of the cylinders are as
follows :
For the 25 centimeters soil col-umns:
Internal diameter of cylinder = 7,6 cm.
External diameter of cylinder = 8,2 cm.
Length of cylinder = 38,0 cm.
Cross section = 45,3416 cm^.
For the 50 centimeters soil columns:
Internal diameter of cylinder = 5,5" = 13,475 cm.
External diameter of cylinder = 6,0" = 15,24 cm.
Length of cylinder = 30,0" = 76,20 cm.
Packing of Soil Columns
In packing the 25 centimeters columns, a cup full of soil
was put in each cylinder and the cylinder given four taps on
each of its four sides. Then another cup full was added to
each cylinder, the soil was stirred with a long rod to mix with
former soil, and the cylinder was given another four taps.
This was continued until 25 centimeters of soil was in each
column. By the manner of packing the cylinders, the soil which
was originally put in received more taps than the soil which
went in at the top. Therefore, the columns were somewhat more
densily packed at the bottom than at the top, but all columns
were the same.
In packing the 50 centimeter columns a 3 cm, diameter
funnel until the thin 3 cm, cylinder was full. The 3 cm.
diameter cylinder was then lifted and moved slowly in the big
cylinder to form a thin layer of soil, then filled again with
soil using the funnel and the process repeated until a 50 cm,
soil length was obtained.
Measurement of Conductivity
The electrical conductivity of the soluble salts is de
termined by measuring the electrical resistance of solution.
The electrical resistance measurements can be made quickly and
accurately and has long been used for estimating soluble salt
content of soil waters. However, electrical conductance, which
is the reciprocal of resistance, is more suitable for salinity
measurements because conductance increases with salt content.
Figure 1 shows the type of conductivity bridge probe used in
this study. The results obtained from the probe and bridge are
expressed in terms of specific conductance (also called conduc
tivity). The readings are (since the flow lines. Figure 1, are
essentially all inside the probe) independent of the size and
shape of the sample into which the probe is inserted. When the
probe is immersed into the solution, the bridge scale reads
directly from zero to 10,00 millimho cm,"^. The bridge is
operated by alternating current and makes use of a cathode ray
tube null indicator. When the temperature of the solution is
set on a temperature-compensating dial, the main dial, at
INSULATION
SOLUTION
LINES OF
ELECTRIC
CURRENT
FLOW
27
The author chose the unit millimho cm.-l because it gives
a more convenient location of the decimal point than the
standard unit for conductivity, mho cm.~^. The bridge was
calibrated for each of the salts used (NaCl, NaHGO^ and NagSO^)
to convert the measured conductivities to grams of salt per
liter or to parts per million as shown later in Appendix B
(Table 64 and Figure 60).
At the beginning of each series of measurements of the
conductivity, a check measurement was made in a standard so
lution, (Potassium chloride solution, 0.01 N made by dissolving
of 0.7456 gm. of dry potassium chloride in water to yield 1
liter of solution.) This standard reference solution has an
electrical conductivity of 1.4118 millimhos cm,~^ at 20°G, The
PROCEDURES, RESULTS AND DISCUSSIONS
In the interest of brevity the different procedures with
results and a brief discussion will now be presented following
the wisdom that one figure is worth ten thousand words. Later
a general discussion will be presented when the results of the
29
PROCEDURE FOR EXPERIMENT I
Salt Mixing by Diffusion
In Experiment I where leaching water stands on the surface
of soil with no drainage allowed before at least 120 days, the
procedure differs for 25 cm. long and 50 cm. long soil columns.
For 25 cm, long columns water was added to the surface of the
soil rapidly to obtain a surface depth of water of 12,5 cm. and
the water was then added in weekly increments as needed (7.5 cm,
total in 70 days) to maintain this 12,5 cm, depth. Whereas for
50 cm. long column, a certain amount of water was applied, to
the surface and no more added. The field situation corre
sponding to these 25 cm. long and 50 cm. long columns is indi
cated in Figure 2 and. the laboratory situation in Figure 3,
For the 25 cm. long soil columns it was not necessary to add
additional water after 70 days, as the soil (the drains were
closed at the bottom) would take none.
In initially wetting the salinized air dry soil aggre
gates, the bottom of a tube coming out of the soil column as
illustrated in the right side of Figure 3 was open so that a
wetting front could go down the soil and let soil air go into
the atmosphere. In the field case this will correspond to air
going into field drains which will be open. After the water
had reached, the bottom of the column the opening there was
clamped as shown on the right of Figure 3, The conductivity
APPLIED STANDING SURFACE WATER
DITCH BANK
DITCH WATER
V / /
_ / \ — —
))
SALINIZED SOIL
/ /
— — — .DRAIN TUBE
\\
O O / /
///yz/y/X/
/%/%<///
IMPERMEABLE SOIL
Co
APPLIED STANDING
/ SURFACE WATER \
PLASTIC COVER
WITH PIN HOLE
-TO PREVENT
EVAPORATION
I2.5CM.
I2.5CM.
2.5 CM.
COLUMN OF
SALINIZED
SOIL
COLUMN OF
SALINIZED
SOIL
25or50CM
25 or 50 CM
75 CM.
CLAMR
3 at the right shows three points at which the bottom edge of
the probe was located while the readings of the solu-bridge
were taken. One point (P]_) is just at the soil surface,
another point (P2) is 2,5 centimeters above the soil surface or
as mentioned later, and the third (P3) is at the middle of the
surface water. The third reading was taken after the surface
water had been stirred to make the salt concentration the same
35
RESULTS AND DISCUSSION OF EXPERIMENT I
Salt Mixing by Diffusion
In Experiment I the results, Figures 4-30, show that water
standing on the surface of presalinized soil will pick up salt
from the soil. This salted surface water will then carry down
this salt solution plus additional salt picked up in the soil
column as the surface water flows through the soil into a
drainage outlet. But in Experiment I, the results showed
practically no movement of leaching water through the soil
profile. The sodium salts in the porous media had apparently
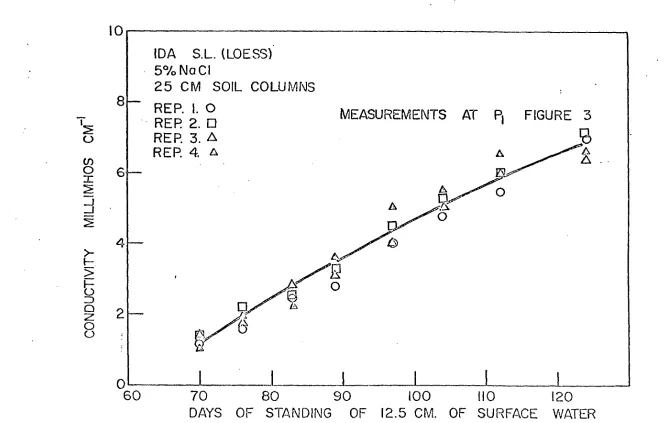
reduced the hydraulic conductivity to essentially zero. Figure
4 shows a plot of conductivity of the surface water made at
point in Figure 3 versus days of standing of the soil
surface water. The soil is Ida silt loam (loess) treated with
sodium chloride at the five percent level. The figure shows
that the salt concentration builds up in the surface water,
with the electrical conductivity rising from zero to 7,4
millimhos cm,~^ in 124 days. Figures 5 and 6 are the same as
Figure 4 except that the measurements of the conductivity are
made 2,5 centimeters above the soil surface (point P2, Figure
3) and at the middle of the surface water (point P3) after the
water had been stirred. The conductivity was always higher in
the middle after stirring than that just above the soil surface
(with no stirring), while the latter was always higher than
IDA
S.L. (LOESS)
5% No CI
25 CM SOIL COLUMNS
REP. i. O
RER 2. •
RER 3. A
RER 4. A
MEASUREMENTS AT
A
A
Pl
A
o
FIGURE 3
k .
\
1
1
o
1
1
1
60
70
80
90
100
110
120
[image:44.825.79.747.79.502.2]10
8
4
0
IDA S.L (LOESS)
57oNaCI
25 CM SOIL COLUMNS
RER I O
RER 2 •
RER 3 A
RER 4 . A
J.
MEASUREMENTS AT Pg FIGURE 3
1
60
70
80
90
100
110
120
the central depth of the surface water after it has been stirred (point Po, Figure 3)« From days 0 to 70 water was added in weekly increments (total 7*5 cm* in 70 days) to the soil as needed to maintain the 12,5
IDA S.L. (LOESS)
5 % N c C I .25
CM. SOIL COL
RER I. O
REP 2.0
REP. 3. A
RER 4. A
PERIOD OF
ADDING OF
" DIST!LL[:D
WATER
• A
K^EASURB/ÎENTS AT [Z.
WITH
STIF^RINS FIGURE 3.
r
A y ^/•-C)
y
' A
n/
o
o
A - / . —"
Li
A
rv
GO 00 100 120
SOIL COLUIviixfC
CO
coNDUCTivrry P.Af
_l
CO:
OIL
>
o Z) o
o
oGO
(L/iANC'iNG OF 12.5
80
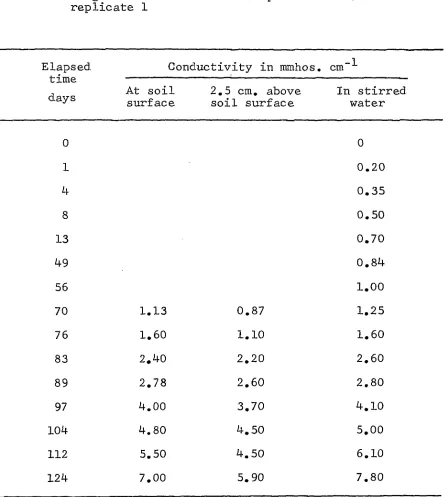
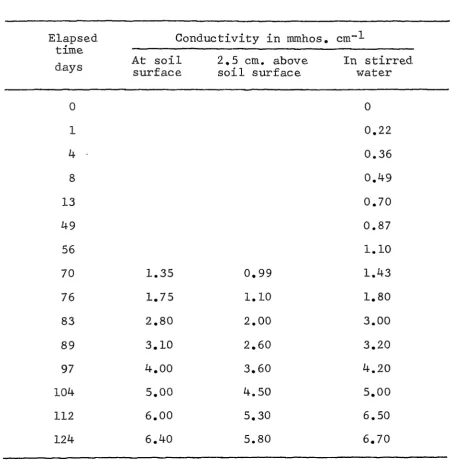
100Table 2, Conductivities of surface water standing on a 25 cm. long column of salinized. (5 percent NaCl) Ida soil replicate 1
Elapsed. Conductivity in mmhos, cm~^ time
J At soil 2,5 cm, above In stirred,
ays surface soil surface water
0 1 4 8 13 49 56
70 1.13
76 1.60
83 2,40
8 9 2.78
97 4,00
104 4.80
112 5.50
124 7.00
0 . 2 0
0.35
0.50
0.70
0.84
1.00
0.87 1.25
1.10 1.60
2.20 2.60
2.60 2.80
3.70 4.10
4.50 5.00
4.50 6.10
[image:51.591.88.532.115.612.2]45
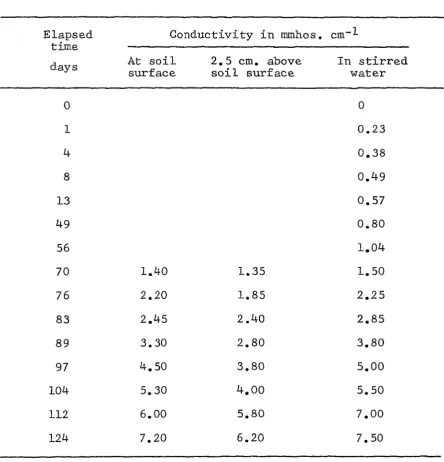
Table 3. Conductivities long column of replicate 2
of surface water standing on a 25 cm. salinized (5 percent NaCl) Ida soil
Elapsed time
days
Conductivity in mmhos. cm~^ Elapsed
time
days At soil
surface
2.5 cm. above soil surface
In stirred water
0 0
1 0.23
4 0.38
8 0.49
13 0.57
4 9 0.80
56 1.04
70 1.40 1.35 1.50
76 2.20 1.85 2.25
83 2.45 2.40 2.85
8 9 3.30 2.80 3.80
97 4.50 3.80 5.00
104 5.30 4.00 5.50
112 6.00 5.80 7.00
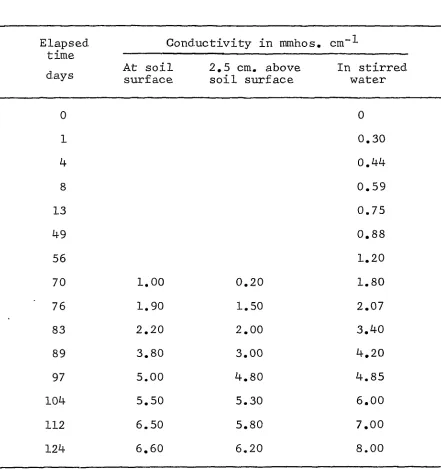
[image:52.582.80.525.140.603.2]Table 4, Conductivities of surface water standing on a 25 cm. long column of salinized (5 percent NaCl) Ida soil replicate 3
Elapsed Conductivity in mmhos. cm~^
time
, At soil 2,5 cm, above In stirred
surface soil surface water
0 0
1 0.22
4 ~ 0.36
8 0.49
13 0.70
49 0.87
56 1.10
70 1.35 0,99 1.43
76 1.75 1.10 1.80
8 3 2.80 2.00 3.00
8 9 3.10 2 . 6 0 3.20
97 4.00 3.60 4.20
104 5,00 4.50 5.00
112 6,00 5.30 6.50
[image:53.587.79.531.139.602.2]47
Table 5, Conductivities of surface water standing on a 25 cm. long column of salinized (5 percent NaCl) Ida soil replicate 4
Elapsed Conductivity in mmhos, cm~^
time
At soil 2,5 cm. above In stirred
days surface soil surface water
0 0
1 0.30
4 0.44
8 0.59
13 0.75
49 0.88
56 1.20
70 1.00 0.20 1.80
76 1.90 1.50 2.07
83 2.20 2.00 3,40
8 9 3.80 3.00 4,20
97 5.00 4.80 4.85
104 5.50 5.30 6.00
112 6.50 5.80 7.00
[image:54.586.84.525.132.601.2]shown in Figure 7.
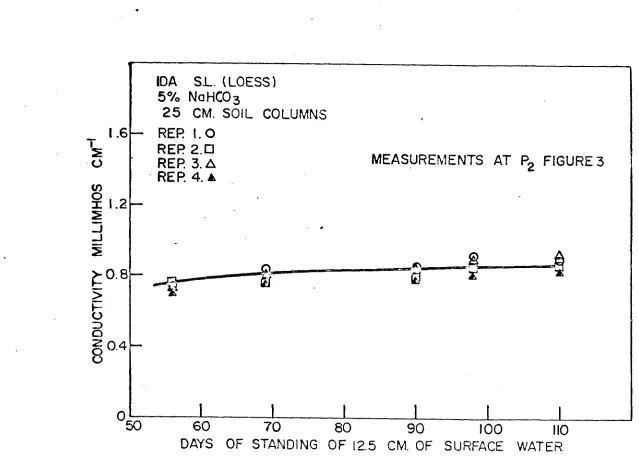
In Figures 6 and 7 the curves are rather flat in the
period of distilled water addition. The curves gradually go
up for the rest of the elapsed time.
Tables 2-5 contain data plotted on Figures 6 and 7, For
additional similar tables see Appendix A.
Figures 8-11 are the same as Figures 5-7 except that the
soil is salinized with sodium bicarbonate instead of the sodium
chloride.
Figures 12-15 are the same as Figures 8-11 except that the
salt is sodium sulfate.
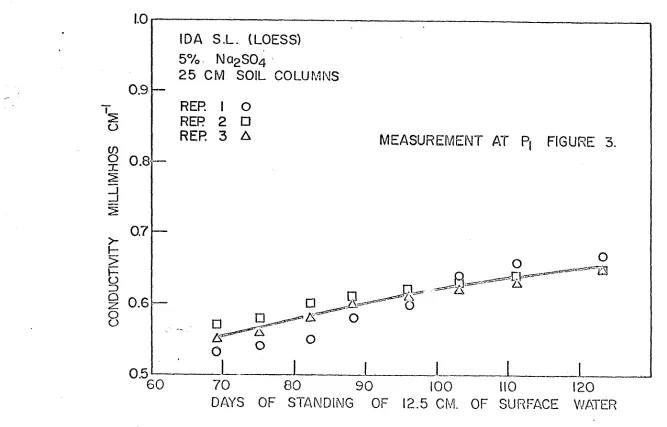
To compare the three different salts, namely, sodium
chloride, sodiim bicarbonate, and sodium sulfate. Figure 16 has
been prepared by tracing curves from Figures 6, 10 and 14.
Figure 16 shows that sodium chloride diffuses more than sodium
bicarbonate, since the values of the conductivity varies from
zero to higher than 7,0 while the conductivity for sodium bi
carbonate varies only from zero to about 1,0, Also, the curve
of the latter is always in between that of the sodium chloride
and the sodium sulfate. Thus sodium sulfate diffuses much less
than the sodiim bicarbonate. The conductivity in the case of
the sulfate only varies from zero to 0,7 in the 120 days elapsed
time.
Figures 17-20 show the effect of soil types on diffusion
behavior. To compare Clayton sand and Ida silt loam. Figure 21
1.6
o
in
S 1.2
5% N0HCO3
25 CM. SOIL COLUMNS
REP. I. O
REP
zn
REP 3. A
REP
4. AMEASUREMENTS AT P, FIGURE 3.
_j ^0.8
>
b
3 o§0.4
o 050
1
60
DAYS OF
1
70
STANDING
80
OF 12.5
SO
CM. OF
100
SURFACE
Figure 9, Conductivity versus time curve for 12,5 cm. of water standing on the surface of salinized soil with NaHCOg when the conductivity measurements were made 2,5 cm. (point P2, Figure 3) above the soil surface. From days 0 to 70 water was added in weekly increments (total of 7.5 cm. in 70
1.6
in
X 1.2
[image:59.824.87.726.41.497.2]25 CM. SOIL COLUMNS
RER I.O
REP 2.0
RER 3. A
RER 4. A
MEASUREMENTS AT
FIGURE 3
_j
^0.8
>
b
g
§0.4
o0
—i
0.
1
i
i
60
70
80
90
100
DAYS OF STANDING OF 12.5 CM. OF SURFACE
I .6
O
in
X
1.2
_j
57o NoHCOg
2 5 CM. SOIL COLUMNS
REP I. O
REP 2. •
RER 3. A
REP. 4. A
MEASUREMENTS AT
P^
WITH STIRRING FIGURES.
>0.8
DAYS
40
60
80
K)0
12%)
I .6
57o NoHCO3
2 5 CM. SOIL COLUMNS
o
CONDUCTIVITY IN STIRRED WATER
CONDUCTIVITY AT SOIL SURFACE
CONDUCTIVITY 2.0 CM.
ABOVE THE SOIL SURFACE
DAYS OF STANDING OF 12.5 CM. OF
100
SURFACE
0.9
01 0.8
1 =j >-t >b
Z)a
z8
0.7
0.6
0.5
GO
IDA S.L. (LOESS)
57o
N 02504
25 CM SOIL COLUMNS
REP. I O
RER 2 •
RER 3 A
MEASUREMENT AT P, FIGURE 3
cn
00
SIANDING
12.5 CM.
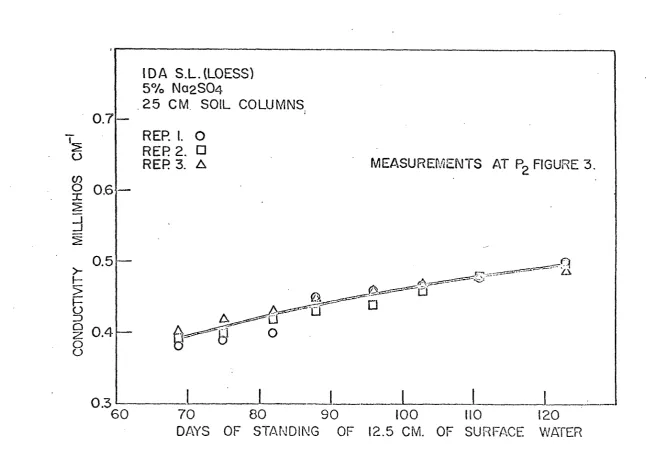
[image:65.823.56.723.87.514.2]0.7
o
m
o
0
.61
25 CM SOIL COLUMNS
RER I. O
RER 2. •
RER 3. A
MEASUREMENTS AT
FIGURE 3.
_j
>-b >
i
o
2:o
o0.5
0.4
-2
o0.3
60
70
80
90
100
DAYS OF STANDING
OF 12.5 CM.
110
OF SURFACE
[image:67.820.87.737.56.514.2]Figure 14. Conductivity versus time curve for 12,5 cm, of water standing on the surface of salinized soil when the conductivity measurements were made at the central depth of the surface water after it had been stirred (point Po, Figure 3), From days 0 to 70 water was added in weekly
.8
o
COo
X s 3-6 t > 4b' =) O z
o p
o
25 CM. SOIL COLUMNS
REP. I. O
REP 2. •
REP 3. A
P
Oi
0
20
40
60
DAYS OF STANDING OF
O
0
MEASUREMENT AT FL
mJH STIRRING FIGURE 3.
80 100 120
fJooSCli
as CL4
SOIL COLUMNS
-.0.8 S o CO p
^ O.G
u S>-H 0.4
>
h-o 3 O z gO.L0
ilViTY IN SllRRED W/VrEll
2.0' c;\î.Ar:ov[: THE SOIL SU:CONDUCMVITY AT
SO!!..SUr.i ACZ
0
20 ^0 COGO
J_
mo
I
120
CM.
or
SLI:{FACE W'ATLR
DAYS or S'lANDiNG Or
l2.o
25 CM. SOIL COLUMNS
8
u
• -6
_j
NoCI
> 4
NoHCO3
0
0
20
40
DAYS OF STANDING
Na^SO^
80 100
120
Figure 17, Conductivity versus time curve for 12.5 cm, of water standing on the surface of salinized Clayton sand with Na2S04. when the conductivity measurements were made just above the surface of the sand (point
8
6 —
CLAYTON SAND
5% N02504
25 CM SOIL COLUMNS
[image:75.824.95.728.87.507.2]REP I O
REP. 2 •
REP 3 A
R E P 4 A
MEASUREMENTS AT P,
FIGURE 3.
%0
60
70
1
80
i
90
i
i
DAYS OF STANDING
OF 12.5 CM.
100 110
8
6 —
CLAYTON SAND
57o N 0230425 CM SOIL COLUMNS
RERI.REP.2.
RER3. REP 4.
•vj
o
MEASUREMENT
AT P2 FIGURE 3.
Q
1
1
1
50
60
DAYS OF
70 80
STANDING
OF
90
12.5 CM. OF
100
SURFACE
[image:77.822.112.746.90.506.2]T 8 —
6 —
42
-57o N 02504
25 CM
SOIL COLUMNS
RER l,0
RER 2 . 0
REP 3. A
RER 4. A
oa
1
1
20
DAYS OF
40
STANDING
O
MEASUREMENT AT P3
WITH STIRRING FIGURE 3
80
100
120
.25 CM
SOIL COLUMNS
^^CONDUCTIVITY IN STIRRED WATER
CONDUCTIVITY 2.5 CM. ABOVE THE SOIL SURFACE
—— CONDUCTIVITY AT SOIL SURFACE
0
20
40
60
80
100 120T
8
5% NQ2SO4
25 CM
SOIL COLUMNS
CLAYTON SAND
IDA SILT LOAM
100 120
77
the curves of Figure 21 differ markedly, suggesting a large
difference between the Clayton sand and the Ida loess. It is
apparent that for the Ida loess a large number of smaller pores
act as static sinks to salt diffusion. That is, no salt dif
fuses from these small pores. The larger the pores contained
in the porous media the greater is the diffusion influence
--at least for the same time lapse. W--ater from smaller pores
interdiffuses into the big pores when drains are stopped. In
Figure 21 the conductivity values for the Clayton sand were
more than nine times those of the Ida soil after 60 days of
standing of surface water,
A few other data for 6 columns of 50 centimeters length
are shown in previously cited Table 1,
Figures 22-24, 26, 27 and 29, show that in all cases the
conductivity is always higher in the stirred water (point P3,
Figure 3) than in the water at the soil surface (point P]_).
Figures 25 and 28 confirm the result obtained before (Figure
16) indicating that diffusion is always greater for sodium
chloride than for sodium bicarbonate or for sodium sulfate.
Figure 30 emphasizes that diffusion works more actively in
the case of sand than in the glass beads or in the silt loam
for the first 86 days of lapsed time. After this time the
diffusion is greater in the glass beads indicating an important
result, namely, the diffusion coefficient is not constant for
all the time lapse. This diffusion coefficient may start with
upon many factors among which are the type of salt, the size of
pores contained, in the porous medium, depth of soil and the
time. It also can be concluded that the amounts of salt that
will diffuse into the soil surface water even up to 130 days of
leaching are small, and it is recommended that the soil be
stirred in the upper few inches of depth by plowing as the
Egyptian buffaloes do as they go over a flooded soil, if this
method is used for leaching.
It is also recommended not to leave the water standing on
the soil surface for a great length of time since the experi
ment results showed practically no movement of leaching water
through the soil profile. The hydraulic conductivity was ap
parently reduced to essentially zero due to the effect of the
sodium salts. Flooding with water for a great length of time
may affect the structure of crystal lattices or may destroy the
micro-crystals, even the diffusion action of sodium salts is
1.6
O
O)
X 1
.2
50 CM. SOIL COLUMNS
CONDUCTIVITY
IN STIRRED
V/ATER
•CONDUCTIVITY AT SOIL SURFACE
CONDUCTIVITY 7.0 CM.
ABOVE THE SOIL SURFACE
20
40
60
80
100
120
Figure 23. Conductivity versus time of 29,37 cm, of water standing on the surface of a salinized column of 50 cm. length of Ida loess salinized with
5% NoHCOg
50 CM. SOIL COLUMN
CONDUCTIVITY IN STIRRED
WATER
CONDUCTIVITY 70 CM
ABOVE THE SOIL SURFAC
CONDUCTIVITY AT SOIL
SURFACE
20
4 0
60
80
DAYS OF STAIJDING OF 29.37 CM. OF SURFACE
120
V; AT ER
00
's .8
o
(Oo
X1.6
>
>.4
b
3O z
8
.25% Na2S04
50 CM. SOIL COLUMN
CONDUCTIVITY IN STIRRED WATER
"^^\CONDUCTIVITY 7.0CM
ABOVE THE SOIL
SURFACE
O
CONDUCTIVITY AT SOIL SURFACE
O
I 1 1 1
1
100
f-G
20
40
60
80
100
120
50 CM. SOIL COLUMNS
No CI
NoHCO
>.4
Oi
20
DAYS OF STANDING OF 29.37 C
40
60 80M.
100
Figure 26, Conductivity versus time of 37.0 cm, of water standing on the surface of saLinized sand column of 50 cm, length, when the conductivity
5% NoCI
50 CM. SAND COLUMN
40-5
o
|301-Zj
>2Ch >
t-o 3
O
o
u10
CONDUCTIVITY IN STIRRED WATER
CONDUCTIVITY AT THE
SOIL SURFACE
00 00
CONDUCTIVITY 15 CM
ABOVE THE SOIL SURFACE
1
I
1
1
1
4
-o
# 3
57o NaHCOs
50 CM SAND COLUMN
CONDUCTIVITY IN STIRRED WATER
•jS^^^ONDUCTIVITY 150 CM
A
ABOVE THE SOIL
SURFACE
NDUCTIVITY AT THE SOIL
SURFACE
O
0
1
1
1
1
40
80
120
160 -
200
240
40
o
o
X30
D
>20
>
h-o z?
o
g 10
O—
NoCI
,NaHC03
1
1
1
1
1
1
kO K)