Abstract: In the present times of big data, large volumes of broad variety data are generated at high velocities every day. These big data contain unknown valuable information. To mine and extract knowledge from these big data, fast and scalable big data analytics are required. Clustering is a remarkable data mining technique. K-means clustering for data mining is of great interest because of its simplicity. However, there are certain limitations in K-means for analyzing big data which leave scope for successive improvements. Distributed processing frameworks and algorithms are helpful to obtain performance and scalability needs of analyzing big datasets. This research work designs a parallel K-means clustering algorithm by improving standard K-means in MapReduce paradigm. The proposed work presents a method to find initial seeds of clusters instead of randomly selecting them which is a major drawback in standard K-means for clustering big data. The research minimizes MapReduce iteration dependence also. Moreover, the presented algorithm takes into consideration between cluster separation and within cluster compactness to achieve accurate clustering. Cloud computing is applied in which Amazon Elastic MapReduce 5.x is used. It distributes the job of clustering among various nodes in parallel using low cost machines. The proposed work is simulated on some real datasets from UC Irvine Machine Learning Repository. The results confirm that the research work helps achieve higher performance and outperforms classical K-means while clustering large datasets.
Index Terms: Artificial Intelligence, Big Data, Cloud Computing, K-means, MapReduce
I. INTRODUCTION
The approach of big data is challenging and time consuming job. It needs enormous computational space to assure successful data processing and analysis. Cloud computing, a robust technology, implements complex computing in massive scale. It eradicates the requirement to maintain costly computing hardware, dedicated space requirement and related software. The phrase ‘Big Data’ characterizes new techniques to capture, store, distribute and analyze gigabytes or larger sized datasets with high velocity and divergent structures. To analyze these large amounts of data, inexpensively and efficiently, parallelism technique is used. With the development of cloud based Big Data services, data analytics has become feasible for organizations of all sizes. Clustering is a powerful, frequently used big data analytics and prediction technique. The method finds meaningful groups of entities and differentiates clusters formed for a dataset [1]. The capability to automatically group similar items enables analysts to discover hidden similarities and essential concepts while combining a large amount of data
Revised Manuscript Received on June 05, 2019 Agnivesh, AIIT, Amity University, Lucknow, India
Dr. Rajiv Pandey, AIIT, Amity University, Lucknow, India
Dr. Amarjeet Singh, Department of Computer Science, Sriram Institute of Technology and Management, Kashipur, India
into a few groups [2]. This allows users to envision a large amount of data. Standard K-means clustering performs well when applied to small datasets. K-means algorithm is most widely used clustering technique to find homogenous objects on the basis of distance vectors suited to small datasets. Pre-specifying the number of clusters is the primary requirement to apply K-means. It is a trial-and-error [3] process to find the exact number of clusters for a given dataset. Moreover, initial centers are selected randomly. These steps of conventional K-means algorithm makes cluster analysis of big datasets critical. Hence, it is a need of the time to enhance K-means algorithm to suit large datasets. With the development of cloud computing, MapReduce paradigm evolved as a competent technique for generating distributed large-scale data processing applications. MapReduce [4] is a coding based model developed by Google for processing multidimensional big datasets. A user can conveniently use MapReduce model for solving area-specific problems. Currently, MapReduce is widely applied by several large organizations. Nevertheless, coding map-reduce functions is very difficult to solve real world problems as the framework is rigid.
II. LITERATURE REVIEW
Researchers turned to clustering big data as data volume is continuously rising these days and it is need of the time to extract valuable insights from big data. Researchers have been endeavoring to improve further and further big data analytics. Many algorithms have been proposed in this direction. The presented work reviews some of these works which are most widely known.
Researchers in [5] worked on multidimensional large dataset to discuss issues while clustering large datasets with MapReduce. They proposed a parallel clustering method through Hadoop MapReduce framework which focused on a key factor of reducing I/O and network costs. Faster execution and scaling were two crucial points to deal with. The drawback of this method is that it is a hard-clustering process. For the datasets having many overlapping clusters, it may not be the best solution.
Deriving from the behavior of birds in a flock, one of the solutions has been found. In the recent past, the graphics processing unit (GPU) gained attraction. It is able to solve very quickly problems of parallelism. Researchers in [6] applied this concept using CUDA platform from NVIDIA GPU. Weakness of this work lies in its complexity O(n2). The results generated are not within reasonable period of time. The research work is carried out using single GPU. Parallelism becomes essential to process the dataset that may not be contained in a single disk.
Similarly, Andrade et al. in
[7] used DBSCAN
Improved K-means Map Reduce Algorithm for
Big Data Cluster Analysis
algorithm on GPU to gain high performance. However, the method is based on calculating a proximity radius between objects. For those objects which are beyond the proximity radius, this method may not be applicable. In 2013, Xiao Cai and co-authors [8] concisely reflected on collection of data from various sources, each source representing a different aspect of the data. Since each source has its own individual aspect, therefore, clustering of big data here becomes difficult. They presented a novel method to combine composite representation of large scale data which specifies no fix criteria. The method may not be categorized to produce optimized results.
Furthermore, researchers in [9] presented an algorithm to improve K-means clustering by obtaining initial centroids. First, the algorithm calculates mean of the dataset. Then, distance between data points is calculated until d reaches to mean. These two data points will be the candidate for initial centroids. This process is cumbersome for clustering big data and makes it comparatively more iterative than reasonable. Kodinariyal and Makwana reviewed K-means clustering on determining number of clusters [10].
Authors in Cui et al. [11] mentioned MapReduce to be unstable due to iterations which involve restarting jobs again and again. They proposed a new model of processing big data using K-means algorithm devoid of iterations. The merging technique proposed by them does not seem to be appropriate and therefore clustering quality may not be as required in big data clustering.
Researchers in [12] worked on clustering text documents for similarity check. Deliberating that output is fully dependent on input of number of clusters, they affirmed keyword as input. They created subset of documents for achieving desired results. Divide and Conquer strategy applied in this research is in itself a major drawback.
Tsai with co-researchers in [13] write that one of the main reasons of failure in clustering large datasets by traditional clustering methods is that most of them are designed for centralized systems. In their paper they proposed to solve this problem by an algorithm which they termed as MapReduce Black Hole (MRBH) which accelerated clustering. The weakness is that they applied random generation and initialization of stars.
Problem of initial cluster centers in K-means algorithm was tried to be solved by researchers in Wu et al. [14] by sampling the large dataset and used convex hull and opposite Chung points. They applied MapReduce framework for parallel execution of the algorithm. The limitation of this work lies in the fact that the Chung points find only two initial cluster centers.
Authors of [15] compared K-means and K-mediods. They applied nearly ten thousand transactions of KEEL dataset repository. Results described that K-medoids is better than K-means in terms of execution time, noise minimization and choosing initial center.
Further, researchers studied K-means, Fuzzy C-Means (FCM), hierarchical clustering algorithm like Balanced Iterative Reducing and Clustering using Hierarchies (BIRCH) and grid based clustering algorithm Clustering In QUEst (CLIQUE) which are the prevailing effective algorithms. Ajin and Lekshmy [16] compared them in context of big data. A new Inter and Intra K-means Clustering (KM-I2C) algorithm was developed in [17] by changing clustering distance metric that used parallelization tools through Hadoop. However, the method selects initial centers
randomly from the dataset which is a major limitation in clustering big data as it results in generating less optimized clusters.
Rehioui et al. [18] in their research presented a new version of DENCLUE called DENCLUE-IM which avoids complexities of other DENCLUE algorithms for speedy calculation of big data. They compared the proposed
approach with DENCLUE, DENCLUE-SA and
DENCLUE-GA. However, for execution in multiprocessor environment, partitioning of dataset may find a difficult proposition. Moreover, fixed number of clusters can make it difficult to predict the value of K.
A concept of big data in form of streams and how to process them was presented by Giacomo Aletti and the co-author in their research in [19]. Datasets having components of characteristics which find correlation were considered. They used Mahalanobis distances for assignment of data to clusters estimating total number of clusters. The proposed method can be applied only in the cases where data points are low dimensional.
Researchers in [20] worked on clusters where boundaries are not firm with certainty. There are lower and upper approximations. The algorithm proposed by them was based on weighted distance measure with Gaussian function for computing the new center for each cluster. The main drawback of the presented algorithm is that it is highly complex in nature consuming more computing time than the other algorithms.
Vijay et al. [21] presented an algorithm which they termed as Variance Based Moving K-means (VBKM). They applied a new distance metric. Moreover, the research work used a different approach for moving data points between clusters to minimize within cluster distance. The researchers have not taken into account selection of initial centers of clusters and as such the results may remain lacking in achieving optimized output.
III. EXPLORING STANDARD K-MEANS ALGORITHM K-means segregates the data set into K parts where K denotes a positive integer number and stands as a user input to the algorithm. Each cluster has a centroid. The algorithm checks the positions of these centroids as the algorithm iterates. Random values are put to initialize the centroids before the first iteration. The algorithm stops as soon as centroids locations become static during iteration [22]. This well-known algorithm performs two steps per iteration:- This well-known algorithm performs two steps per iteration:- 1.Allocate each objectxi to a closest cluster centroid cj. This
allocation is obtained by Euclidean measure between the object and the cluster's centroid (obtained at a previous iteration).
2.Update the centroids of the clusters based on new clusters members.
The above two steps continue to a finite number of repetitions, until there is no modification or alteration of the cluster centers. Suppose {x1,....,xn} are the given
observations of a multidimensional huge dataset D with d dimensions [23]. The objective is to determine a set of K or cluster centroids C = {c1,….,cK} that minimizes the within
(1)
The above equation defines a cluster assignment rule as (2)
The problem of choosing K, the number of clusters and cluster centers, can be considered to be a model determination problem [24].
Algorithm: Standard K-means Input: Dataset D={x1,….,xn} and
K (number of clusters to be generated)
Step 1: Select centers C randomly from D
Step 2: If u > iter then /* loop repeats until convergence Step 3: for each xi compute distance from all centers Cj
dist(xi, Cj)
Step 4: Assign xi to closest Cj (min(dist(xi, Cj))
Step 5: Calculate new centroid
Step 6: end for
Step 7: End if Step 8: Exit
This is a standard procedure of clustering datasets using K-means algorithm. But the algorithm is vulnerable to certain problems [25][26]:
1.The method to initialize the centroids is not specified. Randomly choosing K of the samples is prevalent. 2.Quality of clustering depends on the initial values for the
centroids and it happens that suboptimal partitions are found number of times. Trying a number of different starting points is only a solution which is used mostly. 3.Value of K affects results.
4.The standard algorithm is simple but it has high time complexity when the datasets are large multidimensional. Under this circumstance the memory of a single machine could not be sufficient.
IV. K-MEANS CLUSTERING VIA MAPREDUCE Conventional data warehouse fails to handle unstructured and semi-structured data since they are based on relational data model. Moreover, data warehouses are incapable of processing sets of big data that are regularly updated or may be continually, as in the case of real-time data such as weather data. That is why many organizations that collect process and analyze big data turn to NoSQL databases as well as Hadoop.
Hadoop, an open source framework addresses two main issues of big data which includes storage and processing using distributed concepts with commodity hardware. This framework literally carries large amount of data and when demand arises, performs data analysis [27].
Hadoop contains two core components. These are Hadoop Distributed File System (HDFS) and MapReduce. HDFS is specially designed file system for storing huge datasets with clusters of commodity hardware and streaming access patterns. MapReduce processes data in distributed environment. MapReduce can be programmed in various languages such as Java, Python and Ruby.
Traditional K-means algorithm works in MapReduce paradigm in the following way:
Algorithm 2: K-meansMapReduce
Input: Dataset D ={x1,….,xn} and
K (number of clusters to be generated) Output: Final set of clusters
i = 0
for all d Є D do
initial_centroid = select(K,d) input data file from directory write initial centroid to a file
previous_centroid = initial_centroid while condition true do set mapper to map class define set reducer to reduce class define end while
new_ cluster_ centroid = read centroid values to a file if update((new_cluster, old_cluster) > 0)
previous_centroid = new_centroid else
update new_centroid to result i++
repeat until convergence
result = read centroid values to a file V. PROPOSED WORK
The proposed work modifies map phase and reduce phase of standard K-means MapReduce algorithm. It consists of two algorithms, illustrated as Algorithm 3 and Algorithm 4.
Unlike standard K-means and its varied versions which specify that the algorithm creates K clusters, the proposed work improves the algorithm by taking extra cluster centers by applying equation 3:
K = k*e, (3) where e >1 is extra center factor.
For one cluster, the algorithm takes an observation randomly from the training dataset and the point corresponding to this observation is the first initial seed. To find the center for next cluster, select an observation from the training dataset which is at maximum distance from the first cluster center using equation 4 as given below
(4) This step is repeated to find the third cluster center. Proposed algorithm repeats this step until we have K cluster centers. Currently, several versions of K-means algorithm are available to cluster datasets. Though, they are lacking in estimating cluster similarity of large datasets for creating well defined clusters. A K-means algorithm will give globally optimized results with high levels of within cluster similarity and low levels of between cluster similarities. The proposed work splits datasets into definite clusters based on between cluster and within cluster similarities. Final clusters generated after execution of the experiment will be well separated if the betweencluster metric value will be maximized
and each cluster produced will be tight if the withincluster
distance measure will be minimized. This is achieved by the research work through two new distance measures- betweencluster and withincluster
used in Map phase. The betweencluster metric
separation of clusters which is given by equation 5: (5) where nc is the number of clusters, vi is centroid of the ith
cluster and is variance.
The withincluster metric calculates similarity measure between
the data in a cluster. It is defined by finding density which is given by equation 6 as follows:
(6)
Here mij = midpoint of the distance between vi and vj cluster
centroids.
As given in [23] the density function is defined by the number of points in a hyper-sphere whose radius is equal to the average standard deviation of clusters. Precisely the average standard deviation of clusters derived is as referred below:
(7) Algorithm 3: Proposed Work Map Phase
Input: D: dataset having n number of dimensions in each mapper
k: k clusters
Output: output vector <key, value>
Determine number of initial seeds from equation (3)
Find C1,….,K , initial cluster centers obtained from equation (4)
vector_new : New Centroid Vector value = 0
vector_new = 0 while all d Є D while all Ci Є C do
cc =: Ø /* cc denotes center nearest to the data point between_cluster = MAX_VALUE
within_cluster = MAX_VALUE while all di Є D do
l(di) =: euc (di, dj) /* euc is Euclidean distance between
data points
i =: 0 /* i represents number of iterations c =: 0
while all xi Є X do
minDist =: DistanceMeasurer(di, cj)
if (curr_centr = 0 or 1(di) < minDist) then
update intra_cluster using equation (5) else
update inter_cluster using equation (6) cc++
i++
generate output vector <key, value> with each data point and the centroid of its cluster
repeat until convergence
Algorithm 4: Proposed Work Reduce Phase
Input: (key, value): where key is centroid and value is data point assigned to the centroid
Ov: Output vector from mappers
Output: vector_new : Averaging_Vector (AV)
vector_new = 0 AV = null
while each x Є Ov do
centroid = x.key data point = x.value
AV = data point while each ci Є M do
Sum_vector = null Num_vector = null while each oi Є O do
Sum_vectors += vector Num_vector ++
AV = sum_vector/num_vector Outputvector = AV
Return AV
VI. EXPERIMENTAL DESIGN A. Machines
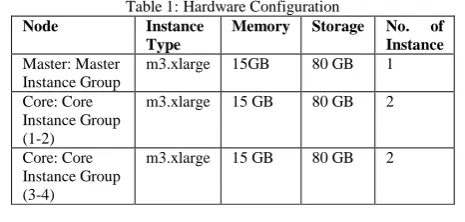
[image:4.595.310.543.406.517.2]The research work is simulated on Amazon Elastic MapReduce 5.x using Amazon Web Service (AWS) Elastic Compute Cloud (EC2) resources having 8 (2.5 GHz Intel Xeon E5-2670v2) CPUs. Apache Hadoop 2.7.3 version is used on Ubuntu Server, 64 bit operating system with high I/O performance. Hadoop streaming utility is applied to write mapper and reducer executable in Python. Dataset is stored in Amazon S3. Table 1 gives information about the machines used in the experiment. Instance is a virtual server in Amazon EC2 executing applications on AWS framework. Two types of nodes are used in EMR cluster of EC2 instances: master node and core node. Master node controls the entire cluster and usually runs master components of distributed applications. Core node handles data storage and runs parallel computation tasks on data which is needed by the installed application.
Table 1:Hardware Configuration
Node Instance Type
Memory Storage No. of Instance
Master: Master Instance Group
m3.xlarge 15GB 80 GB 1
Core: Core Instance Group (1-2)
m3.xlarge 15 GB 80 GB 2
Core: Core Instance Group (3-4)
m3.xlarge 15 GB 80 GB 2
B. Datasets
The research work used real datasets to test the performance of the presented model. These datasets are Daily and Sports Activities dataset and Newsgroup dataset collected from UCI Machine Learning Repository.
Daily and Sports Activities Dataset is collected by providing sensors to monitor motion of sports activities at the rate 19 per day involving 8 persons in their own individual styles for 5 minutes. There are 9120 records in the dataset with 5625 number of attributes. The dataset has the typicality that it is time-series multivariate dataset. Data values are real as recorded by the collectors [28]. Fig. 1 presents a subset of the datasets which is input to the proposed system.
After preprocessing, these raw datasets are transformed into understandable format. The datasets vary in size extending from 192 MB to 1035 MB viz 326 MB, 510 MB, 685 MB and 840 MB. The datasets are sparse and variation in dataset sizes benefits to evaluate performance gain of the proposed algorithm effectively. Fig. 1 presents a subset of the datasets which is input to the proposed system.
Fig. 1 Input dataset to the proposed system
VII. RESULTS AND DISCUSSION A. Performance
The authors of the manuscript analyzed execution times from all the experiments in order to find the performance of proposed model of K-means and compared with standard K-means MapReduce algorithm.
Table 2 shows execution times of the two comparing algorithms for K= 10 clusters with dataset size ranging from 192 MB to 1035 MB.
Table 2: Execution Time in seconds Dataset K-means
MapReduce
Proposed Work % of Reduction in Execution Time
192 79 49 38
326 91 56 39
510 95 59 38
685 110 67 40
840 122 70 43
1035 147 88 40
Fig. 2 illustrates the execution times of 10 clusters for the datasets compared with proposed work and K-means MapReduce algorithm. K-means MapReduce uses Euclidean metric to check similarity. Our proposed algorithm uses between_cluster and within_cluster distance measures to generate better quality big data clusters with higher within cluster similarity and lower between cluster similarities.
[image:5.595.47.276.146.288.2]Figure 2: Comparing execution times with dataset size
Figure 2 represents dataset sizes in mega bytes along x-axis and execution time of the algorithms in seconds along y-axis. The green curve in the graph represents execution time of K-means MapReduce algorithm which varies between 79 seconds to 147 seconds. The blue curve in the graph represents execution time of our proposed work which varies between 49 seconds to 88 seconds.
[image:5.595.316.537.242.399.2]Evidently proposed algorithm reduces remarkably the time of execution compared to other algorithms. Here, smallest size dataset is 192 MB and the largest size dataset is 1035 MB. The average reduction in execution time of these datasets by proposed algorithm is 39.6% as compared to K-means MapReduce algorithm. Proposed algorithm outperforms the other algorithms. It is prominently more advantageous to apply in cluster analysis of big datasets.
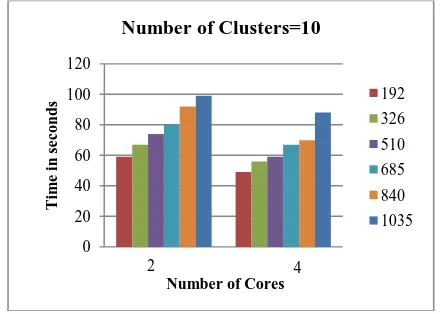
Figure 3: Comparing execution time with 10 clusters by Proposed Work
[image:5.595.308.545.541.726.2]The outcome of the number of core machines on the clustering algorithms is also studied in the research work. Fig. 3 and Fig. 4 show the execution times of 10 clusters for cluster analysis by proposed work and K-means MapReduce when operated on 2 and 4 numbers of cores. These results exhibit that the level of scalability also has appreciable impact on the process of clustering. With increase in the number of parallel processing, there is significant reduction in execution time by the algorithms.
Figure 4: Comparing execution time with 10 clusters by Standard K-means MapReduce
0 50 100 150 200
E
x
ec
u
ti
o
n
T
im
e
(
sec
o
n
d
s)
Dataset Size(MB)
Comparing Clustering Techniques
K-means MR Proposed Work
0 20 40 60 80 100 120
T
im
e
in
sec
o
n
d
s
Number of Cores Number of Clusters=10
192
326
510
685
840
1035
2 4
0 20 40 60 80 100 120 140 160 180
T
im
e
in
sec
o
n
d
s
Number of Cores Number of Clusters=10
192
326
510
685
840
1035
[image:5.595.58.280.645.781.2]B. Cluster Validity
Cluster validity is a term widely referred when assessment of the results of a clustering algorithm is performed. For measuring “goodness” of a clustering result, there are several validity indices which are applied. The Davies-Bouldin index is one of the popular validity indices. The index is determined by equation 8 as:
(8)
Here
Here K = number of cluster, Sij = similarity measure of
clusters,
dij = distance between two centroids, and si = dispersion
measure of a cluster.
Lower DBi represents high separation between clusters and
[image:6.595.90.252.297.409.2]high similarity within clusters.
Table 3: DBi for distinct K
K DBi of Proposed Work
DBi of K-means MapReduce
5 0.145538 0.211037 6 0.179694 0.235912
7 0.229571 0.254349 8 0.205063 0.276085
9 0.213975 0.286954
10 0.216669 0.286751
Table 3 shows values of DBi for proposed work and K-means
MapReduce algorithms for varied number of clusters ranging from K=5 to K=10 for various dataset sizes. It is observed that the work under reference has lower values of DBi
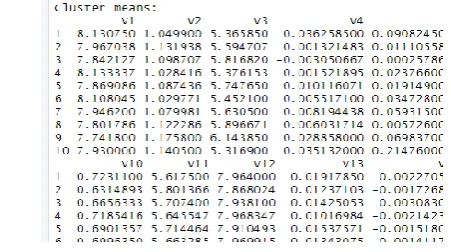
[image:6.595.48.274.511.637.2]compared to the other two algorithms exhibiting distinctly good quality clusters generation. Fig. 5 is showing outputs produced when the proposed algorithm is executed.
Figure 5: Outputs of the proposed work
VIII. CONCLUSION
Big Dataset cluster analysis is a complicated task due to new challenges that are raised with big data. Hadoop MapReduce technique is being prominently applied these days to cluster big data using standard K-means in distributed environment. However, traditional K-means MapReduce algorithm suffers from some limitations. This research work proposes improvements in MapReduce K-means algorithm to overcome the limitations in clustering big data. The presented work includes two algorithms. First algorithm modifies Map
phase. It inputs a large value of initial centroids, computes location of initial seeds and applies betweencluster and
withincluster distance measures to produce quality clusters.
Second algorithm reforms Reduce phase by aggregating these centroids and generates final set of clusters. The authors verified the performance of the model on certain real datasets. The results confirm that the proposed work is a comparatively powerful tool for clustering big datasets proving that it outperforms existing K-means MapReduce algorithm.
REFERENCES
1. Han J, Pei J and Kamber, M. Data Mining: Concepts and Techniques, Third Edition, Elsevier, 2011.
2. Fang W, Sheng VS, Wen X and Pan W. “Meteorological data analysis using MapReduce”. Sci World J. 2014;2014. DOI: 10.1155/2014/646497.
3. Pham DT, Dimov SS and Nguyen CD. (2005), “Selection of K in K-means clustering”, Proc. IMechE Vol. 219 Part C: J. Mechanical Engineering Science, DOI: 10.1243/095440605X8298
4. Du W, Qian D, Xie M and Chen W. “Research and Implementation of MapReduce Programming Oriented Graphical Modeling System”, 2013 IEEE 16th International Conference
on Computational Science and Engineering, Sydney,
NSW, 2013, pp. 1332-1337. doi: 10.1109/CSE.2013.197
5. Cordeiro RLF, Traina Junior C, Traina AJM, López J, Kang U and Faloutsos C. “Clustering very large multidimensional datasets with MapReduce”, In: Proceedings of KDD’11, ACM, California, August 21–24. 2011.
6. Cui X, Charles JS and Potok T. “GPU enhanced parallel computing for large scale data clustering”. Future Generation Computer Systems, 29(7), 1736-1741, (2013).
7. Andrade G, Ramos G, Madeira D, Sachetto R., Ferreira R and Rocha L. (2013). “G-DBSCAN: A GPU accelerated algorithm for density based clustering”. Procedia Computer Science, 18, 369-378
8. Cai X, Nie F and Huang, H. “Multiview K-means Clustering on Big Data”. Proceedings of the Twenty-Third International Conference on Artificial Intelligence, Pages 2598-2604, Beijing, China, August 03-09, 2013,ISBN:978-1-57735-6332-2
9. Ghosia U, Ahmad U and Ahmad M. “Improved K-Means Clustering Algorithm by Getting Initial Centroids”, World Applied Sciences Journal 27 (4): 543-551, 2013, ISSN 1818-4952, © IDOSI Publications, 2013, DOI:10.5829/idosi.wasj.2013.27.04.1142. 10. Kodinariya1 TM and Makwana PR. “Review on determining number
of Cluster in K-Means Clustering”, International Journal of Advance Research in Computer Science and Management Studies, ISSN: 2321-7782 (Online), Volume 1, Issue 6, November 2013. 11. Cui X, Zhu P, Yang X, Li K and Ji C. “Optimized big data clustering
using MapReduce”. The journal of Supercomputing (2014). Volume
70, Issue 3, pp 1249–125970: 1249.
https://doi.org/10.1007/s11227-014-1225-7
12. Bide P and Shedge R. “Improved Document Clustering using k-means algorithm”, 2015 IEEE International Conference on
Electrical, Computer and Communication
Technologies (ICECCT), Coimbatore, 2015, pp. 1-5. doi: 10.1109/ICECCT.2015.7226065
13. Tsai CW, Hsieh CH and Chiang MC. “Parallel black hole clustering based on MapReduce”, In: Proceedings of IEEE International Conference on Systems, Man and Cybernetics, 2015. DOI: 10.1109/SMC.2015.445
14. Wu K, Zeng W, Wu T and An Y. “Research and improve on K-means based on hadoop”. Software Engineering and Service Science (ICSESS). 2015 6th IEEE conference, 23-15 september, 2015. DOI: 10.1109/ICSESS.2015.7339068.
15. Arora P, Deepali and Varshney S. “Analysis of K-Means and K-Medoids Algorithm For Big Data”, Volume 78, 2016,
Pages 507-512.
r-1 Photo
16. Ajin VM and Kumar LD. “Big data and clustering algorithms”. 2016 International Conference on Research Advances in Integrated
Navigation Systems (RAINS).
DOI:10.1109/RAINS.2016.7764405.6-7 May 2016.
17. Shridhar, C., Kasivishwanath, N. and Reddy, P. C. Clustering large datasets using K-means modified inter and intra clustering (KM-I2C)
in Hadoop. Journal of Big Data (2017). DOI:
10.1186/s40537-017-0087-2. Springer.
18. Rehioui, H., Idrissi, A. Abourezq, M. and Zegrari, F. DENCLUE-IM: A New Approach for Big Data Clustering. Procedia Computer Science, Volume 83, 2016, pages 560-567, DOI:
10.1016/j.procs.2016.04.265. ELSEVIER.
19. Aletti, G. and Micheletti, A. A clustering algorithm for multivariate data streams with correlated components. Journal of Big Data 2017:48. DOI:10.1186/s40537-017-0109-0
20. Zhang, T. and Ma Fumin, F. (2017). “Improved rough k-means clustering algorithm based on weighted distance measure with Gaussian function”, International Journal of Computer
Mathematics, 94:4, 663-675, DOI: 10.1080/00207160.2015.1124099 21. Vijay V, Raghunath VP, Singh A and Omkar SN. “Variance Based
Moving K- Means Algorithm," 2017 IEEE 7th International Advance Computing Conference (IACC), Hyderabad, 2017, pp. 841-847. doi: 10.1109/IACC.2017.0173
22. Jain AK and Dubes RC. (1988). Algorithm for Clustering Data, Prentice Hall.
23. Halkidi M, Batistakis Y and Vazirgiannis M. Journal of Intelligent
Information Systems (2001) 17: 107.
https://doi.org/10.1023/A:1012801612483
24. Saini A, Minocha J, Ubriani J and Sharma D. "New approach for clustering of big data: DisK-means," 2016 International Conference on Computing, Communication and Automation (ICCCA), Noida, 2016, pp. 122 126.doi: 10.1109/CCAA.2016.7813702
25. Pandove D and Goel S. "A comprehensive study on clustering approaches for big data mining," 2015 2nd International Conference on Electronics and Communication Systems (ICECS), Coimbatore, 2015, pp.1333-1338. doi: 10.1109/ECS.2015.7124801
26. Qiao J and Zhang Y. "Study on K-means method based on Data-Mining," 2015 Chinese Automation Congress (CAC), Wuhan, 2015, pp. 51-54. doi: 10.1109/CAC.2015.7382468
27. S. A. Ghamdi and G. D. Fatta, "Efficient Parallel K-Means on MapReduce Using Triangle Inequality," 2017 IEEE 15th Intl Conf on Dependable, Autonomic and Secure Computing, 15th Intl Conf on Pervasive Intelligence and Computing, 3rd Intl Conf on Big Data Intelligence and Computing and Cyber Science and Technology Congress(DASC/PiCom/DataCom/CyberSciTech), Orlando, FL, 2017, pp. 985-992.
doi: 10.1109/DASC-PICom-DataCom-CyberSciTec.2017.163 28. B. Barshan and M. C. Yüksek, ``Recognizing daily and sports activities
in two open source machine learning environments using body-worn sensor units,'' The Computer Journal, 57(11):1649--1667, November 2014.
29. T.H.Sardar and Z. Ansari, “An analysis of mapreduce efficiency in document clustering using parallel K-means algorithm”. Future Computing and Informatics Journal 3(2018) 200-209, https://doi.org/10.1016/j.fcij.2018.03.003
30. https://archive.ics.uci.edu/ml/datasets/daily+and+sports+activities 31. https://archive.ics.uci.edu/ml/machine-learning-databases
/20newsgroups -mld/
AUTHORS PROFILE
Mr. Agnivesh, is working as Assistant Professor in Department of Information Technology, D.A-V P.G. College, Kanpur affiliated to C.S.J.M University, Kanpur.. He is M.Tech. (IT). The author is doing Ph.D. in Information Technology from Amity Institute of Information Technology, Amity University, Lucknow Campus, Uttar Pradesh. His research areas include Big data Analytics, Cloud Computing, IoT and Machine Learning. His papers are published in IEEE and Taylor & Francis International Conferences and Scopus Indexed journals. One of his book chapters is published in IGI Global. The book is Scopus Indexed.
Dr. Rajiv Pandey, Senior Member IEEE is a Faculty at Amity Institute of Information Technology, Amity University, Uttar Pradesh, Lucknow Campus, India. He possesses a diverse back ground experience of around 30 years to include 15 years of Industry and 15 years of academic. His research interests include the contemporary technologies as Semantic Web Provenance, Cloud computing, Big-Data, and Data Analytics. He has been on technical Committees of Various Government and Private Universities. He is intellectually involved in supervising Doctorate Research Scholars and Post graduate Students. He is also an active contributor in professional bodies like IEEE, IET and LMA. He is a member of Machine Intelligence Labs.