International Journal of Innovative Technology and Exploring Engineering (IJITEE) ISSN: 2278-3075, Volume-8 Issue-8 June, 2019
Abstract: There are varied uses of capacitive sensors in the measurement and control systems used in the modern era which include devices such as liquid-level gauges, pressure gauges, accelerometers and precision positioners. In the current work the investigators proposed a capacitive sensor that could detect applied contact forces both in the vertically and horizontally axis. The sensor is built on a flexible material. Metallic electrodes are fixed such that four separate variable capacitors are formed. One of the two sensors has rubber tubes stacked in a two dimensional array sandwiched between two rubber sheets as the dielectric while the other has a layer of foam sandwiched between two rubber sheets. The metallic electrodes used are copper plates. The outcome was a sensor that consisted of four variable capacitors. The signal conditioning circuit consists of CMOS 555 Timers which converts the capacitance to frequency. This frequency is then fed to a Data Acquisition Card (DAQ) which is connected to a PC. The frequency signals are then simulated and the output force is shown. This is done using LabVIEW software. The simulation using LabVIEW provides options for calibration and measurement
Index Terms: Capacitive Sensor, Force Sensor, Pressure Sensor, 3D Force Sensor, Calibration using LabVIEW.
I. INTRODUCTION
Capacitive sensors today are used for a wide range of applications that include among others measurement of liquid-level, pressure, force and load. Therefore, by extension there can also be applications for capacitive sensors acting on three-axis force sensors. By definition a multifunctional sensor is one that is capable of measuring normal force component, its magnitude and the direction of horizontal force components in addition to its readout circuit. It is always possible to improve the sensing property of the sensor by multi-variables [1].
In the present study, five square pieces of conductive material (copper) were fixed on a flexible dielectric material to form four capacitors [2]. Minute changes in the capacitor capacitance when forces are applied on the sensor in the xx, yy and zz axis enable us to fully determine x, y, and z displacement values.
Revised Manuscript Received on June 07, 2019
P. Anantha Christu Raj, Department of Instrumentation Engineering, Karunya Intitute of Technology & Sciences, Coimbatore, India.
P. Ramesh Kumar, Department of Agriculture, Karunya Intitute of Technology & Sciences, Coimbatore, India.
Dayanand Peter, Department of Food Processing Technology, Karunya Intitute of Technology & Sciences, Coimbatore, India.
[image:1.595.308.543.189.232.2]II. HARDWAREDESCRIPTION
Fig. 1 Basic Block diagram
The block diagram as shown in figure 1, consists of Sensor, Signal Conditioning Circuit, DAQ and LabVIEW. The physical input (force) is applied to the sensor. The sensor senses it and produces a change in capacitance which is proportional to the applied force. Now this change in capacitance is given as the input to the signal conditioning circuit. This circuit converts the change in capacitance to varying frequency. This varying frequency is inputted into process compute through DAQ and simulated using LabVIEW software [3,4].
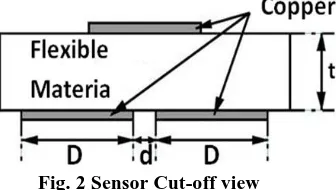
Fig. 2 Sensor Cut-off view
The cut-off view of the developed sensor is given in figure 2. [5] This sensor consists of a flexible dielectric material with four square pieces of conductive material on the top and one square piece of conductive material at the bottom. The thickness of the dielectric material is denoted by t. The width of the square conductive pieces is denoted by D, while the distance between the two square conductive pieces are denoted by d.
A. ZERO APPLIED FORCE SCENARIO
At steady state with zero applied force, the capacitance of the sensor can be calculated as [6]:
Where, - dielectric constant and A - surface area of the parallel-plate capacitor, which can be given as:
Therefore, the capacitance across all four capacitors can be given as:
B. APPLIED FORCE –
ZZ AXIS
Three-Axis Force Measurement Using
Capacitive Sensor for Object Detection
[image:1.595.352.520.383.478.2]Fig. 3 Applied Forces on the zz-axis
The Figure-3.2 shows the sensor when forces are applied on the zz-axis. The Capacitance values in this case can be given as:
Where, z denoted the displacement in the zz-axis. The (-) sign in front of z is attributed to the fact that applied pressure tends to decrease with the thickness of the dielectric material.
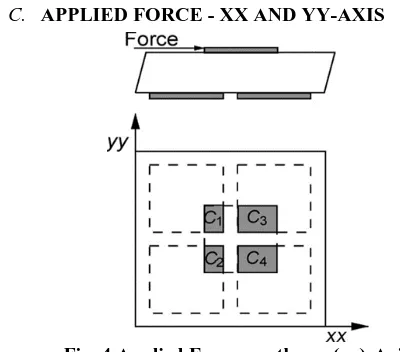
C. APPLIED FORCE - XX AND YY-AXIS
Fig. 4 Applied Forces on the xx (yy)-Axis The Figure-3.3 shows the sensor when forces are applied on the xx and yy axis simultaneously. The capacitances values in this case can be given as:
Where, the displacement across the xx-axis of the square conductive piece on top of the sensor is denoted by x. Similarly, capacitance values for displacement „y‟ across the yy axis can be given as:
III. EXPERIMENTALSETUP
[image:2.595.341.506.223.405.2]The metallic electrodes were formed by sticking very thin Copper plates on rubber sheet using super glue [7,8].
Fig. 5 Copper Plate on Rubber Sheet
[image:2.595.50.250.239.415.2]A. Silicone Rubber (Thickness: 3mm)
Fig. 6 Silicone Rubber Sheet as Dielectric material
Table. 1 Capacitance Force for Silicone Rubber Sheet as Dielectric material at loading & unloading state
Graph. 1 Capacitance Force for Silicone Rubber Sheet as Dielectric material at loading & unloading state It can be interpreted from data shown in table 1 and depicted graphetically in graph 1 that there is heavy hysteresis and permanent change in capacitance for the silicone rubber sheet [9] used as the dielectric material.
[image:2.595.328.539.443.588.2]International Journal of Innovative Technology and Exploring Engineering (IJITEE) ISSN: 2278-3075, Volume-8 Issue-8 June, 2019
[image:3.595.49.280.42.545.2]Fig. 7 Natural Rubber Sheet as Dielectric material
Table. 2 Capacitance Force for Natural Rubber Sheet as Dielectric material at loading & unloading state
Graph. 2 Capacitance Force for Natural Rubber Sheet as Dielectric material at loading & unloading state Data as recorded in table 2 and graphetically represented in graph 2 shows heavy hysteresis and no permanent change in capacitance for the natural rubber sheet used as the dielectric material.
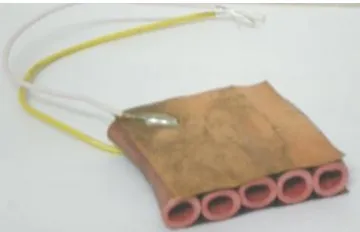
C. Rubber Tubes [Single Layer of Single Axis (SLSA)
Array] as Dielectric Material.
Metallic electrodes are formed by sticking very thin Copper plates on a single layer of single axis array of rubber tubes using super glue.
[image:3.595.334.514.49.165.2]Fig. 8 SLSA Array of Rubber Tubes as Dielectric Material
C.1 Natural Rubber Tubes (ID=7mm, OD=12mm)
[image:3.595.311.538.190.641.2]Fig. 9 SLSA Array of Natural Rubber Tubes as Dielectric material
Table. 3 Capacitance Force for SLSA Array of Natural Rubber Tubes as Dielectric material
Graph. 3 Capacitance Force for SLSA Array of Natural Rubber Tubes as dielectric material at loading & unloading state
Observations as recorded in table 3 and graph 3 show negligible hysteresis and no permanent change in capacitance. However non linearity and resistance to compressive forces are observed.
[image:3.595.83.245.684.739.2]Fig. 10 SLSA Array of Silicone Rubber Tubes (ID=5mm, OD=8mm) as Dielectric Material
Table. 4 Capacitance Force for SLSA Array of Silicone Rubber Tubes (ID=5mm, OD=8mm) as Dielectric material at loading & unloading state
Graph. 4 Capacitance Force for SLSA Array of Silicone Rubber Tubes (ID=5mm, OD=8mm) as Dielectric material at loading & unloading state
Observations show negligible hysteresis and no permanent change in capacitance. However non linearity and resistance to compressive forces are observed.
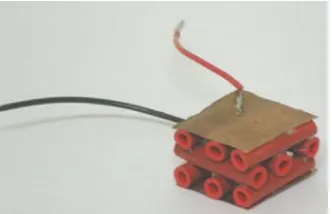
[image:4.595.55.284.52.172.2]C3. Silicone Rubber Tubes (ID=3mm, OD=6mm)
Fig. 11 SLSA Array of Silicone Rubber Tubes (ID=3mm, OD=6mm) as Dielectric Material
Table. 5 Capacitance Force for SLSA Array of Silicone Rubber Tubes (ID=3mm, OD=6mm) as Dielectric material at loading & unloading state
Graph. 5 Capacitance Force for SLSA Array of Silicone Rubber Tubes (ID=3mm, OD=6mm) as Dielectric material at loading & unloading state
Observations show no hysteresis and no permanent change in capacitance. However non linearity and resistance to compressive forces are observed.
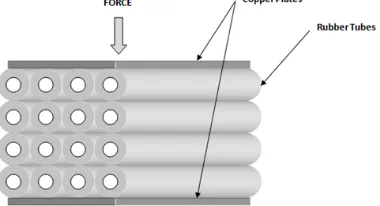
D. Rubber Tubes [Multiple Layers of Single Axis
(MLSA) Array] As Dielectric Material
Metallic electrodes are formed by sticking very thin Copper plates on a multiple layers of single axis array of rubber tubes using super glue.
[image:4.595.305.552.250.399.2] [image:4.595.344.534.553.656.2] [image:4.595.73.250.618.746.2]International Journal of Innovative Technology and Exploring Engineering (IJITEE) ISSN: 2278-3075, Volume-8 Issue-8 June, 2019
[image:5.595.334.500.50.157.2]D1. Silicone Rubber Tubes (ID=5mm, OD=8mm)
[image:5.595.81.251.59.169.2]Fig. 13 MLSA Array of Silicone Rubber Tubes (ID=5mm, OD=8mm) as Dielectric Material
Table. 6 Capacitance Force for MLSA Array of Silicone Rubber Tubes (ID=5mm, OD=8mm) as Dielectric material at loading & unloading state
Graph. 6 Capacitance Force for MLSA Array of Silicone Rubber Tubes (ID=5mm, OD=8mm) as Dielectric material at loading & unloading state
Observations show no hysteresis and no permanent change in capacitance. However non linearity and resistance to lateral compressive force are observed.
E. Rubber Tubes [Multiple Layers of Double Axis
(MLDA) Array] as Dielectric Material
Fig. 14 MLDA Array of Rubber Tubes as Dielectric Metallic electrodes are formed by sticking very thin Copper plates on a multiple layers of double axes array of rubber tubes using super glue.
E1. Silicone Rubber Tubes (ID=3mm, OD=6mm)
Fig. 15 MLDA Array of Silicone Rubber Tubes (ID=3mm, OD=6mm) as Dielectric Material
Table. 7 Capacitance Force for MLDA Array of Silicone Rubber Tubes (ID=3mm, OD=6mm) as Dielectric material at loading & unloading state
Graph. 7 Capacitance Force for MLDA Array of Silicone Rubber Tubes (ID=3mm, OD=6mm) as Dielectric material at loading & unloading state
Observations show no hysteresis and no permanent change in capacitance. However non linearity and lower resistance to compressive forces are observed. Multiple layers of double axes arrays however do not provide suitable surfaces to support metallic electrode plates.
F. Rubber Tubes (MLDA Array) Sandwiched Between
[image:5.595.46.286.65.499.2]Rubber Sheets as Dielectric Material
Fig. 16 MLDA Array of Rubber Tubes sandwiched between Rubber sheets as Dielectric Material
[image:5.595.58.269.589.723.2]rubber tubes sandwiched between Silicone rubber sheets (thickness=3mm) using super glue.
[image:6.595.332.487.50.181.2]F1. Silicone Rubber Tubes (ID=5mm, OD=8mm)
[image:6.595.63.265.73.197.2]Fig. 17 MLDA Array of Silicone Rubber Tubes (ID=5mm, OD=8mm) sandwiched between Rubber sheets as Dielectric Material
Table. 8 Capacitance Force for MLDA Array of Silicone Rubber Tubes (ID=5mm, OD=8mm) sandwiched between Rubber sheets as Dielectric material at loading & unloading state
Graph. 8 Capacitance Force for MLDA Array of Silicone Rubber Tubes (ID=5mm, OD=8mm) sandwiched between Rubber sheets as Dielectric material at loading & unloading state
Observations show heavy hysteresis and no permanent change in capacitance. Non linearity and low resistance to compressive forces are observed.
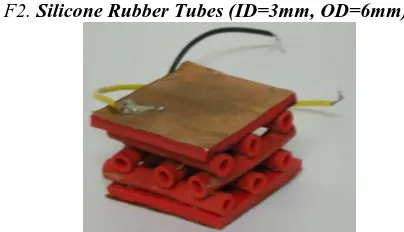
[image:6.595.314.546.236.377.2]F2. Silicone Rubber Tubes (ID=3mm, OD=6mm)
Fig. 18 MLDA Array of Silicone Rubber Tubes (ID=3mm, OD=6mm) sandwiched between Rubber sheets as Dielectric Material
Table. 9 Capacitance Force for MLDA Array of Silicone Rubber Tubes (ID=3mm, OD=6mm) sandwiched between Rubber sheets as Dielectric material at loading & unloading state
Graph. 9 Capacitance Force for MLDA Array of Silicone Rubber Tubes (ID=3mm, OD=6mm) sandwiched between Rubber sheets as Dielectric material at loading & unloading state
Observations show no hysteresis and no permanent change in capacitance. Less non linearity and lower resistance to compressive forces are observed.
IV. SIMULATIONANDIMPLEMENTATIONUSING
LABVIEW
The varying frequency output equivalent to the varying capacitance of the sensor is fed to the PC through DAQ [10,11]. The Average Frequency sub VI consists of a Counter VI which gives the frequency value at an instance and Average Frequency VI which gives the average of the frequencies corresponding to the four capacitors of the sensor. The Reset VI resets all global and local variables before the initial running of all the VIs. Mode Selector is a Rocker switch which provides for the selection between Calibration mode and Measurement mode. Calibration mode consists of Data Acquisition VI which collects frequencies corresponding to known forces applied and Calibration VI finds the slope and y-intercept of the linearized curve between known forces and corresponding frequencies. Measurement mode allows finding the applied unknown force.
V. CONCLUSION
The capacitive sensor developed as part of the experimental setup was capable of detecting both applied vertical force and horizontal contact forces. It consisted of four capacitors printed on
[image:6.595.55.257.619.735.2]International Journal of Innovative Technology and Exploring Engineering (IJITEE) ISSN: 2278-3075, Volume-8 Issue-8 June, 2019
of the capacitor while forces were applied on the x,y,z axis was measured by displacement values. The sensor with Multiple Layers of Double Axes Array of Silicone Rubber Tubes (ID=3mm, OD=6mm) sandwiched between Silicone Rubber Sheets (thickness=3mm) as Dielectric measures the forces (0.0kgf to 1.0kgf) with an error range of -0.09kgf to +0.03kgf. The signal conditioning circuit can be implemented for monitoring more than one capacitive variation. The LabVIEW implementation with the capability of calibration can be implemented with any other sensors.
REFERENCES
1. A. Pelamatti, V. Goiffon, M. Estribeau, P. Cervantes and P. Magnan, "Estimation and Modeling of the Full Well Capacity in Pinned Photodiode CMOS Image Sensors," in IEEE Electron Device Letters, vol. 34, no. 7, pp. 900-902, July 2013.
2. R. Matsuzaki and A. Todoroki, “Wireless flexible capacitive sensor based on ultra-flexible epoxy resin for strain measurement of automobile tires,” Sens. Actuators A, Phys., vol. 140, no. 1, pp. 32–42, Oct. 2007. 3. W. Bracke, P. Merken, R. Puers, and C. Van Hoof, “Design methods and
algorithms for configurable capacitive sensor interfaces,” Sens. Actuators A, Phys., vol. 125, no. 1, pp. 25–33, Oct. 2005.
4. P. Bruschi, D. Navarrini, G. Barillaro, and A. Gola, “A precise capacitance-to-pulse width converter for integrated sensors,” Analog Integr. Circuits Signal Process., vol. 42, no. 2, pp. 185–189, Jan. 2005. 5. Jose Gerardo Vieira da Rocha, Pedro Filipe Antunes da Rocha and Senentxu Lanceros-Mendez, "Capacitive Sensor for Three-Axis Force Measurements and Its Readout Electronics", IEEE Transactions on Instrumentation and Measurement, Vol. 58, No. 8, August 2009. 6. O. P. Thakur and Anjani Kumar Singh, "Modeling of Capacitive Sensor
filled with Elastic Dielectrics and its Advantages",3rd International Conference on Sensing Technology, Nov. 30 - Dec. 3,2008, Tainan, Taiwan.
7. A. Nafari, F. A. Ghavanini, M. Bring, K. Svensson, and P. Enoksson, “Calibration methods of force sensors in the micro-Newton range,” J. Micromech. Microeng., vol. 17, no. 10, pp. 2102–2107, Oct. 2007. 8. B. Maria Angeline Shiny, A. Swetha Deborah, Kalyani Durishetty and
D. Sivaranjani, “U-tube Manometer Calibration using ANFIS”, Project report submitted to Department of Electronics and Instrumentation Engineering, Karunya University for the year 2007-2008.
9. C. Metzgera, E. Fleisch, J. Meyer, M. Dansachmüller, I. Graz, M. Kaltenbrunner, C. Keplinger, R. Schwödiauer, and S. Bauerb, “Flexible-foam-based capacitive sensor arrays for object detection at low cost,” Appl. Phys. Lett., vol. 92, no. 1, p. 013 506, Jan. 2008. 10. Z. Ignjatovic and M. F. Bocko, “An interface circuit for measuring
capacitance changes based upon capacitance-to-duty cycle (CDC) converter,” IEEE Sensors J., vol. 5, no. 3, pp. 403–410, Jun. 2005. 11. M. Gasulla, X. Li, and G. C. M. Meijer, “The noise performance of a
highspeed capacitive-sensor interface based on a relaxation oscillator and a fast counter,” IEEE Trans. Instrum. Meas., vol. 54, no. 5, pp. 1934–1940, Oct. 2005.
AUTHORSPROFILE
Mr. P.Anantha Christu Raj, Assistant Professor from Karunya University, completed Bachelor of Engineering in Electrical and Electronics Engineering and Master of Engineering in Control and Instrumentation from St.Xavier catholic college of engineering, Nagercoil in the year 2006 and 2008 respectively. Currently pursuing Ph.D in Energy saving optimization in Anna University. His areas of Interest are Control system and signal processing. He has published 3 international journals and 10 international conferences.
P. Ramesh Kumar Ph.D (Biotechnology) works in the key research areas of plant physiology and anti-diabetic drug discovery from plant sources at the Department of Agriculture, Karunya Institute of Technology & Sciences, Coimbatore.
Dayanand Peter M.Tech (Agricultural Process &