RESEARCH NOTE
Analysis of erroneous data entries in paper
based and electronic data collection
Benedikt Ley
1*, Komal Raj Rijal
2, Jutta Marfurt
1, Naba Raj Adhikari
2, Megha Raj Banjara
2,
Upendra Thapa Shrestha
2, Kamala Thriemer
1, Ric N. Price
1,3,4and Prakash Ghimire
2Abstract
Objective: Electronic data collection (EDC) has become a suitable alternative to paper based data collection (PBDC) in biomedical research even in resource poor settings. During a survey in Nepal, data were collected using both sys-tems and data entry errors compared between both methods. Collected data were checked for completeness, values outside of realistic ranges, internal logic and date variables for reasonable time frames. Variables were grouped into 5 categories and the number of discordant entries were compared between both systems, overall and per variable category.
Results: Data from 52 variables collected from 358 participants were available. Discrepancies between both data sets were found in 12.6% of all entries (2352/18,616). Differences between data points were identified in 18.0% (643/3580) of continuous variables, 15.8% of time variables (113/716), 13.0% of date variables (140/1074), 12.0% of text variables (86/716), and 10.9% of categorical variables (1370/12,530). Overall 64% (1499/2352) of all discrepancies were due to data omissions, 76.6% (1148/1499) of missing entries were among categorical data. Omissions in PBDC (n = 1002) were twice as frequent as in EDC (n = 497, p < 0.001). Data omissions, specifically among categorical variables were identified as the greatest source of error. If designed accordingly, EDC can address this short fall effectively.
Keywords: Electronic data entry, Paper based data entry, AKVO, Epidata
© The Author(s) 2019. This article is distributed under the terms of the Creative Commons Attribution 4.0 International License
(http://creat iveco mmons .org/licen ses/by/4.0/), which permits unrestricted use, distribution, and reproduction in any medium,
provided you give appropriate credit to the original author(s) and the source, provide a link to the Creative Commons license, and indicate if changes were made. The Creative Commons Public Domain Dedication waiver (http://creativecommons.org/ publicdomain/zero/1.0/) applies to the data made available in this article, unless otherwise stated.
Introduction
Paper-based case report forms (CRF) are the most widely used form of data collection in field-based research stud-ies. In this approach data collected are recorded on paper and subsequently digitalized. While straight forward to implement, paper-based data systems risks introduc-ing errors both at the time of data collection and durintroduc-ing digitalization.
Electronic data collection (EDC) has become a well-accepted alternative to paper-based data collection (PBDC), reducing the risk of errors and allowing real time checks for completeness and logical consistency [1–3].
Both PBDC and EDC are prone to inaccuracy through erroneous data entry and data omissions [4]. Data
collected during a hospital-based survey in Nepal were recorded on paper and in electronic form. This article analyses the patterns in data entry errors among both systems.
Main text
Procedures
The study was conducted at a hospital in Danghadi, in the East of the country. Patients were screened and eli-gible patients invited to participate. Following writ-ten informed consent, each participant was assigned a study identification number (CODE). A questionnaire was completed and a brief physical examination made, the results of which were recorded in the presence of the patient. Venous blood was collected and shipped to a collaborating laboratory for subsequent analysis. Data were generated and recorded at two time-points, in the presence of the patient and in the laboratory. For EDC, two distinct databases were created one for data collected with the patient, one for the corresponding laboratory
Open Access
*Correspondence: [email protected]
1 Global and Tropical Health Division, Menzies School of Health Research and Charles Darwin University, Darwin, Australia
CRF and later entered into a single database. The same staff performed PBDC and EDC, all had at minimum a high-school degree, none had previous experience in electronic data collection.
The EDC system was designed using open-source soft-ware from AKVO (NL; https ://akvo.org/, last accessed on 11.07.2019). Data were entered on tablets (Galaxy Tab a 7.0 SM T285, Samsung, Seoul, South Korea). Each study participant was assigned with two identifiers: a database specific unique identifier provided automatically through the system, and another assigned by the data collector (CODE). The system did not check for the uniqueness of the assigned CODE. During data entry, the custom-made data entry mask performed completeness and range checks, erroneous results were indicated to the data entry clerk at time point of entry, however, data entry could proceed even in case of unresolved errors. The system could not detect logic errors nor calendar related errors, such as enrolment before date of birth. All entered data were uploaded immediately upon data entry via Wi-Fi into a cloud based database and could be monitored by a third person in real time.
For the PBDC data entry, CRFs were completed and digitalized within 7 days using EpiData version 3.1 (Epi-Data Association, Odense, Denmark) [5]. This version is no longer supported, however offers the possibility for logic, range, and date checks. The data entry system was designed so that CODE could not be assigned more than once. In all other cases, the system highlighted detected errors during data entry by prompting the data entry clerk through a pop-up window and an acoustic signal. Like the EDC, data entry could proceed despite the erro-neous entry. While technically possible, the system was not designed to prompt the data entry clerk in case a var-iable was not entered.
Data analysis
Once data entry was completed, digitalized data were exported to Excel (Microsoft, Redmond, USA) and the hospital and lab database from EDC were merged using the patients’ identifier (CODE). The following errors were checked: completeness of variable entry, values outside of realistic ranges, internal logic violations in a subset of variables, and dates outside a reasonable time frames. In the absence of a reference method, results were com-pared from both databases using CODE as the match-ing variable. The database was rebuilt codmatch-ing concordant variable entries as “0” and discordant entries as “1”. Each variable was categorized as text, continuous, categorical, date, or time variables.
Statistical analysis was done using Stata version 14 (Stata Corp, USA). Differences in proportions were
for correlated proportions as appropriate.
The number of discordant entries were compared between both systems, overall and per variable category, and whether the proportion of discordant results dif-fered between lab and field data entry. Among discord-ant results, missing entries and out of range results were quantified and compared between both systems. Missing data were assessed for missing data mechanisms, the only patient specific variable included was sex [6]. Among non-missing discordant continuous variables, the abso-lute difference was calculated between both entries and expressed as a fraction of the higher entry in percent (%). As a proxy for logical errors among discordant results, we determined whether date of birth was after date of enrol-ment and calculated the body mass index (BMI) from body weight and height for all participants [7]. A BMI above 40 or below 12 was defined as unrealistic irrespec-tive of the participants age.
Results
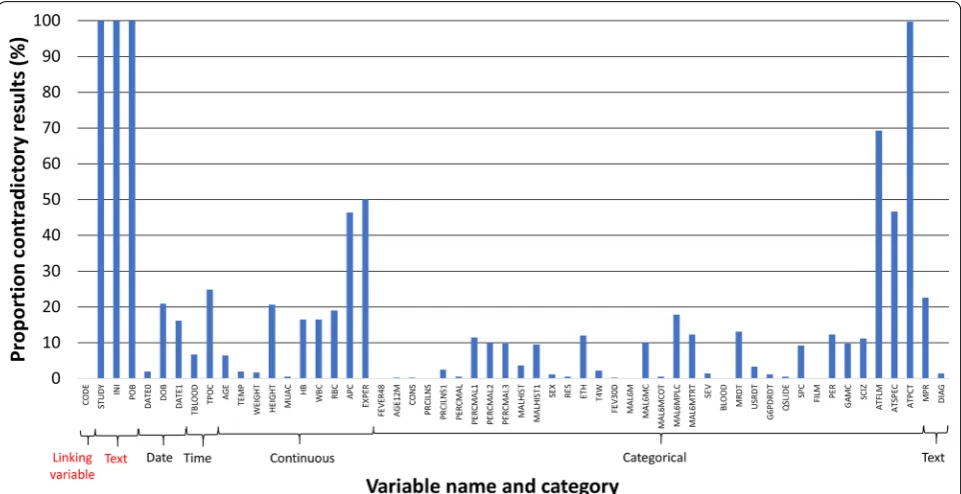
Data were collected from 362 patients. The EDC database contained a duplication of the unique identifier (CODE) in two cases, accordingly four participants were excluded from both databases, resulting in 358 (98.9%) participants with paired data collected by both systems. Each data set contained 56 variables (Additional file 1: Table S1). A total of 4 (7.1%) variables were excluded from this analy-sis: the variable “CODE” as this was the linking variable between datasets, “Study Name” (STUDY) since this was autocompleted among both systems, “Patient Initials” (INI) and “Place of Birth” (POB) as these were entered as free text and had to be translated from Devanagari to Roman letters. From the 52 (92.9%) included variables, a total of 3 (5.8%) variables contained dates, 2 (3.8%) vari-ables recorded a specific time (in 24-h format), 10 (19.2%) variables contained continuous data, 35 (67.3%) vari-ables contained categorical data and 2 (3.8%) varivari-ables contained text where it was assumed that data collectors would know the correct spelling of all possible answers in Roman letters (“Diagnosis-DIAG” and “Main Place of Residence-MPR”, Additional file 1: Table S1).
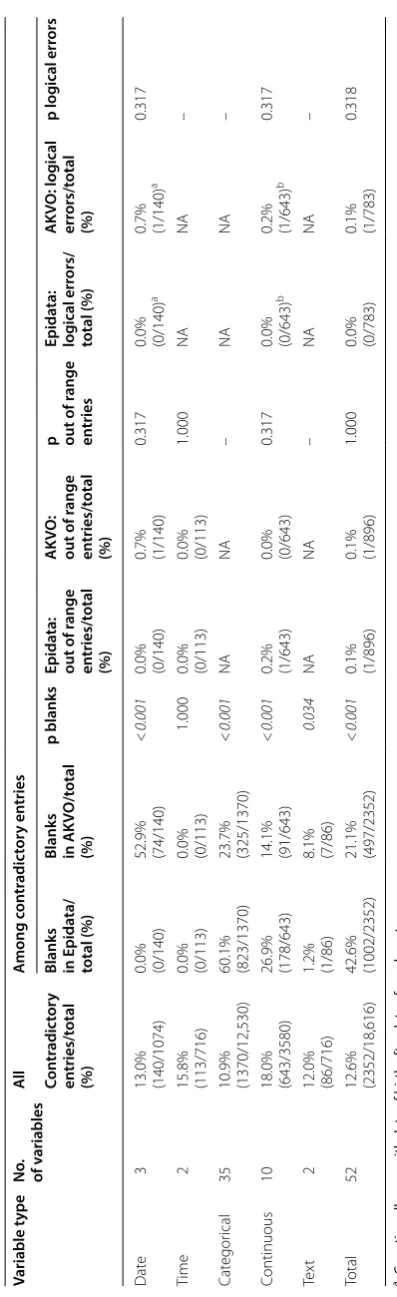
Discrepancies between both data sets were found in 12.6% (2352/18,616) of all entries, with differences between databases detected in 18.0% (643/3580) of con-tinuous variables, 15.8% (113/716) of time variables, 13.0% (140/1074) of date variables, 12.0% (86/716) text variables, and 10.9% (1370/12,530) of categorical vari-ables (Table 1 and Fig. 1).
Table 1 O ver vie w of discr epan t r
esults among all da
ta en ter ed , and among discr epan t r esults: numb er of blanks , out of r ange en tries and lo gic al err ors
a C
oun
ting all cases with da
te of bir
th af
ter da
te of enr
olmen
t
b C
oun
ting all cases with a BMI
<
12 or BMI
>
40 among discr
epan t r esults Variable t ype No . of v ariables Al l A mong c on tr adic tor y en tries Con tr adic tor y en tries/t otal (%)
Blanks in Epida
ta/
total (%)
Blanks in AK
VO/t otal (%) p blanks Epida ta: out of r ange en tries/t otal (%) AK VO: out of r ange en tries/t otal (%)
p out of r
[image:3.595.214.413.80.730.2]followed by continuous variables (17.9%, 269/1499), dates (4.9%, 74/1499, all in the EDC) and text vari-ables (0.5%, 8/1499). Overall 66.8% (1002/1499) of data were omitted from PBDC/Epidata method compared to 33.2% (497/1499) of data entered in the EDC database (p < 0.001). Significantly higher proportions of omis-sions were found in the PBDC database among categor-ical and continuous variables, date and text variables had significantly higher proportions of missing entries in the EDC database (all p < 0.05) (Table 1). When con-sidering data omissions that were found in both sys-tems, the proportion of missing data was slightly higher among females (n = 1949/5695, 25.5%) compared to males (n = 2521/8451, 23.0%), p < 0.001.
While designed to tolerate data omissions, this was not desirable. Depending on variable format, entries “0”, “9” and “99” should have been entered in case data was not available, a question was not relevant or a test result was negative. In 42% (624/1499) of all discordant blanks found in the PBDC database only, a respective entry was found in the EDC database, while the oppo-site was the case in 3% (44/1499) of records (p < 0.01). Among discordant entries, one date entry in the EDC database and one continuous variable in the PBDC database were found to be out of range, one logical error among discordant date variables and one among discordant continuous variables was found within the EDC database (Table 1).
Among the 10 continuous variables, the median rela-tive difference between entries ranged from 1.0% (inter-quartile range (IQR): 0.39–1.00, range 0.20–1.94) for measured body temperature (TEMP) to 55.1% (IQR: 34.09–76.46, range 2.44–95.33) for malaria parasite count per white blood cells (APC).
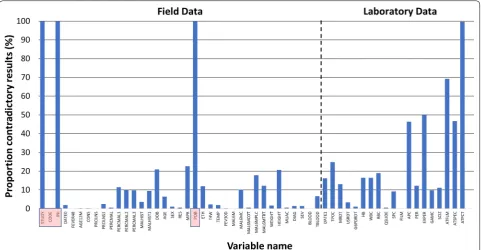
A total of 33 variables were collected with the patient present, with discordant entries present in 5.8% (685/11,814), significantly fewer (p < 0.001) than among the 19 variables collected in the laboratory where 24.5% (1667/6802) of all entries differed between both systems (Fig. 2). The observed difference was applicable to all relevant categories (all p < 0.05), with 3.2% (374/11,814) blanks generated for the patient data and 16.6% (1130/6802) for the laboratory data; p < 0.001.
Discussion and conclusion
[image:4.595.58.539.88.335.2]from a “missing not at random” (MNAR) pattern [6]. Both systems provided the possibility to enter a nega-tive response reflecting that data had not been collected rather than leaving variables blank, however this was frequently not applied and at significantly greater pro-portion in the PBDC system. Data omissions were found most frequently among categorical data, which were entered by ticking a box on the paper form and then dur-ing digitalization by enterdur-ing a sdur-ingle digit from a drop-down menu in Epidata or by ticking a box in the AKVO system. Accordingly, categorical data are easy and fast to enter, but result in an increased risk of data omission, especially when data are entered in bulk, as was the case for the PBDC method.
Whilst continuous data showed the greatest overall rate of discrepant results, this was much more likely to be due to erroneous data entry than omission. Discrepant results varied substantially between variables. For instance, body temperature showed a median variation of 1% between both entries, whereas for the parasite count the differ-ence rose to more than 50%. Since both systems only allow data entry within predefined ranges, the number of unrealistic results was very low. We found that range checks for continuous data were counterproductive as they masked erroneous data entry: while an erroneous date entry outside a reasonable range is detected quite easily, range checks would not permit extreme entries, masking errors. Double data entry could address this
problem; however, this is neither practical nor realistic for EDC.
Epidata allowed for internal logic checks at the time of data entry, not possible in the AKVO system. The BMI was calculated and used as a proxy for logical errors, however there were very few unrealistic entries in either data systems. Dates were also checked for unlogic sequences, but this was not a major source of error. Inter-estingly all date omissions were found in the EDC.
An inherent problem of any EDC system is data col-lection for the same individual at different time points, as is the case for studies with follow up visits or studies with field and laboratory components. Where collected data cannot be uploaded directly, subsequent merging of data can be problematic. We found discordant results for variables generated in the laboratory to be signifi-cantly greater than for variables generated in the clinic. When assessing the pattern of erroneous entries in the laboratory (Additional file 1: Table S1), errors occurred in sequential blocks, which may reflect that the participant identifier (CODE) for the EDC data had been assigned erroneously in the laboratory. Alternatively, the quality of data entry may vary between the clinical and the labora-tory staff, highlighting the importance for adequate train-ing of all study personnel.
[image:5.595.58.540.88.338.2]that EDC is cost effective, at least in large studies [2, 10]. In conclusion, we found the greatest source of data error was attributable to data omissions, specifically among categorical variables. Data omissions appeared to be following a MNAR pattern and this needs to be addressed in a twofold approach. A well-designed EDC system that does not permit blank entries can address omission of recorded data, extensive training of data col-lection staff in hindsight to the socio-cultural context is likely to improve the quality of data collection. Since direct electronic data collection is unlikely to be per-formed in duplicate, a system that performs real-time logic checks would be highly desirable. EDC, however, may only be suitable if data can be synchronized in real time and can be accessed from multiple locations, which requires a fairly complex preparatory phase and this may not be cost effective for small studies.
Limitations
In the absence of a reference method we could not deter-mine the quality of data entry per system directly. We also did not record the identity of the data entry staff per case record and accordingly could not assess differences in data entry quality per staff.
Additional file
Additional file 1: Table S1. Database coded as discrepant (1) and
con-cordant (0) data entries.
Abbreviations
BMI: body mass index; CRF: case record form; EDC: electronic data collection; MNAR: missing not at random; PBDC: paper based data collection.
Acknowledgements
We would like to thank all participants, as well as all staff members that con-tributed to this study.
Authors’ contributions
PG implemented the study and conducted data collection, BL analyzed data and wrote the first draft, KRR, JM, MRB, NRA, UTS, CG, KP, KT, RNP and PG revised the manuscript and provided scientific advice. All authors read and approved the final manuscript.
Funding
This study was funded by Bill and Melinda Gates Foundation (OPP1054404 and OPP1164105). The AKVO software was developed and provided free of charge through AKVO (NL, https ://akvo.org/). BL, KT and JM are also funded by the Australian Department of Foreign Affairs and Trade, RNP is funded by the Wellcome Trust (Senior Fellowship in Clinical Science, 200909). No funding bodies had any role in study design, data collection and analysis, decision to publish, or preparation of the manuscript.
Data availability
All relevant data are in Additional file 1.
obtained from the Human Research Ethics Committee of the Northern Terri-tory, Darwin, Australia (HREC17-3004) and the Nepal Health Research Council (Reg. no. 60/2018). Consent for participation was collected from all partici-pants during enrolment and before data and sample collection.
Consent for publication
Consent to publish results in an anonymized way was collected during enrolment.
Competing interests
The authors declare that they have no competing interests.
Author details
1 Global and Tropical Health Division, Menzies School of Health Research and Charles Darwin University, Darwin, Australia. 2 Central Depart-ment of Microbiology, Tribhuvan University, Kirtipur, Kathmandu, Nepal. 3 Mahidol-Oxford Tropical Medicine Research Unit (MORU), Faculty of Tropical Medicine, Mahidol University, Bangkok, Thailand. 4 Centre for Tropical Medicine and Global Health, Nuffield Department of Clinical Medicine, University of Oxford, Oxford, UK.
Received: 24 July 2019 Accepted: 13 August 2019
References
1. McLean E, Dube A, Saul J, Branson K, Luhanga M, Mwiba O, et al. Implementing electronic data capture at a well-established health and demographic surveillance site in rural northern Malawi. Glob Health Action. 2017;10(1):1367162.
2. Flaxman AD, Stewart A, Joseph JC, Alam N, Alam SS, Chowdhury H, et al. Collecting verbal autopsies: improving and streamlining data collection processes using electronic tablets. Popul Health Metro. 2018;16(1):3. 3. Lane SJ, Heddle NM, Arnold E, Walker I. A review of randomized
controlled trials comparing the effectiveness of hand held computers with paper methods for data collection. BMC Med Inform Decis Mak. 2006;6:23.
4. Walther B, Hossin S, Townend J, Abernethy N, Parker D, Jeffries D. Com-parison of electronic data capture (EDC) with the standard data capture method for clinical trial data. PLoS ONE. 2011;6(9):e25348.
5. Kumar AM, Naik B, Guddemane DK, Bhat P, Wilson N, Sreenivas AN, et al. Efficient, quality-assured data capture in operational research through innovative use of open-access technology. Public Health Action. 2013;3(1):60–2.
6. Papageorgiou G, Grant SW, Takkenberg JJM, Mokhles MM. Statistical primer: how to deal with missing data in scientific research? Interact Cardiovasc Thorac Surg. 2018;27(2):153–8.
7. Nuttall FQ. Body Mass Index: obesity, BMI, and Health: a critical review. Nutr Today. 2015;50(3):117–28.
8. Ahmed R, Robinson R, Elsony A, Thomson R, Squire SB, Malmborg R, et al. A comparison of smartphone and paper data-collection tools in the Burden of Obstructive Lung Disease (BOLD) study in Gezira state, Sudan. PLoS ONE. 2018;13(3):e0193917.
9. Njuguna HN, Caselton DL, Arunga GO, Emukule GO, Kinyanjui DK, Kalani RM, et al. A comparison of smartphones to paper-based questionnaires for routine influenza sentinel surveillance, Kenya, 2011–2012. BMC Med Inform Decis Mak. 2014;14:107.
10. King JD, Buolamwini J, Cromwell EA, Panfel A, Teferi T, Zerihun M, et al. A novel electronic data collection system for large-scale surveys of neglected tropical diseases. PLoS ONE. 2013;8(9):e74570.
Publisher’s Note