A National Statistics publication
Statistical First Release
Early years foundation stage profile attainment by
pupil characteristics, England 2014
Reference SFR46/2014
Date 20 November 2014
Coverage England
Theme Children, Education and Skills
Issued by Department for Education, Sanctuary Buildings, Great Smith Street, London SW1P 3BT
Press office 020 7783 8300
Public enquiries 0370 000 2288
Statistician Sally Marshall
Phone 0114 2742317
Email Sally.marshall@education.gsi.gov.uk
Internet Statistics: early years foundation stage profile
Increase in the
proportion of boys and girls achieving a GLD.
… no change in gender attainment gap.
As reported in SFR39/2014, 60% of pupils achieved a good level of development (GLD) in the EYFSP profile. This is an increase of 9 percentage points when compared with 52% in 2013.
Girls continue to outperform boys with the attainment gap remaining at 16 percentage points.
Increase in FSM pupil’s attainment
…the FSM gap remains at 19 percentage points.
The proportion of pupils eligible for free school meals (FSM) achieving a GLD has increased from 36% in 2013 to 45% in 2014. The FSM attainment gap remains at 19 percentage points. The FSM attainment gap remains widest in the literacy areas of learning.
Autumn born children outperform children born in either the spring or the summer.
Of pupils born in the autumn term, 71% achieved a GLD compared with 49% of those pupils born in the summer, a 22 percentage point attainment gap, marginally lower than in 2013.
Widening of SEN attainment gap.
Contents
1. Background ... 2
2. Attainment by pupil characteristic (national tables 1-3) ... 3
Gender ... 3
Ethnicity ... 6
English as a first language ... 8
Free school meal (FSM) eligibility ... 9
Month of birth ... 11
Special educational needs (SEN) ... 12
3. Local authority results (local authority tables 4 to 7) ... 13
4. Accompanying tables ... 14
5. National Statistics ... 15
6. Technical information: ... 16
Assessment scales and indicators ... 16
Methodology and quality ... 17
Data sources ... 18
Coverage ... 19
7. Further information ... 19
8. Got a query? Like to give feedback? ... 20
1.
Background
This statistical first release (SFR) builds upon figures in SFR39/2014 Early years foundation stage profile (EYFSP) results, 2014 published on 16th October by focusing on differences in achievement for each of the pupil characteristics. Final 2014 EYFSP information is presented by gender, ethnicity, English as a first language, free school meal eligibility, month of birth and special educational need. This publication also includes characteristics breakdown at local authority (LA) level and pupil residency tables showing key indicators by the income deprivation affecting children index (IDACI) and local authority district (LAD).
These statistics are important as they report progress towards narrowing attainment gaps for disadvantaged groups.
The following supporting tables are included as part of the SFR:
National and LA tables SFR46/2014 (excel .xls)
Underlying data SFR46/2014 (open format .csv and metadata .txt)
The following quality and methodology documents accompany the SFR and provide information on the data sources, their coverage, the quality and how the data is validated and processed:
Methodology document and quality and uses of data, SFR39/2014 (published alongside the headline statistics on 16th October 2014).
which runs from June to August and collates teacher assessments of children’s development at the end of the EYFS (the end of the academic year in which the child turns five).
Early years foundation stage profile (EYFSP)
A revised EYFSP was introduced in 2013, and requires practitioners to make a best fit assessment of whether children are emerging, expected or exceeding against 17 early learning goals (ELGs) (see methodology document for further information on the ELGs).
Children have been deemed to have reached a good level of development (GLD) in the new
profile if they achieve at least the expected level in the ELGs in the prime areas of learning (personal, social and emotional development; physical development; and communication and language) and in the specific areas of mathematics and literacy. These are 12 of the 17 ELGs.
There is also a supporting measure which measures the total number of points achieved across all 17 ELGs and reports the average of every child’s total point score(APS). See section 6.
The following sections report where the largest and smallest attainment gaps exist for each of the characteristics in turn, and look at how these have changed compared with the previous year. The attainment gaps compare the percentage of pupils with and without a particular characteristic achieving the measure stated. Commentary focuses on differences in the percentages of pupils achieving a GLD.
All gaps and differences have been calculated on unrounded data therefore some figures may not add up in this text.
Readers are reminded that some characteristics groups have small numbers of eligible pupils so comparisons should be treated with caution.
2.
Attainment by pupil characteristic
(national tables 1-3)Gender
Increase in the
proportion of boys and girls achieving a GLD.
… no change in gender attainment gap.
69% of girls achieved at least the expected level in the prime areas of learning and in the specific areas of mathematics and literacy needed to achieve a good level of development compared with 52% of boys.
Both the proportion of girls and boys reaching a GLD increased by 9 percentage points since 2013 and the gender attainment gap remains at 16 percentage points.
Gender gap widest in writing
…narrowest in technology
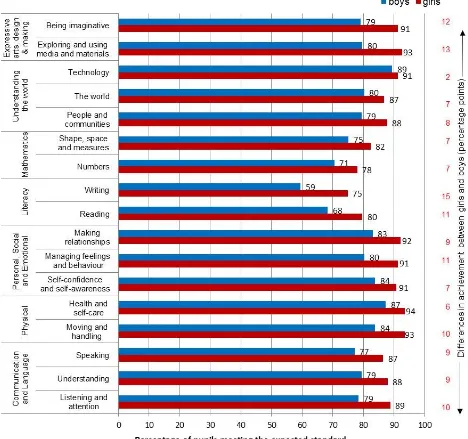
Looking at the 17 early learning goals, the gap between the proportion of girls and boys achieving at least the level expected remains widest in writing where the gender attainment gap is 15 percentage points.
Table A: Headline indicators by gender
Percentage of EYFSP pupils achieving at least the expected level in all ELGs, achieving a GLD and the average point score by gender, 2013-2014
% achieving at least the expected level in
all ELGs % achieving a GLD average point score
all pupils 58% 60% 33.8
girls 67% 69% 35.1
boys 50% 52% 32.6
attainment gap 17ppts 16ppts 2.5
Table B: Time series of GLD by gender
Percentage of pupils achieving a good level of development by gender, 2013 – 2014
All pupils girls boys
GLD attainment gap
2014 60% 69% 52% 16 ppts
2013 52% 60% 44% 16 ppts
Figure 1: 17 ELGs by gender
Ethnicity
The percentage of pupils achieving a good level of development and the expected level in each ELG continues to vary between different ethnic groups. The overall pattern remains as seen in 2013.
White pupils and those of mixed ethnicity perform above average
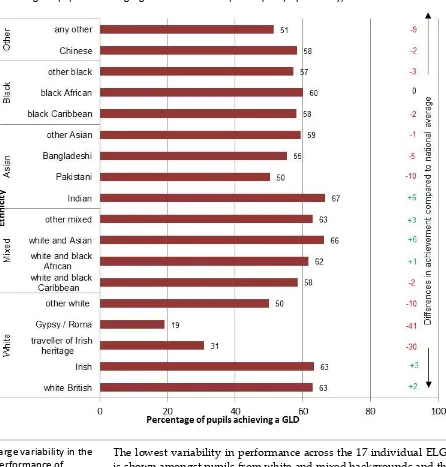
Pupils of any white or any mixed background performed slightly above the national average with 62% achieving a good level of development.
Asian pupils remain lowest achieving major ethnic group
Pupils of any Asian background remain the ethnic group with the lowest proportion of pupils achieving a good level of development at 57%. Asian pupils have however seen the largest improvement of all the major ethnic groupings in 2014 with a 10 percentage point increase in the proportion achieving a GLD and the gap when compared to all pupils narrowing from 4 to 3 percentage points.
Chinese and black pupils are also below average
Chinese pupils and pupils of any black background again achieved below the national average with 58% and 59% respectively achieving a good level of development.
Looking at individual ethnic groups, those from an Indian or mixed white and Asian backgrounds had the highest proportions of pupils achieving a good level of development, 6 percentage points above the national average.
Gypsy/Roma pupils have the lowest percentage achieving a good level of development at 19%, 41 percentage points below the national average. Almost a third (31%) of travellers of Irish heritage achieved a good level of development, 30 percentage points below the national average. Both these gaps have increased in the last year. Pakistani pupils and pupils from ‘any other white background’ also have notably lower than average percentages achieving a good level of development (50%) with attainment gaps of 10 percentage points.
Figure 2: Proportion achieving GLD by ethnicity
Percentage of pupils achieving a good level of development (GLD) by ethnicity, 2014
Large variability in the performance of Chinese pupils across the 17 ELGs
The lowest variability in performance across the 17 individual ELGs is shown amongst pupils from white and mixed backgrounds and the highest variability is shown amongst Chinese pupils.
The proportion of Chinese pupils achieving the expected standard in all the ELGs is lower than the national average (3 percentage point attainment gap), however, when looking at performance across the ELGs it can be seen that this group perform significantly below the national average in understanding, speaking and people and communities, but above average in numbers, writing and moving and handling.
Asian pupils are below average in all 17 ELGs
English as a first language
Achievement is higher for those pupils whose first language is English when compared with pupils whose first language is not English.
63% of pupils whose first language is English achieved a good level of development compared with 53% of pupils whose first language was other than English, an attainment gap of 10 percentage points.
This gap remains unchanged from 2013.
Table C: First language attainment gaps
First Language attainment gaps (English as a first language minus first language other than English), 2014 (percentage points)
% achieving at least the expected level
in all ELGs
% achieving a GLD average
point score
All pupils 58 60 33.8
English 61 63 34.3
Other than English 49 53 31.8
attainment gap 11ppts 10ppts 2.5
Table D: Time series of GLD by first language
Percentage of pupils achieving a good level of development by first language, 2013 – 2014
All pupils English
Other than English
GLD attainment gap
2014 60% 63% 53% 10ppts
2013 52% 54% 44% 11ppts
The difference in the attainment gap when compared to 2013 is just 0.3ppts.
There is some variation in attainment by first language by gender and in the 17 ELGs.
60% of girls compared with 45% of boys whose first language was other than English achieved a good level of development, a 15 percentage point difference. This gender gap for EFL has narrowed by 2 percentage points in the last year and is now 11 percentage points for girls and 9 percentage points for boys.
The widest gap is in speaking where attainment is 17 percentage points lower for pupils whose first language was other than English. This gap has narrowed by 2 percentage points since 2013.
Free school meal (FSM) eligibility
Pupils eligible for free school meals perform less well than other pupils (those who are not eligible for free school meals and unclassified).
Overall FSM attainment gap remains at 19 percentage points
45% of pupils eligible for free schools meals achieved a good level of development compared with 64% of other pupils. The FSM attainment gap remains at 19 percentage points. The gap is the same for both girls and boys at 19 percentage points.
Table E: FSM attainment gaps
FSM attainment (all other pupils minus FSM), 2014
% achieving at least the expected level
in all ELGs
% achieving a GLD average
point score
All pupils 58 60 33.8
FSM eligible 42 45 30.8
All other pupils 61 64 34.4
attainment gap 19ppts 19ppts 3.6
Table F: Time series of GLD by FSM
Percentage of pupils achieving a GLD by free school meal eligibility, 2013 - 2014
All pupils FSM
All other pupils
GLD attainment gap
2014 60% 45% 64% 19ppts
2013 52% 36% 55% 19ppts
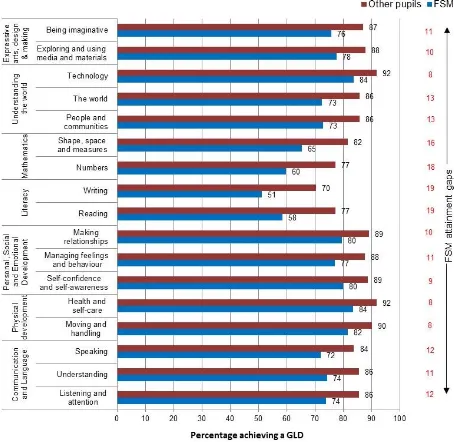
Figure 3: FSM by ELG
Percentage of pupils achieving at least the expected level in each early learning goal (ELG) by free school meal eligibility, 2014
42% of black Caribbean boys eligible for free school meals achieved a GLD in 2014. This is above the all FSM boys average of 36% achieving a GLD.
With the exception of gypsy/Roma and travellers of Irish heritage, Irish boys have the lowest proportion eligible for FSM achieving a good level of development at 28%. The attainment gap compared to all other Irish boys is 35 percentage points.
FSM gaps narrow slightly in all 17 ELGs
The FSM attainment gap has narrowed in all ELGs since 2013, the largest change in the technology ELG where the gap narrowed from 10 to 8 percentage points. 84% of pupils eligible for FSM reached at least the expected standard in technology in 2014.
The widest FSM attainment gaps as in 2013 are again seen in the literacy goals of reading and writing, both with a 19 percentage point attainment gap when comparing pupils eligible for free school meals and all others. Larger gaps are also seen in the mathematics area of learning.
The ELGs where the FSM gaps are narrowest are those within the physical development areas of learning and technology.
Month of birth
Autumn born children outperform children born in either the spring or the summer.
Of pupils born in the autumn term, 71% achieved a good level of development compared with 49% of those pupils born in the summer, a 22 percentage point attainment gap.
Attainment gaps for the headline indicators remain broadly the same as seen in 2013.
Table G: Month of birth attainment gaps
(autumn born minus summer born), 2014
% achieving at least the expected level in all ELGs
% achieving a GLD average
point score
All pupils 58 60 33.8
Autumn born 69 71 35.9
Spring born 59 61 33.8
Summer born 47 49 31.7
attainment gap 22ppts 22ppts 4.2
Looking at ELGs and the impact of month of birth, gaps have narrowed slightly in all individual ELGs.
Month of birth has the largest impact on the literacy and mathematics areas of learning. 77% of pupils born in the autumn term achieved at least the expected level in the ELG writing compared with 56% of pupils born in the summer term, a 21 percentage point attainment gap.
In the ELG numbers, the attainment gap narrowed by 2 percentage points in 2014 to 18 percentage points with 83% of autumn born pupils achieving the level expected compared with 65%.
Special educational needs (SEN)
Of all reported characteristics, pupils with a special
educational need have the largest attainment gaps when compared to those without SEN.
…and it’s widened.
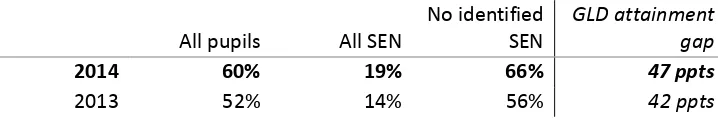
For pupils with SEN (both without a statement and those with a statement of SEN), 19% achieved a good level of development compared with 66% of those pupils with no identified SEN.
The GLD SEN attainment gap has widened from 42 percentage points in 2013 to 47 percentage points in 2014.
Lowest for those with a statement
[image:12.595.76.499.323.488.2]The proportion of pupils with a statement of SEN who attained a good level of development was the lowest at 3%, 1 percentage point higher than in 2013.
Table H: SEN attainment gaps
Special educational needs (SEN) attainment gaps (no identified SEN-pupils with a SEN), 2014
% achieving at least the expected level
in all ELGs
% achieving a GLD average
point score
All pupils 58 60 33.8
No identified SEN 63 66 34.8
All SEN 17 19 25.8
school action 21 23 27.4
school action plus 18 19 26.0
statemented SEN 3 3 19.7
attainment gap 46ppts 47ppts 9
Table I: Time series of GLD by SEN
Percentage of pupils achieving a good level of development by SEN 2013 - 2014
All pupils All SEN
No identified SEN
GLD attainment gap
2014 60% 19% 66% 47 ppts
2013 52% 14% 56% 42 ppts
Looking at the individual ELGs and the impact of SEN:
The largest attainment gap between pupils with an identified SEN and those without is in speaking. 87% of pupils with no identified SEN achieved at least the expected level in speaking compared with 40% of those with an identified SEN, an attainment gap of 46 percentage points.
[image:12.595.78.437.533.594.2]3.
Local authority results
(local authority tables 4 to 7)There is considerable variation between local authorities in attainment levels at the end of the EYFS as reported in the October SFR.
There is also variation in pupil characteristic attainment gaps by local authority. Most notably:
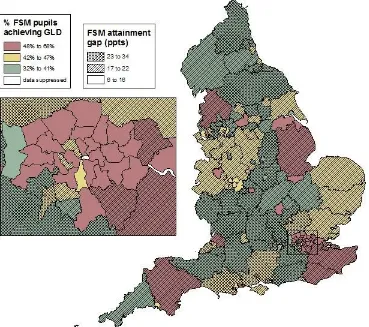
Large variation by LA in the proportion of FSM pupils reaching a GLD
The proportion of pupils eligible for free school meals reaching a good level of development ranges from 68% in Lewisham to 32% in the local authorities of Blackburn & Darwen and Wigan.
Of those LAs where less than 10% of pupils are FSM eligible the attainment gap ranges from 22 percentage points to 32 percentage points.
[image:13.595.134.503.358.685.2]In those LAs with more than a third of pupils are eligible for FSM, the attainment gap ranges from the national average of 19 percentage points in Middlesbrough down to 7 percentage points in Tower Hamlets.
Figure 4: Local authority attainment for FSM pupils
Proportion of FSM pupils by LA achieving a GLD and GLD FSM attainment gaps (percentage points), 2014
4.
Accompanying tables
The following tables are available in excel format on the department’s statistics website:
National tables
1 Achievement in early years foundation stage
profile (EYFSP) teacher assessments by pupil characteristics, 2013-2014
2a Achievement in early years foundation stage profile (EYFSP) teacher assessments by ethnicity, free school meal eligibility and gender, 2013-2014
2b Achievement in early years foundation stage profile (EYFSP) teacher assessments by SEN provision, free school meal eligibility and gender, 2013-2014
2c Achievement in early years foundation stage profile (EYFSP) teacher assessments by SEN provision, ethnicity and gender, 2013-2014
3 Achievement in each of the 17 early learning
goals (ELGs) by pupil characteristics, 2013-2014
Local authority tables
4 Achievement in early years foundation stage
profile (EYFSP) teacher assessments by ethnicity and local authority, 2013-2014
5 Achievement in early years foundation stage
profile (EYFSP) teacher assessments by first language and local authority, 2013-2014
6 Achievement in early years foundation stage
profile (EYFSP) teacher assessments by free school meal eligibility and local authority, 2013-2014
7 Achievement in early years foundation stage
profile (EYFSP) teacher assessments by SEN provision and local authority, 2013-2014
Pupil residency-based tables
PR1 Achievement in early years foundation stage profile (EYFSP) teacher assessments by IDACI decile of pupil residence, 2014
PR2 Achievement in early years foundation stage profile (EYFSP) teacher assessments by local authority district and region of pupil residence, 2014
When reviewing the tables, please note the following:
We preserve confidentiality
The Code of Practice for Official Statistics requires us to take reasonable steps to ensure that our published or disseminated statistics protect confidentiality.
so we suppress some figures,
Values of 1 or 2, or a percentage based on 1 or 2 pupils who achieved or 0, 1 or 2 pupils who did not achieve a particular level are suppressed. Some additional figures have been suppressed to prevent the possibility of a suppressed figure being revealed.
This suppression is consistent with our statistical policy statement on
confidentiality.
adopt symbols to help identify this
Symbols are used in the tables as follows:
. not applicable
.. not available
x publication of that figure would be disclosive
* figures not published due to incomplete data coverage.
and round numbers Percentages in this SFR are given to the nearest whole number but all gaps and differences have been calculated on unrounded data. Therefore some figures may not match those produced from the rounded figures shown in the tables.
All numbers at regional level are rounded to the nearest 10. However percentages have been calculated from unrounded data. This is so that it is not possible to deduce the figures for LAs which have been suppressed.
We’ve made some changes this year
With the exception of those changes stated in this section, all other figures published in this 2014 SFR have been calculated using the same methodology as the 2013 figures so that valid comparisons can be made.
Following the review of enquiries we have added the following tables/breakdowns to the SFR:
- SEN primary need breakdown to table 1.
Additional tables showing achievement in early years foundation stage profile (EYFSP) teacher assessments by:
- IDACI decile of pupil residence.
- Local Authority District (LAD) of pupil residence.
In order to minimise the amount of suppressions applied to the local authority tables we have rounded regional totals to the nearest 10. Figures in the Isles of Scilly and City of London are suppressed as attainment in these LAs is based on a single school. Secondary suppressions have in previous years been applied to other LAs in Inner London and the South West to prevent these LA figures being derived. By rounding regional figures these additional suppressions are no longer required.
This is final data 2014 figures in this publication are final.
Any unplanned revisions will be made in accordance with our
statistical policy statement on revisions.
We provide underlying data
The SFR is accompanied by national and local authority underlying
data and metadata describing this data. This data is provided in csv
format so that it can be loaded into the software of your choice.
5.
National Statistics
The United Kingdom Statistics Authority has designated these statistics as National Statistics, in accordance with the Statistics and Registration Service Act 2007 and signifying compliance with the Code of Practice for Official Statistics.
Designation can be broadly interpreted to mean that the statistics:
are produced according to sound methods, and
are managed impartially and objectively in the public interest.
Once statistics have been designated as National Statistics it is a statutory requirement that the Code of Practice shall continue to be observed.
The Department has a set of statistical policies in line with the Code of Practice for Official Statistics.
6.
Technical information:
Assessment scales and indicators
The assessments are made on the basis of practitioners’ accumulating observations and knowledge of the whole child. By the end of the Early Years Foundation Stage, the profile provides a way of summing up that knowledge. It should be completed in the summer term, summarising each child’s achievement as emerging, expected or exceeding against each of the 17 early learning goals (ELGs) introduced in 2013.
The areas of learning
Area of learning Early Learning Goal Emerging (1) Expected (2) Exceeding (3)
Communication and Language
Listening and attention
Understanding
Speaking
Physical development Moving and handling
Health and self-care
Personal, Social and Emotional
Development
Self-confidence and self-awareness
Managing feelings and behaviour
Making relationships
Literacy Reading
Writing
Mathematics Numbers
Shape, space and measures
Understanding the world
People and communities
The world
Expressive arts, designing and making
Exploring and using media and materials
Being imaginative
Further information on the assessment scales can be found in the methodology documents
which accompanies the October publication: SFR39-2014 methodology
A good level of development
The good level of development (GLD) measure is the most widely used single measure of child development in the early years. Children have been defined as having reached a GLD at the end of the EYFS if they achieved at least the expected level in the early learning goals in the prime areas of learning (personal, social and emotional development; physical development; and communication and language) and in the specific areas of mathematics and literacy.
Average point score
A pupil’s total point score is calculated as the sum of the level achieved in each of the 17 individual early learning goals (ELGs). The points are allocated as in the table below for each ELG and then summed to give a pupils total point score, (range 17 - 51).
Assessment rating Number of points
Emerging 1
Expected 2
Exceeded 3
The average point score (APS) for any given group is the mean of the total point scores for pupils from that group.
Methodology and quality
The following quality and methodology document accompanies this SFR:
Pupil Characteristic & Geography Information This document provides an overview of the
pupil characteristic information used in the production of this and other key stage statistical first releases (SFRs) that report on pupil attainment in England. It provides information on the data sources, their coverage, quality and how the data is validated and processed.
Early Years Foundation Stage Profile collection guide
Information for preparing and completing the annual Early Years Foundation Stage Profile, including the scope of the return, technical specifications and what data needs to be submitted to the Department for Education by local authorities.
Documents and information for local authorities in relation to the EYFSP return.
Early Years Foundation Stage Handbook The 2014 handbook can be found here.
Assessment and Reporting Arrangements Statutory guidance covering the assessment
and reporting requirements for the early years
foundation stage (EYFS) can be found here.
The following quality and methodology documents were published as part of SFR39/2014:
Early years foundation stage profile results on the 16th October 2014 and provide information
on 2014 data coverage, quality, validation and processing.
Early years foundation stage profile results in England, 2013/14: Methodology document
Summary details of the EYFSP profile including:
- which schools are included.
- data collection
- data cleaning
Methodology document
Early years foundation stage profile results in England, 2013/14, Quality and uses of data
This document details issues relating to the quality of the data from the Early Years Foundation Stage Profile return along with details of users and the known uses of the data.
Quality and uses of data
It should be noted that since the data collection closed, a school in Hammersmith and Fulham local authority informed the Department for Education they had submitted incorrect data showing some pupils as having scored lower than they actually did. The school estimates the corrected data would result in 5 more pupils achieving a good level of development than reported in this publication.
Data sources
Coverage
What geography breakdowns are included?
This publication includes national and local authority results from the 2014 EYFSP collection.
Which pupils are included?
Pupils are included only if they have a valid score in each of the 17 assessment scales.
There are slight differences between the numbers reported in this publication when compared to SFR39/2014 published on 16th October 2014. Headline attainment percentages are not affected. Differences are due to the exclusion in the National Pupil Database (NPD) of LA 702 (service children), shielded pupils, and rules to identify duplicate pupil records.
Tables 1 to 3 contain national level data. Tables 4-7 contain local authority level data and are based on the local authority that maintains the school the pupils attend. Tables PR1 and PR2 contain information based on pupil residency.
7.
Further information
School level figures School level data is not published for the early years foundation stage
profile.
Lower level geographic data
Pupil residency based tables showing 2014 small area attainment data by pupil characteristics at the end of the early years foundation stage (EYFS) are due to be published by the Office for National Statistics (ONS) on the neighbourhood statistics service (NeSS)
website in June 2015.
The ONS neighbourhood statistics data in 2014 was accompanied by the Department for Education publication:
Statistics: neighbourhood (absence and attainment)
Previously published figures
SFR39/2014: Early years foundation stage profile results: 2014
SFR47/2013: EYFSP attainment by pupil characteristics: 2013
Attainment for other key stages
SFR34/2014: Phonics screening check and key stage 1 assessments:
England 2014
SFR30/2014: National curriculum assessments at key stage 2 in
England: 2014 (provisional)
SFR01/2014: GCSE and equivalent results in England, 2012 to 2013
(revised)
SFR05/2014: GCSE and equivalent attainment by pupil characteristics
SFR02/2014 A level and other level 3 results: academic year 2012 to 2013 (revised)
Pupil numbers SFR15/2014: Schools, Pupils and their Characteristics: January 2014
SEN attainment SFR31/2014: Children with special educational needs: an analysis
2014
Attainment in Wales, Scotland and Northern Ireland
The Welsh Government publishes similar attainment data for schools in Wales. As in England, the national curriculum is divided into key stages and pupils are assessed at the end of key stage 1, 2 and 3 at ages 7, 11, and 14 respectively. Pupils are expected to achieve level 4 at the end of key stage 2 and level 5 at the end of key stage 3. Statutory assessment in Wales is by teacher assessments for all key
stages. Further information is available on the Welsh Government
website.
The Scottish Government measures attainment nationally using the Scottish Survey of Literacy and Numeracy (SSLN), an annual sample survey of pupil attainment in primary and early secondary school.
Further information is available on the Scottish Government website.
Information on educational attainment for post-primary schools in
Northern Ireland is available from the Northern Ireland Statistics and
Research Agency.
International comparisons
There are no international comparisons of attainment for pupils of this age.
Pupils in England take part in international surveys such as the Trends in International Mathematics and Science Study (TIMSS). This is a comparative international survey of mathematics and science achievement of 9-10 year olds and 13-14 year olds, carried out on pupils from a sample of schools. 2011 results were published on 11 December 2012.
8.
Got a query? Like to give feedback?
If from the media Press Office News Desk, Department for Education, Sanctuary
Buildings, Great Smith Street, London SW1P 3BT. 020 7783 8300
If non-media Sally Marshall, Education Standards Evidence and Dissemination
Division, Department for Education, 2 St Paul’s Place, 125 Norfolk Street, Sheffield S1 2FJ.
0114 2742317
© Crown copyright 2014
You may re-use this information (excluding logos) free of charge in any format or medium, under the terms of the Open Government Licence. To
view this licence, visit Open Government Licence or e-mail:
psi@nationalarchives.gsi.gov.uk.
Where we have identified any third party copyright information you will need to obtain permission from the copyright holders concerned.
Any enquiries regarding this publication should be sent to Sally Marshall, Education Standards Evidence and Dissemination Division, Department for Education, 2 St Paul’s Place, 125 Norfolk Street, Sheffield S1 2FJ
Tel: 0114 2742317 email: sally.marshall@education.gsi.gov.uk