Statistical Release
Education and Training Statistics for the United
Kingdom: 2014
Reference SR 45/2014 Date 06 November 2014
Coverage England/Scotland/Wales/Northern Ireland Theme Children, Education and Skills
Issued by Department for Education, Sanctuary Buildings, Great Smith Street, London SW1P 3BT Press office 020 7925 6789
Public enquiries 0370 000 2288 Statistician Selena Jackson
Phone 020 7783 8599
Email Selena.Jackson@education.gsi.gov.uk
Internet Education and Training Statistics for the United Kingdom: 2014
9.9 million full-time and part-time pupils in around 32,300 schools in the UK in 2013/14 compared with 9.7 million pupils in 33,100 schools in 2009/10.
126,000 more primary school pupils compared to 2012/13 in the UK, despite a slight decline in the number of primary schools.
70% of all full-time teachers are female. In secondary schools 40% of all teachers are male compared to 16% in nursery and primary schools.
16.3 is the pupil teacher ratio for all schools in the UK, this has remained constant for the past 4 years.
160 universities and other higher education institutions in the UK in 2012/13. Compared with the previous year there are 6 more universities and 8 fewer higher education institutions.
14% increase in the number of undergraduate first degrees being taken compared to 2008/09.
22% rise in the number of postgraduate students studying for a PhD since 2008/09.
Statistical Release
Table of Contents
Background and context 2
1. Schools 3
2. Post Compulsory Education 5
3. GCE, GCSE and SCE – Qualifications 8
4. Education Expenditure 11
5. List of Tables 12
6. National Statistics 13
7. Technical Guide 13
8. Useful Contacts 16
9. Got a Query? 17
Background and context
This statistical first release (SFR) contains data on education and training in the UK. It provides an integrated overview using data collected from England, Wales, Northern Ireland and Scotland.
1.
Schools (Tables 1.1-1.4)
This section looks at the numbers of schools, pupils and teachers across the UK.
Figure 1.1 below shows that there were 32,322 schools in the UK; primary schools account for 65% (21,040 schools) of the total with secondary schools (4,116) and nurseries (3,031) accounting for 13% and 9% of the total respectively.
Figure 1.1: Number of schools in the UK by school type, 2013/14
Number of Schools
Nursery 3,031
Primary 21,040
Middle 4
Secondary 4,116
Non-maintained mainstream1 2,497
Special Schools 1,264
Pupil referral units 371
[image:3.595.74.532.465.732.2]Total 32,323
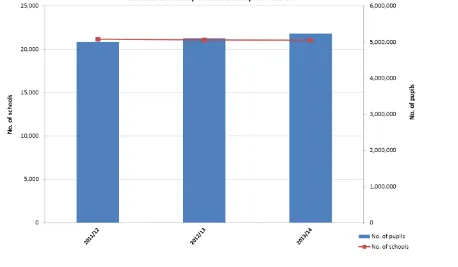
Figure 1.2a below shows there were 21,069 primary schools in the UK in 2012/13, falling to 21,040 in 2013/14. During this time, the number of primary school pupils increased by 126,000. For secondary schools in figure 1.2b, there was a rise in the number of schools and a decrease in the number of pupils during the same period.
Figure 1.2a: The number of primary schools2 and pupils in the UK, 2011/12 to 2013/14
For secondary schools in figure 1.2b, the reverse is true as there was a rise in the number of schools (39) and a decrease in the number of pupils (21,000) during the same period.
Figures 1.2b: The number of secondary schools1 and pupils in the UK, 2011/12 to 2013/14
As in previous years, there are more female teachers than male teachers
70% of full-time qualified teachers in the UK were female in 2013/14. 16% of teachers in nurseries and primary schools are male and in secondary schools this figure is 40% (table 1.3)
The number of full-time qualified teachers rose
compared to last year
There were 506,100 full-time teachers in 2013/14 compared to 500,600 in 2012/13 (table 1.3)
The average pupil-teacher ratio for all schools has remained fairly stable over the last 5 years
The average pupil: teacher ratio for all schools within the UK in 2013/14 was 16.3, compared to 16.2 in the previous year and 16.3 back in 2010/11.
2.
Post Compulsory Education
(Tables 2.1-2.4)This section provides statistics for further education and higher education institutions and staff, students and learners, and individuals not in education, employment or training.
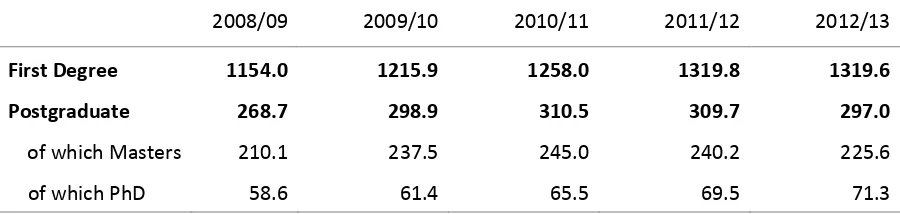
[image:5.595.68.518.279.386.2]Figure 2.1 shows the number of full-time students in 2012/13 studying for a first degree. Since 2008/09, there has been an increase in the number of students studying for first degrees of 14%, as well as an increase in those studying for postgraduate degrees (11%). The increase in postgraduate degrees has been driven by an increase in those studying for a PhD which has seen an increase of 22% of the five year period. Interestingly, the number of students studying for a Masters has declined since last year by 6%.
Figure 2.1: The number of full-time students in Higher Education in the UK split by level, 2008/09 to 2012/13 (thousands)
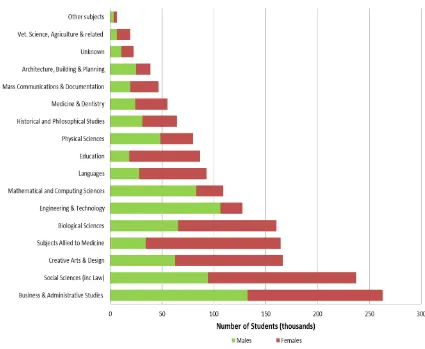
Figures 2.2a and 2.2b show the popularity of subjects taken in higher education for full-time and part-time students. The most popular subjects have remained the same for the past 3 years for both full-time and part-time students. The most popular subjects for full time students were Business and Administration studies and Social Sciences (including Law). For full-time students, Engineering & Technology and mathematical and computing science subjects are male-dominated and Education, Languages, Social Sciences (including Law), Creative Arts & Design and Applied subjects to medicine are female-dominated. (Table 2.2)
3 “Other undergraduate” degrees include HNDs/HNCs, foundation degrees and other qualifications defined to be at Higher Education level
2008/09 2009/10 2010/11 2011/12 2012/13
First Degree 1154.0 1215.9 1258.0 1319.8 1319.6
Postgraduate 268.7 298.9 310.5 309.7 297.0
of which Masters 210.1 237.5 245.0 240.2 225.6
of which PhD 58.6 61.4 65.5 69.5 71.3
The number of FE colleges has been falling both in recent years and also longer term
There were 396 FE colleges in the UK in 2012/13. This number has fallen by 20 since 2010/11 and by 95 since 2000/01 (table 2.1)
The number of higher education (HE)
students in the UK has fallen
There were 2.5 million HE students of which 539,700 were known to be postgraduate students and 1.55 million were first degree students, and 425,000 were on other undergraduate courses3 in 2012/13. This
Figure 2.2a: The number of full-time students in higher education split by subject, 2012/13
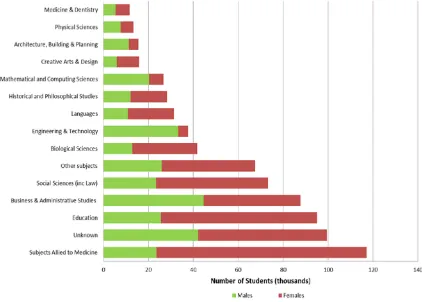
The most popular subjects studied part-time at higher education institutions in the UK were subjects allied to Medicine and Education. 80% of those studying this subject were female. Women were also more likely to studying education part-time than men (73% compared with 27%) whereas men were more likely to be studying engineering and mathematical and
Figure 2.2b: The number of part-time students in Higher Education split by subject, 2012/13
Figure 2.3: The number of further education enrolments in the UK, 2011/12 and 2012/13 (thousands) (Table 2.3)
UK England Scotland Wales Northern
Ireland
2012/13 4,899 4,320 236 198 145
2011/12 4,826 4,217 257 211 142
The numbers of further education students in the UK has increased by around 73,000, driven by an increase of over 100,000 in England to 4.32 million students. Northern Ireland has a seen a slight rise in numbers however, both Scotland and Wales has seen decreases.
1.04 million young people aged 16-24 were not in education, employment, or training in 2013
accounting for 14.4% of the total 16-24 year old population
This is a fall of 37 000 compared to 2012. Of the 1.04 million, 568,000 were unemployed and 467,000 economically inactive. There has
[image:7.595.65.539.459.528.2]3.
GCE, GCSE and SCE - Qualifications
(Tables 3.1-3.4)This section takes a closer look at qualifications at aged 16 and 18. Across the UK the numbers and percentages of pupils passing GCE, GCSE and SCQF qualifications has continued to rise since 2000/01.
There are no UK qualifications totals in this year’s volume. Tables in this section show figures for Scotland separately from England, Wales and Northern Ireland due to the different nature of their qualifications.
Qualifications at aged 16/18 in the UK
In England, Northern Ireland, and Wales pupils take the GCSE (General Certificate of Secondary Education) at 16 and GCE A levels at 18. In Scotland4 pupils study for their first
National Qualifications (NQ), typically at SCQF level 3 to 5, in the fourth year of secondary school. These include Access 3, National 3 to National 5 or Intermediates 1 and 2. NQ Higher grade (SCQF level 6), requires at least a further year of secondary schooling. Although Intermediates 1 and 2 can be taken in the fourth year of secondary school, they are designed primarily for candidates in the fifth and sixth years of secondary school.
GCSE entries and attainment (England, Wales and Northern Ireland) (Tables 3.1, 3,2a)
[image:8.595.68.521.546.654.2]The number of GCSE entries or equivalent continues to rise with 4.91 million entries in 2012/13 compared to 4.73 million in 2011/12 (Table 3.2a). The most frequently studies subjects at GCSE continue to be mathematics (650,800 entries), English (607,100 entries) and English Literature (460,300 entries).
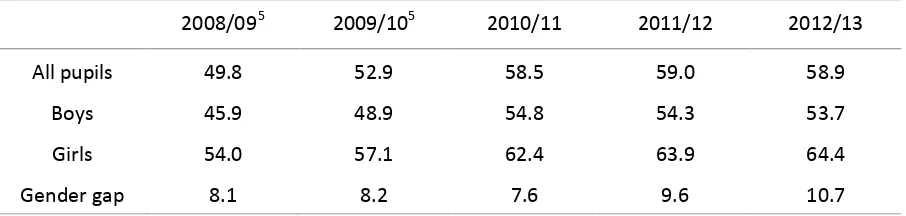
Figure 3.1a: The percentage of pupils in England, Wales and Northern Ireland achieving 5 or more GCSE grades at A*-C including English and mathematics, 2008/09 to 2012/13, (Table 2.3)
4 Scotland’s qualifications system is currently undergoing a period of change. The new National 1 to National 5 qualifications were introduced
in Scottish schools for the first time this year (2013/14). Intermediate 1 and 2 qualifications will remain available until 2015/16. Higher and Advanced Higher qualifications will be retained and refreshed, with the new refreshed qualifications available from 2014/15 and 2015/16 respectively.
5Figures for earlier years can be found in previous editions of the UK Volume Statistics: education and training - GOV.UK
2008/095 2009/105 2010/11 2011/12 2012/13
All pupils 49.8 52.9 58.5 59.0 58.9
Boys 45.9 48.9 54.8 54.3 53.7
Girls 54.0 57.1 62.4 63.9 64.4
The percentage of pupils gaining 5 or more GCSE grades at A*-C has increased slightly by 2.8 percentage points, with 81.5% of pupils achieving this level in 2012/13 compared to 78.7 in 2010/11. However, those achieving 5 or more GCSE grades at A*-C including English and mathematics has remained constant as seen in figure 3.1a.
Girls continue to outperform boys at GCSE with 64.4% of girls achieving 5 or more GCSE grades at A*-C including English and mathematics compared to 53.7% for boys. The gender gap has widened over each of the last 3 years.
SQA qualifications entries and achievements (Scotland only) (Table 3.1, 3.2b)
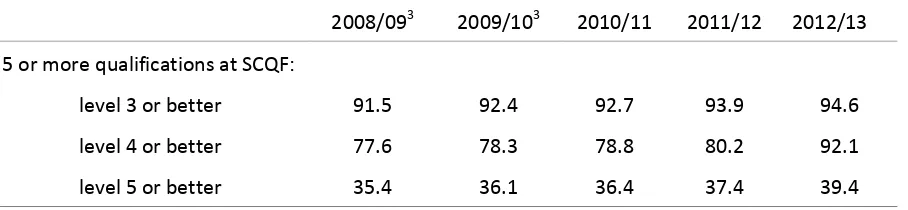
[image:9.595.71.525.308.413.2]In Scotland, there were fewer SCQF level 3-5 entries in 2012/13 with 555,800 entries compared to 570,400 in 2011/12. The most frequently studied subjects at SCQF levels 3-5 were mathematics (86,000 entries), English (80,800 entries) and biology (37,200 entries) (Table 3.2b). Figure 3.1b: The percentage of pupils6 in Scotland in their last year of compulsory achieving 5
or more qualifications at SCQF by level, 2008/09 to 2012/13 (Table 3.1)
A Level Qualifications (England, Wales and Northern Ireland, Table 3.1 and 3.3a)
The number of GCE A level entries have fallen with a total of 835,200 entries made by young people in England, Wales and Northern Ireland in 2012/13, a fall of almost 5,000. The most popular subject still remain English (86,300 entries), mathematics (86,600), biological sciences (62,700), psychology (55,000), history and chemistry (both 51,000). (Table 3.3a).
The percentage of all entries in England, Wales and Northern Ireland achieving passes at grades A*-C has increased as has the percentage achieving 2 or more A level passes.
2008/093 2009/103 2010/11 2011/12 2012/13
5 or more qualifications at SCQF:
level 3 or better 91.5 92.4 92.7 93.9 94.6
level 4 or better 77.6 78.3 78.8 80.2 92.1
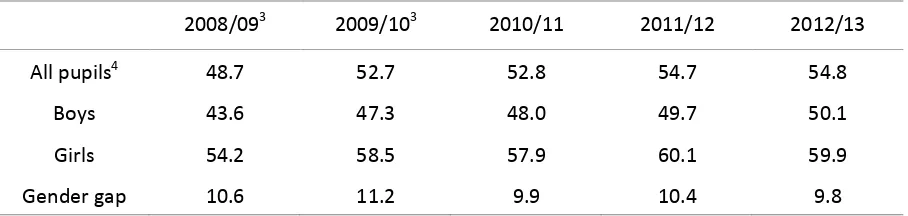
Figure 3.2a: The percentage of pupils in England, Wales and Northern Ireland achieving 2 or more GCE A levels and equivalents passes, 2012/13. (Table 3.1)
Females continue to outperform their male peers despite seeing a fall in the proportion of them achieving 2 or more A level passes. 59.9% of females achieved 2 or more A level passes in 2012/13 compared to just 50.1% of males. (Table 3.1).
SQA qualifications entries and achievements at Level 6 (Scotland only)
[image:10.595.67.521.110.218.2]The number of SCQF level 6 (highers) entries has risen by around 2,000, with 183,500 entries in 2012/13. The numbers achieving 3 or more qualifications at SCQF level 6 or better has increased since last year, with 28.8% of all entries achieving this in 2012/13 (27.2% in 2011/12). The subjects entered remain broadly similar to 2011/12 with English (31,100 entries), mathematics (20,700) and biology (14,400) remaining the most popular.
Figure 3.2b: The percentage of pupils5 passing SCQF level 6 (Highers) by grade, 2008/09 to 2012/13.
(Table 3.3b)
2008/093 2009/103 2010/11 2011/12 2012/13
All pupils4 48.7 52.7 52.8 54.7 54.8
Boys 43.6 47.3 48.0 49.7 50.1
Girls 54.2 58.5 57.9 60.1 59.9
Gender gap 10.6 11.2 9.9 10.4 9.8
2010/113 2011/123 2012/13
SCQF Level 6 at grade:
A 26 28 28
B 26 27 26
C 25 24 24
Highest Qualification
• 40 per cent of working aged adults (19-64) have an NVQ Level 4 or above in the United Kingdom. This compares with 40 per cent also in England, 34 per cent in Wales and 31 per cent in Northern Ireland. 43 per cent of working age adults in Scotland have a SCQF level 7 or better. (Table 3.4)
• Slightly more females (42 per cent) have an NVQ Level 4 or above in the United Kingdom than males (38 per cent). (Table 3.4)
• 49 per cent of 30-39 year olds have an NVQ Level 4 or above. This compares with 26 per cent of 19-24 year olds and 35 per cent of 50-64 year olds. (Table 3.4)
4.
Education Expenditure
(Annex A)Education Expenditure
5.
List of tables
The following tables are available in excel format on the department’s statistics website:
Schools
1.1 Number of schools, by type of school - time series.
1.2 Full-time and part-time pupils by age, gender and school type, 2013/14.
1.3 Qualified teachers by type of school and gender - time series.
1.4 Pupil: teacher ratios (PTRs) and pupil: adult ratios (PARs) within schools, by type of school - time series.
Post Compulsory Education
2.1 Number of establishments of further and higher education by type, and full-time academic staff by gender - time series. 2.2 Students in higher education by level, mode
of study, gender and subject group, 2012/13.
2.3 Students in further education by country of study, mode of study, gender and age, during 2012/13.
2.4 Students in further and higher education - time series.
2.5 People aged from 16 to 24 Not in Education, Employment or Training (‘NEET’) by gender – time series.
GCE, GCSE and SCE - Qualifications
3.1 GCE, GCSE, SCE/NQ and vocational qualifications obtained by pupils and students - time series.
3.2a GCSE entries and achievements for pupils in their last year of compulsory education, in all schools by subject and gender by the end of 2012/13.
3.2b SQA qualifications entries and achievements at SCQF levels 3-5 by subject, all learners, 2012/13.
3.3a GCE A level entries and achievements for young people in all Schools, and Further Education Sector Colleges by subject and gender, 2012/13.
3.3b SQA qualifications entered and passed at SCQF level 6 (Highers) by subject, all learners, 2012/13.
3.4 Highest qualification held by working age adults, by gender, age and region 2013. Annex A Education expenditure on services,
2011/12 to 2013/14.
When reviewing the tables, please note the following:
adopt symbols to help
identify this Symbols are used in the tables as follows: . not applicable
.. not available
x publication of that figure would be disclosive
rounding of figures Where figures have been rounded, there may be discrepancies
6.
National Statistics
The United Kingdom Statistics Authority has designated these statistics as National Statistics, in accordance with the Statistics and Registration Service Act 2007 and signifying compliance with the Code of Practice for Official Statistics.
Designation can be broadly interpreted to mean that the statistics: • meet identified user needs;
• are well explained and readily accessible; • are produced according to sound methods, and
• are managed impartially and objectively in the public interest.
Once statistics have been designated as National Statistics it is a statutory requirement that the Code of Practice shall continue to be observed.
The Department has a set of statistical policies in line with the Code of Practice for Official Statistics.
7.
Technical Guides
i. SCHOOLS
The Department for Education carries out a spring, summer and autumn termly census of schools in England in January, May and October, respectively. From January 2002 onwards, maintained primary, secondary and special schools, as well as CTC’s, have reported data at an individual pupil level. In January 2003, the pupil level coverage expanded to include non-maintained special schools and academies.
Data collected in January 2014 were published the following June in the Statistical First Release “Schools, Pupils and Their Characteristics: January 2014.
The statistical first release is available on the Inside government website at:
https://www.gov.uk/government/statistics/schools-pupils-and-their-characteristics-january-2014
Annual schools census counts are carried out in January for pupils in Wales (at individual pupil level from 2003) and October for pupils in Northern Ireland. The annual schools census count for pupils in Scotland is carried out in September (excluding information on school meals, which is collected in a separate survey in February) - although the course of study followed by pupil aged 16 and over is not collected, but examination results for each subject are received in August.
ii.
TEACHERSfree schools), City Technology Colleges and Pupil Referral Units (PRU). It excludes sixth form and other further education colleges. It also collects information from LAs on their centrally employed teachers and centrally employed education support staff who spend the majority of their time in schools. SWF data are collected at the individual level for all staff in regular employment with a contract of 28 days or more. This includes contracts that were open on the census date and also those that were open but ended during the previous academic year. School staff that did not have an open contract on the census date are not included in the SFR but their information is collected as it essential for the calculation of staff turnover and teacher absence rates.
Annual teacher numbers in Northern Ireland are based on a reference week in the autumn term. The figures in table 1.3 include full-time permanent and part-time permanent teachers but exclude temporary teachers i.e. teachers filling vacant posts, secondments or career breaks. Prior to 2003/04, the figures for nursery, primary, secondary (non-grammar) and special schools were extracted from the computerised teachers’ payroll system, whilst the figures for grammar schools were obtained from an aggregate statistical return completed by the schools. Now, every grant-aided school is sent a list of teachers derived from the computerised teachers’ payroll system, and asked to mark any amendments. This checking process was introduced from 2003/04 for nursery, primary, secondary (non-grammar) and special schools, from 2005/06 for controlled grammar schools, and from 2007/08 for voluntary grammar schools. The net effect of this change in 2003/04 was that the number of teachers as verified by schools was some 400 lower than the number of teachers extracted from the payroll system, because, for example, substitute teachers had been incorrectly recorded. The Pupil: Teacher Ratio (PTR) calculation uses the teacher count and pupil count from the autumn term and is expressed as full-time equivalents, with part-time hours being converted on the basis that a fulltime working week is 32.4 hours.
In Scotland, the staff census covers all publicly funded schools (local authority and grant-aided). The information required to complete the September 2011 staff census was collected electronically, through local authorities, from all publicly funded primary, secondary and special schools. The information is generally that stored on schools’ management information systems, thus reducing the burden on schools. Information relating to pre-school teachers is collected from providers as part of the pre-school census. The accuracy of the reported number of teachers in pre-schools in Scotland is affected by non-response to the pre-school survey. Please see background notes of relevant year’s publication for further information -
http://www.scotland.gov.uk/Topics/Statistics/Browse/Children/Pubs-Pre-SchoolEducation
iii. HIGHER EDUCATION (HE)
From the academic year 1994/95 onwards, the Higher Education Statistics Agency (HESA) has collected information for HE students within UK HE institutions. The data collected include enrolment numbers, qualifiers and first destinations (home and EU students only from 1999/00) of qualifiers. This includes students who are registered at HEIs but taught in Further Education Institutions (FEIs) through a franchise arrangement. Information about students taking higher education courses in FEIs comes from the Skills Funding Agency Individualised Learning Record and Scottish Funding Council. The HESA student figures in this volume from 2001/02 are taken from the ‘standard registration’ count and are not directly comparable with those previously recorded from the December ‘snapshot’ count. In June 2009, the Department for Business, Innovation and Skills (BIS) was created from the merger of the Department for Business, Enterprise and Regulatory Reform and the Department for Innovation, Universities and Skills. It became responsible for adult learning, further and higher education, skills, science and innovation, and has subsequently supplied DfE with HE information from HESA. The specification of the HESA Standard Registration Population has changed from 2007/08 enrolments. Writing-up and sabbatical students are now excluded from this population where they were previously included in published enrolment data. HESA have changed the field ‘gender' to be consistent with the Learning Records Service (formally MIAP) common data definitions coding frame. Students of “indeterminate gender” are now included in total figures but not in separate breakdowns. “Indeterminate” means unable to be classified as either male or female and is not related in any way to trans-gender.
Further information can be found on the HESA website at: www.hesa.ac.uk
iv. FURTHER EDUCATION (FE)
In April 2010 the Young People’s Learning Agency replaced the Learning and Skills Council (LSC) as the body responsible for the delivery of training and education to all 16 – 19 year olds in England. The source used for the FE data for England is the Individualised Learner Record (ILR). At the same time the National Council for Education and Training for Wales (ELWa) became responsible for collection of information in Wales - statistics are provided by the Welsh Government. Statistical information on further education students in Scotland are provided by the Scottish Funding Council, and institutes of further education provide data for Northern Ireland to the Department for Employment and Learning (DELNI). From June 2009, the Department for Business, Innovation, and Skills (BIS) has provided data on FE students in higher education institutions in the UK, from the Higher Education Statistics Agency (HESA).
v. PUBLIC EXAMINATIONS: GCSE/GNVQ, GCE, SQA NATIONAL
QUALIFICATIONS (NQ)
but now these have been replaced by the new National courses (National 3, 4 and 5). Some study Intermediate 1 and 2 instead, however these qualifications were designed primarily for candidates in the fifth and sixth year of secondary schooling and are being phased out. Students can then go on to study Highers and Advanced Highers. The data source is the Scottish Qualifications Authority (formerly Scottish Examination Board).
vi. EDUCATION EXPENDITURE
HM Treasury provided education expenditure figures in Annex A from their Public Expenditure Statistical Analysis (PESA). Education expenditure is defined here as under fives, primary education, secondary education, post-secondary non-tertiary education, tertiary education, subsidiary services to education, research and development education and education not elsewhere covered. This is based on the UN Classification of the Functions of Government (COFOG) and is a sub-set of the education and training category. Training expenditure is not included. Total Expenditure on Services (TES) is a definition of aggregate public spending and covers most expenditure by the public sector that is included in Total Managed Expenditure (TME), where TME is a measure of public sector expenditure drawn from components in national accounts produced by the Office for National Statistics (ONS). TES broadly represents the sum of current and capital expenditure of central and local government, and public corporations, but excludes general government capital consumption and other accounting adjustments.
Since the publication of the 2009 edition of the volume some changes have occurred to the sub-functional classifications. This has resulted in changes to COFOG 9.2 (see ‘Education Expenditure’ in the ‘Sources’ section) and 9.5 and some expenditure items from these two categories were moved to COFOG 9.2 in order to better align the classification with COFOG level 2 definitions. As a result data for 2009-10 onwards are not directly comparable with data for prior years.
8.
Useful Contacts
The following is a list of websites for the Department for Education (DfE), the Department for Business, Innovation and Skills (BIS) and the devolved administrations which may be helpful if you have general enquiries about the information contained in this publication, the
9.
Got a query? Like to give feedback?
If from the media Press Office News Desk, Department for Education, Sanctuary Buildings, Great Smith Street, London SW1P 3BT.
020 7783 8300
If non-media Selena Jackson, Department for Education, Sanctuary Buildings, Great Smith Street, London SW1P 3BT.
020 7783 8599
Selena.Jackson@education.gsi.gov.uk
England Statistical publications :-
https://www.gov.uk/government/publications?publication_filter_option=statistics
Post-16 statistics :- www.thedataservice.org.uk
Lifelong Learning :- http://www.excellencegateway.org.uk
Higher Education statistics :- http://www.hesa.ac.uk/
Wales Welsh statistics: http://wales.gov.uk/topics/statistics/?lang=en
Scotland Scottish school statistics: http://www.scotland.gov.uk/Topics/Statistics
Scottish Funding Council statistics: http://www.sfc.ac.uk/statistics/statistics.aspx
Northern
Ireland Department for Education statistics: http://www.deni.gov.uk/index/facts-and-figures-new/education-statistics.htm
Department for Employment and Learning statistics:
© Crown copyright 2014
You may re-use this information (excluding logos) free of charge in any format or medium, under the terms of the Open Government Licence. To
view this licence, visit Open Government Licence or e-mail:
psi@nationalarchives.gsi.gov.uk
Where we have identified any third party copyright information you will need to obtain permission from the copyright holders concerned.
Any enquiries regarding this publication should be sent to Selena Jackson, Department for Education, Sanctuary Buildings, Great Smith Street, London SW1P 3BT. Tel: 020 7783 8599. Selena.Jackson@education.gsi.gov.uk