Published by Canadian Center of Science and Education
Drying Steps under Superheated Steam: A Review and Modeling
Ihsan Hamawand1
1 National Centre for Engineering in Agriculture (NCEA), University of Southern Queensland, Toowoomba 4350 QLD, Australia
Correspondence: Ihsan Hamawand, National Centre for Engineering in Agriculture (NCEA), University of Southern Queensland, Queensland, Australia. Tel: 6-466-897-659. E-mail: [email protected]
Received: September 6, 2013 Accepted: October 18, 2013 Online Published: November 15, 2013 doi:10.5539/eer.v3n2p107 URL: http://dx.doi.org/10.5539/eer.v3n2p107
Abstract
Superheated steam drying has been a subject of research for many decades. Many researchers have claimed that superheated steam drying is saving energy and produces better product quality compared to air drying. Superheated steam can be distinguished from air drying by the diffusion step in the drying process. Steam drying does not include moisture diffusion from the interior of the particle to its surface. However, in air drying, diffusion is the main and the limiting step. This paper is presenting a review to the models have been used to describe drying under superheated steam. Also, modelling was carried out to all the steps that take place in the drying process. These steps are: initial condensation on the surface of the particle, diffusion of the initially condensed vapour to the interior of the particle, evaporation of the initially condensed vapour and finally drying of the whole particle due to receding core model. Understanding these steps is very important for controlling the quality of the dried products and preventing difficulties such as sticking. These steps were modelled using MATLAB software. Numerical solutions with finite difference Euler’s method were used to solve the equations describe the drying steps. The theoretical results were then formulated in figures to show the behaviour of the whole drying process. Comparison of the theoretical results from this study with experimental data was left for the upcoming article.
Keywords: mathematical model, superheated steam, drying, initial condensation, receding core model 1. Introduction
Drying can be defined as removing a specific amount of water from the materials due to evaporation by applying of heat under controlled condition. The main aim of the process is to increase the storage life of the materials and decrease its transportation cost. The reduction in the amount of water content of the materials reduces the water activity. This will inhibit microbial growth at the period of storing. Goals of research in improving current drying technologies are to improve the economics of operation such as reduce energy consumption, increase capacity, reduce size of equipment, increase ease of control and environmental considerations (minimize energy consumption, reduce emissions, increase safety). In addition, improve the product quality in regards to: uniform drying, minimize chemical, physical and nutritional degradation (Pronyk et al., 2004). There are two drying methods in respect of the drying medium, drying by hot gases like air and the other method is drying by hot solvents vapour like water steam. However hot air has been used for decades as a cheap drying medium, steam emerged as a drying gas that suitable for explosive materials like coals.
1.1 Steam Drying and Air Drying
Research in steam and superheated steam drying has revealed great advantages of steam drying over air drying. Environmental pollution or odour emission to the atmosphere can be eliminated since drying occurs in closed chamber without air (Soponronnarit et al., 2006). It has been reported that higher quality products can be achieved with superheated steam drying specially for starch-based products. For example, higher head rice yield compare with hot air drying due to faster development of starch gelatinization, resulting in strengthening of intermolecular binding forces among starch granules (Soponronnarit et al., 2006). Absence of oxygen prevents oxidative reaction which is promoted by native enzymes leading to coloured compounds which undermines the product quality (Elustondo et al., 2001). Superheated steam drying of biomass gives the possibility of softening the wood tissue before palletisation. Furthermore, in regards to anaerobic environment, the oxidation is avoided (Pakowiski et al., 2007).
through the process (Beeby, 1984). The recirculating drying of super heated steam and eliminating air through the dryer are energy saving, the only energy leaving the system is the extra vapour that have been evaporated from the materials under drying. Super heated steams are suitable for combustible solids such as coals where it reduces risk of explosion and fire hazards. Also, inert gases may be used for start up and shut down the system to avoid combustion or fire in the case of drying combustible solids. The control on the quality of the product is easier by monitoring the steam temperature, because the drying rates and final moisture content are function of the drying medium temperature. Dust collection in superheated steam drying is much simpler by passing the excess vapour through condensers (Trommelen & Crosby, 1969). Deventer and Heijmans (2001) gave some examples in regards to steam drying benefits and restrictions of superheated steam drying. Pronyk et al. (2004) illustrated that the use of superheated steam as a drying medium for non-temperature sensitive products has many potential benefits to the consumer and the industry. Use of superheated steam can lead to energy savings as high as 50–80% over use of hot air or flue gases. These savings can be achieved due to higher heat transfer coefficients and the increased drying rates in the constant and falling periods if the steam temperature is above the inversion temperature. The drying at the constant rate period is longer in superheated steam drying, thus providing high drying rates for longer periods of time. Some valuable volatile organic compounds generated from the drying material can be recovered and separated by a condenser (Tang & Cenkowski, 2003; Wimmerstedt & Hager, 1996). Some applications involving steam drying are: drying of fuels and biofuels with high moisture contents prior to combustion in a boiler, Cattle feed exemplified by sugar beet pulp, lumber, paper pulp, paper and sludge (Wimmerstedt & Hager, 1996).
Superheated steam cannot be used for temperature sensitive materials as it is operated at high temperature, while operation under vacuum to reduce boiling point will add more complexity to the process and equipments costs. To reduce the temperature of a drop of water from 100 oC to 86 oC, this would require operating either at 0.6 atm or with 40% air present (Trommelen & Crosby, 1969). Also better and higher insulation are required for the drying surfaces to avoid condensation. It has been recommended that before using steam for drying, hot air should be used for worming up the system until the temperature in the drying compartment reaches the desired temperature (Soponronnarit et al., 2006). Berghel and Renstrom (2002) built a drying system following the requirement of industry. Tests with sawdust carried out in a fluidized bed and willow wood chips were done in a fixed bed. They showed that even with very small steam leaks, there is a significant decline in the energy efficiency of the dryer. Also, the material input and output to/from the dryer are very difficult to seal. However there are some limitations for using superheated steam as a drying medium, proof of principles for steam drying of paper and textile have been accomplished (Deventer & Heijmans, 2001).
1.2 Drying Models
There are two different mechanisms presented in literature in regards to modelling drying under superheated steam. The first is receding core model where evaporation occurs only at a drying front, the front moves from the surface of the particle to the core as drying progresses. And the second is the thin-layer model which assumes that the loss of moisture is at an exponential rate due to internal water diffusion to the grain surface at which the vaporization occurs. These two mechanisms are describing only the falling rate period. Most of researchers assumed, for the constant rate period, a simple polynomial equation that takes in consideration two factors: temperature and flow rate of the drying medium.
1.2.1 Receding Core Model
layer below the surface. Khan et al. (1991) studied both single porous particle and a backed bed drying under superheated steam. The single particle model was incorporated into an overall model for drying in a backed bed. Interface receding theory was used to model the evaporation from the single particle. Hager et al. (1997 and 2000) developed a model for superheated steam of a single porous spherical ceramic material. In their research, different mechanisms were used to present superheated steam drying. Mass transfer due to capillary forces is assumed to be dominating initially then this mechanism replaced by pressure-driven gaseous flow as the internal pressure increase. These two mechanisms assumed to follow Darcy’s law. The porous material was assumed to have cylindrical pores, and tortuosity factor was the only adjustable parameter. This model not only ignores the initial condensation and the increase in the moisture content during the heating period but it is also very complicated in practice. Elustondo et al. (2001 and 2002) described the drying process by dividing it to four period; (1) short initial unsteady warming-up period, (2) constant rate period where evaporation takes place at the external surface of the sample due to external heat transfer, (3) the falling rate period starts when diffusion is not fast enough to compensate the evaporated water from the surface, in this situation a dry layer starts to grow increasing the resistance to heat conduction and making the rate to full, (4) finally when the free water is totally removed and the final water content approach the hygroscopic equilibrium value, the temperature of the sample will start to rise. Those models discussed above did not present the all steps of the drying process under steam because they did not count for the initial condensation neither for the change in moisture content during the heating period. These two neglected phenomena are very important in any drying systems. Soponronnarit et al. (2006) used a model that count for the initial condensation and the increase in the moisture content of the materials. The model was formulated for drying in a backed bed rather than single particle. This model did not use the receding core model.
1.2.2 Thin-Layer Model
Another number of studies carried out by Prachayawarakorn et al. (2002), Babalis et al. (2006), Soponronnarit et al. (2006), Chemkhi and Zagrouba (2005), Suvarnakuta et al. (2007), Tarasov and Basargin (1975) and Pronyk et al. (2004) have used Fick’s unsteady state equation to describe the drying rate of spherical geometry. The effective diffusion coefficient was estimated from the experiments to show the difference between the drying in superheated steam and hot air. Crank in 1975 presented an analytical solution of the Fick’s equation for various geometries. This model was formulated to describe the drying in hot air rather than steam.
1.3 Study Aim
The aim of this study is to combine all the three major steps that take place during drying under superheated steam. First step is initial condensation which happens at the early stage of drying. This then leads to the second step which is diffusion of the condensed water to the interior of the particle. This step is responsible of increasing the particle’s initial moisture content. The last step starts when the particle reaches the saturation temperature. This step includes; evaporation of the initially condensed water and then evaporation of the materials’ free water content at a constant rate. At the constant rate period evaporation only takes place at the surface or the first layer of the material. The evaporated moisture from the surface will be replaced by migration from interior. Finally falling rate period begins, at this step heat conduction through the particle is assumed the limiting step. In this article, these steps were modelled separately using finite difference method and MATLAB software. As there is no study presents all these steps in a single article, for this reason this article was emerged. 2. Mathematical Modelling
Mathematical models should enable good process design and minimize costs while keeping quality constraints. A common modelling approach is to assume that one transfer mechanism is a rate controlling among the three mechanisms that control drying under superheated steam. These three mechanisms are: firstly, external heat transfer which is function of the heat transfer rate by convection and radiation from the drying medium to the surface of the material; secondly, internal heat transfer which is function of the heat transfer by conduction through the particle, and finally, internal mass transfer which is function of the permeability of the particle. Mathematical models that show the changes in temperature and moisture content as function of time for a single porous spherical particle were developed for drying under superheated steam. The following are the steps:
2.1 Initial Condensation, Heating Period
condensation of superheated steam on the material’s surface. This phenomenon greatly influences the material quality after drying. It is also responsible for quickly heating even the interior of the material. Furthermore, it increases the moisture content of the region slightly inward from the surface. They also showed that drying under superheated steam is independent of moisture diffusion coefficient (mass transfer) and is more dominants by heat transfer (conduction). Kozanoglu et al. (2006) did not register initial condensation as a result of additional heat supplied by the resistance installed on the wall of the dryer. They showed that there was a decrease in the amount of condensation in the initial period of the process by increasing the dryer’s wall temperature. In case of reduced operating pressure, a given operating temperature correspond to a higher degree of superheating:
T To Ts a t
This will participate in achieving a process without initial condensation. The decrease in the operating pressure produces slightly higher final moisture content. The impact of the vacuum conditions is decrease the saturation temperature and as a result it increases the degree of superheating.
Initially as a particle with a low temperature get in to contact with the drying medium, super heated steam (SHS) in this case, this naturally lead to steam condensation on its surface and increase in the particle moisture content. This period is called heating period where the condensation continues and the particle’s temperature increases until it reaches the boiling point of the solvent. Assumptions were made that the whole particle is covered by a layer of condensed water distributed uniformly over the surface of the particle. Also assumed, there is no temperature gradient through the particle during the heating period. The temperature of the particle in this period represents the whole particle. After the temperature of the particle reaches the boiling point of the solvent, which is in case of water 100 oC, this is true under atmospheric operating pressure. Condensation will stop and evaporation will take over while diffusion of the moisture through the particle continues during the entire period of both initial condensation and evaporation.
The instantaneous location of the thin layer of the condensed water is referred to as
r
, noter
R
, whereR
is the particle radius. Assuming the temperature of the particle is especially uniform at this period. Heat transfer by convection to a spherical particle, neglecting the radiation (Chen & Agarwal, 2000), can be present by Equation (1). Equation (1) is a result of energy balance over isothermal spherical particle covered by a layer of condensed water, with radius
r
and temperatureT
p;
3 2 3 23 1 .h .
d . C M .C ( ) C .T ( g p ) . T T vap dr r R
s p.s s in p.w w p.w p g p w
dt R R dt
(1)
Where;
h( g p ) heat transfer coefficient between the SHS medium and the surface of the particle;
Tg temperature of the drying medium (SHS); Tp temperature of the particle ( the whole particle);
, C w p.w
density and specific heat of water;
, C s p.s
density and specific heat of solid material;
vap
latent heat of vaporization of water;
r variation in the particle radius due to condensation and evaporation;
R initial radius of the particle;
M in initial moisture content of the particle;
r R
dimensionless radius.
perfectly isolated) (Elustondo et al., 2002).
The following initial conditions were assumed to start the modelling:
r( i ) R initial particle radius;
0
( j ) ( )
Tp Tp initial particle temperature (t 0); t
time interval;
i, j represents position and time, respectively.
The temperature of the particle after a time interval of
t
depends on the numbers of water layers condense over its surface. Using numerical method, finite deference Euler’s method, Equation (1) can be solved for the particle’s temperature as shown in Equation (2):
3 3 2 3 2
1 1 1
1
r( i ) ( j ) .h( g p ) ( i )r ( j ) vap w ( i )r r( i ) ( i )r
C M .C C .T t . . T T
s p.s s in p.w R w p.w p R R g p R R t
( j ) Tp
r( i )
C M .C
s p.s s in p.w R
3 1 r R C w p.w (2)
In order to solve equation (2) for the particle temperature ( j1)
Tp as function of time intervals, it needs to
consider the radius of the particle r(i1), actually the radius of the particle adding to it the thickness of the condensed water, the actual particle radius was assumed constant, at each layer of water condensed on its surface.
When free water is in contact with pure vapour, the equilibrium rate of molecule transfer from vapour to the liquid phase and from the liquid to the vapour phase is given by the kinetic theory of gases. When the system is not at equilibrium, the net rate of evaporation or condensation per unit droplet (particle covered completely by water layers) surface area is governed by modified Hertz-Kundsen equation (Chen & Agarwal, 2000). This equation was first proposed by Alty 1931 (Maa, 1967). Maa (1967) studied the evaporation rate of different solvents including water. The study shows that there is little or no resistance to molecules crossing the vapour-liquid interface. This means that the evaporation coefficient is unity. Equation (3) shows the evaporation-condensation rate of water as presented by Maa (1967):
2
Psat( T )
M P
dr w p atm
. .
w dt . .R T T
g p g
(3)
Where,
atm
P
operation Pressure of the drying medium;) (Tp
sat
P
saturation vapour pressure of condensed water at particle “surface” temperature;w
M
molecular weight of water;g
R
universal gas constant.The saturation vapour’s pressure of water at different particle’s surface temperature, actually the water shell around the particle, can be given by Equation (4) (Antoine’s equation);
16 387 3885 7 230 17
LnPsat( T ) . . / ( Tp . )
p (4)
Using numerical method, finite deference Euler’s method, Equations (3) and (4) can be rewritten as following;
1 2
P ( j )
sat ( T )
M P
t w p atm
r( i ) r( i ) .
. .R ( j ) T
w g T p g
16 387 3885 7 ( j ) 230 17
LnP ( j ) . . / ( Tp . )
sat( Tp ) (6)
Equation (5) and (6) can be used to predict the condensation-evaporation time interval and the amount of water condensed over the particle.
The evaporation will start when the temperature of the particle reaches approximately 100 oC. At this temperature the thickness of the condensed water on the surface of the particle is known from Equations (5) and (6). The evaporation will occur at constant particle temperature. The evaporation will be dominated by heat transfer between the condensed water and the drying medium. At this period an assumption was made that the whole particle is a droplet of water at 100 oC until the entire condensed water evaporates. Energy balance over a droplet of water can be present by Equation (7);
3
C .R dT dr
w p.w p
. dt h( g p ).( Tg T )p w vap dt
(7)
For constant particle temperature at 100 oC, dTp 0 dt
h dr ( g p )
.( Tg T )p dt w vap
(8)
Where Tp Tw 100 oC
The radius of the condensed water depend on the rate of evaporation from the droplet surface, by using numerical method, finite deference Euler’s method, Equation (8) can be rewritten as below;
1 h( g p )
r( i ) r( i ) dt . .( Tg T )p w vap
(9)
From the above Equations (2, 5, 6 and 9) final temperature of the particle can be found at the end of the heating period. The condensation–evaporation period (heating period) is very important for the calculation of the amount of moisture absorbed. Also, the thickness of the condensed water with time can be tracked.
Trommelen and Crosby (1969) demonstrated the use of correlations of heat transfer coefficient which is applicable for evaporation of small pure water drops in air is also valid for evaporation in superheated steam. Forced convective heat transfer can be assumed to take place between the bulk superheated steam and the particle surface either covered with water layer or not, proposed by Hager et al. (1997), Equation (10);
0 52 0 33
2 0 61
h( g p ) p.d . .
. . Re . Pr kg
(10)
) (g p
h
Average convective heat transfer coefficient, J/m2.k.s;g
k
Thermal conductivity of steam, J/m.k.s..u .d g g p Re
g
.C g p.g Pr
kg
g
density of the superheated steam;
g
u superficial velocity of the superheated steam;
g
viscosity of the superheated steam;
g p
C . heat capacity of the superheated steam.
2.2 Water Diffusion from the Surface Through the Particle
The moisture content of the particle will increase during the heating period due to diffusion of the condensed water at the surface to the interior of the particle. This phenomenon is important in dryers such as rotary drum dryer where the particles have much time for rest (contact with the surface) (Hamawand & Yusaf, 2013). Unlike fluidized bed dryers the water condensed on the particle surface evaporates in a shorter time due to continuous contact between the particles and the drying medium. The first layer of the particle’s surface will be saturated with moisture during the heating period. This can be described by the diffusion equation for a spherical particle (Soponronnarit et al., 2006; Chemkhi & Zagrouba, 2005), as shown in Equation (11);
2 2
2
M M M
Deff r R
t r r r
(11)
M
moisture content kg water / kg dry basis;eff
D
effective diffusivity coefficient m2/s.The effective diffusivity coefficient can be determined from the drying experiment itself as shown by Chemkhi and Zagrouba (2005) and Soponronnarit et al. (2006). Chemkhi and Zagrouba (2005), investigated the moisture diffusivity through a porous clay materials in air drying at different humidity. The moisture diffusivity can be estimated by: analysis of the drying data, sorption kinetics and permeability measurements. They estimated the effective diffusivity from the drying data, from the slope of the drying curve and/or from comparison of the experimental data with that predicted by Fick’s second law. Also, the equilibrium moisture content was estimated from the sorption isotherm of the particle. The effective diffusivity can be predicted by Equation (12);
Ea Deff D expo
R.T
(12)
Where;
a
E
activation energy;o
D
equation constant;g
R
Universal gas constant (J/mol.K);p
T
particle temperature (K);eff
D
effective diffusivity coefficient m2/s. 22
r Deff. t
in order to have the numerical solution stable.
Initial and boundary condition at this period are as following (Soponronnarit et al., 2006);
0
M( r ,t ) Min t
0
M( R,t ) Meq t , r R
0 0
0
M
t r r
can be rewritten as Equation (13);
2
1 1 1 2 1
2
( j ) ( j ) ( j ) ( j ) ( j )
M M M M M
( j ) ( j ) ( i ) ( i ) ( i ) ( i ) ( i )
M( i ) M( i ) t .Deff
r r
r ( i )
(13)
0 0 0
0 ( )0 ( )1 ( )2
t M( r ,t ) Min M( ) M( )M( )...
0 1 2
0
0 0 0
( ) ( ) ( )
r R M( R ,t ) Meq M( ) M( )M( )... t ,
0 ( j ) 1 0
r M( n ) M( n ) t
Where i and j represent position and time, respectively.
Equation (13) can be used to find the moisture content in each layer of the particle along the entire heating period where the diffusion occurs. During the heating period the particle absorb water through its surface. This absorbed water will distribute through the particle radially. The average moisture content at the end of heating period cab be estimated using Equation (14) (Soponronnarit et al., 2006);
4 2
0R
M( t ) r .M( r ,t )dr Vp
(14)
Using numerical integration, Simpson rule;
4 2 2 2
4 1 2
3 1 2
r
M( t ) . R .M( R ,t ) .r .M( r ,t ) r .M( r ,t ) Vp
(15)
Where
V
pis the particle volume (m3).The amount of water absorbed by the particle after an interval of
t
heatingperiod
t
diffusion;mabsorbed ( t ) m . Mp ( t )Min (16)
absorbed
m
the amount of water absorbed during the heating period (kg);p
m
solid weight of the dry particle (kg);
At the end of the heating period the average temperature and moisture content of the particle will be 100 oC, and
) (t
M
respectively.2.3 Constant Drying Rate Period
At the initial stage of drying, the drying rate is constant due to the vaporization of water at particle’s grain surface. This period is indicated by a line presenting moisture content versus drying time. The assumption is made that evaporation will start when the temperature of the materials reaches approximately 100 oC. The evaporation will be dominated by the heat transfer between the particle surface and the drying medium. The amount of water evaporates from the particle’s surface will be replaced by liquid diffusion from the inner region. At this period, another assumption was made that the whole particle is at 100 oC until the entire free water evaporates. Evaporation from a particle’s surface can be represents by Equation (17);
3
C .R dT dr
w p.w p
. dt h( g p ).( Tg T )p w vap dt
For constant particle temperature at 100 oC, dT p 0 dt
h dr ( g p )
.( Tg T )p dt w vap
(18)
Where Tp Tw 100 oC.
At this period, the evaporation will occur at the surface of the particle, so there is no change in the wet zone radius. Equation (18) can be rewritten in form of moisture content as shown in Equation (19);
h .A
dM ( g p ) s
.( Tg T )p dt vap
(19)
The amount of moisture can be calculated by Equation (20);
As
M( t ) M( o ) h( g p ). .( Tg T ).dtp vap
(20)
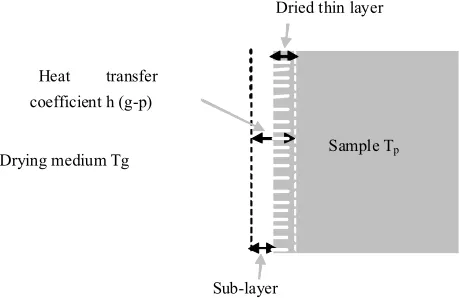
Where M(o) is the initial amount of moisture in the sample (kg water), and h(gp) is the heat transfer coefficient at the boundary of the sample as shown in Figure (1). By dividing Equation (20) by the initial weight of the sample, moisture content of the particle can be estimated. The initial weight of the sample can be formulated as in Equation (21);
1
Sample Weight s s. w.( s) .Vs (21)
Then, Equation (20) can be rewritten as moisture content on wet basis as in Equation (22);
3
1
.( Tg T ).dtp MC( t ) MC( o ) h( g p ).
.[ . ( )].r
eva s s w s
(22)
Where; MC(t)and MC(o)is the time dependent and initial moisture content on wet basis (kg water/ kg sample),
s
[image:9.595.176.408.578.727.2] is the density of the solid, w is the density of water,
sis the fraction of solid in the sample and (1s) is the fraction of water in the sample, Asis the cross sectional surface area, andr
is the radius of the sample.Figure 1. A schematic diagram for the heat transfer boundary
Dried thin layer
Sub-layer Heat transfer
coefficient h (g-p)
2.4 Falling Rate Period
The temperature distribution in a spherical dry particle can be presented by the differential equation below. The heat transfers from the drying medium to the particle surface by convection and then through the particle by conduction;
2 2 2
Tp T T
p p
. r R
t r r r
(23)
Using numerical method, finite deference Euler’s method, with an explicit formulation, Equation (23) can be rewritten as;
2
1 1 1 2 1
2
( j ) ( j ) ( j ) ( j ) ( j )
T T T T T
( j ) ( j ) p( i ) p( i ) p( i ) p( i ) p( i ) Tp( i ) Tp( i ) t . .
r r
r ( i )
(24)
Where, p p p p C k . .
, and 2
. 2 t r
in order to have the numerical solution stable;
Where;
p
k thermal resistance of the particle materials, it is between kp.dry and kp.wet;
p
density of the particle, it is between p.dry and p.wet;
p p
C . specific heat capacity, it is between Cp.dry and Cp.wet.
The initial and boundary condition at this period are;
0
100 0
( )
Tp Tp( i ) C t
Tp h( g p )
Tg Tp r R r k p
0 0 Tp r r
Equation (24) can be used to predict the change in temperature of each layer
dr
with time directly after the recession of its moisture. The Assumption was made that the temperature of each layer is constant during the recession of its moisture and kept at 100 oC. After this period, the temperature of the particle’s layer went through recession will start to rise due to equation (24). In order to solve equation (24) for temperature gradient through the particle, the time interval for recession of moisture from each layer need to be predicted. Energy balance over the first layer can be presents by Equation (25);dr
h( g p ) ( Tg T )p vap( Min M ).c p dt. (25)
Equation (25) can be rewritten in numerical formula as;
1
0 373 1
( j ) dt .h( g p )( Tg Tp( i ))
dr ( M M ).
vap in c p
( )
Tp( ) K
(26)
1 1
h( g p ) Tp( i ) dr . .Tg
k p
Tp( i ) r R
h( g p ) dr
k p
(27)
By assuming the value of
dt
in Equation (26), the location of the interface after moisture recession from the first layer can be predicted, during this period the temperature of each layer is assumed constant at 100 oC. After elapsed time ofdt
, the first layer become dry. At the next time intervaldt
, the first layer will start to heat up over 100 oC, its temperature can be calculated using Equation (27). For the second and the following layers, Equation (28) below can be used to estimate the thickness (or location) of each layer goes under recession;dTp dr
kp vap( Min M ).c p.
dr dt (28)
Equation (28) can be written numerically as;
1
1
T T
k dtp p( i ) p( i )
r( i ) r( i ) . .
( Min M )c vap.p
(29)
Where Mc is the critical moisture content of the particle.
The moisture content can be calculated as function of time by conducting material balance over each layer, as shown in Equation (30);
3 4 3
0 / .( r( i ))
M M .
Vt
(30)
The equation above gives the accumulated moisture content as function of location. 3. Materials Properties
A porous particle is consisting of the solid structure of the particle and the moisture filling the vacancies. The properties of the particle will changes after evaporation of the entire water content. When the water begin to evaporate from the particles pores, the particle will be consists of the solid structure and vapour in the pores. For this reason the properties of the particle such as; density, specific heat, and thermal conductivity [p,Cp,p,kp] most be predicted at different period and positions, the effect of temperature can be neglected (Iyota et al., 2001). Shibata et al. (1988) presented a simplified quantitative presence of each component to the relationship. At the wet zone, the particle is composed of solid structure with water filling the pores; therefore the density of the particle at this zone is;
s in w
wet
p
M
.
(
1
)(
1
).
As the water in the pores evaporate due to conductive heat transfer, the water in the pore will replaced by the steam. Then the density of the particle at the dry zone is;
v v s c v
dry
p
M
.
(
1
)(
1
).
The same treatment for the density will be used for predicting the specific heat and the thermal conductivity, the specific heat capacity in the wet zone becomes;
)
)(
1
(
. ..
. w ps pw in
w p
s wet
p
C
C
M
C
v p v d p
v c w p s p v d p
s dry
p
C
C
M
C
C
.. .
. .
.
(
1
)(
)
.
.
The thermal conductivity at the wet zone will be;
w w w s wet
p
k
k
k
.
(
1
)
The thermal conductivity at the dry zone can be represented as;
v s v c
s w
v s
w s dry
p
k
k
M
k
k
k
k
.
)
1
(
)
(
1
).
(
.
Where subscripts
w
,
s
,
v
represent the liquid, solid, and vapour components,
v,
w are the mass fraction of vapour and water in the particle. As the vapour will replace the water during the recession, then
v
w and the mass fraction of the solid can be represented by;)
1
(
ws
Iyota et al. (2001) assumed that the physical properties are constant in regards to temperature, and the apparent physical values of compound can be driven from the specific solid and water values with regards to moisture content. Tang and Cenkowski, (2000, 2003), gave a formula for the density of super heated steam as;
s s
0
.
7401
0
.
001505
.
T
ps
C for steam change between 100 to 200 oC as 2024 to 1975 J/kg.C
w
C specific heat of moisture , 4193 between 0 to 100 oC , and 4313 between 100 to 200 oC. 4. Modelling Results
4.1 Initial Condensation
Figure 2. Particle temperature during initial condensation
4.2 Initial Evaporation
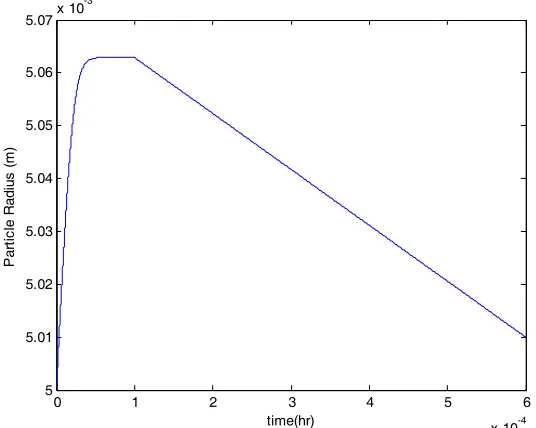
This step estimates the evaporation rate of the initial liquid condensed during the heating period. Equation (8) estimates this by considering the radius of the particle as indication of the amount of the evaporated water. By dividing the changes in the radius of the particle over the time interval, the rate of evaporation can be predicted. In the first part of Figure (3), the rising part of the curve presents the data predicted from both Equations (6) and (7). These two equations estimate the amount of condensed vapour using the radius of the particle as indication. Whenever the temperature of the condensed vapour is below water boiling temperature or its partial pressure is below the saturation, the condensation will continue. In the second part of Figure (3), the declined line is presenting the evaporation period. As the figure shows, the evaporation happens at a constant rate (constant slope), this is because the evaporation is happening from a surface covered with free water. Although, the surface area of evaporation is changing because of the reduction in the radius of the condensed layer; it was neglected due to its small thickness.
Figure 3. Particle radius during initial condensation and later evaporation
0 0.2 0.4 0.6 0.8 1 1.2
x 10-4 290
300 310 320 330 340 350 360 370
time(hr)
P
ar
tic
le
T
em
per
at
ur
e (K
)
0 1 2 3 4 5 6
x 10-4 5
5.01 5.02 5.03 5.04 5.05 5.06 5.07x 10
-3
time(hr)
P
ar
tic
le
Radi
us
(
m
[image:13.595.165.433.491.705.2]4.3 Diffusion of Moisture from the Surface to the Interior of the Particle
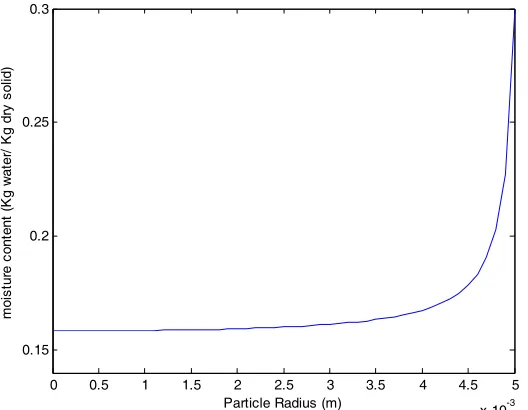
[image:14.595.168.432.215.420.2]This step estimates the moisture distribution through the interior of the particle during the heating period using Equation (13). Also, it estimates the change in the amount of the particle’s moisture content (average moisture content) using Equation (14). As shown in Figure (4), the average moisture content of the particle was raised from 0.15 (initial moisture content) to 0.1683 during the heating period. The curve in Figure (4) shows the distribution of moisture in the particle starting from the surface to the centre. The first layer of the particle is at saturation because the surface is covered totally by a layer of condensed water. The moisture diffuses from the surface to the interior in a decline sequence due to the resistance to diffusion. The shape of the curve in Figure (4) depends on the time interval of this period (heating period). As the interval of the heating period increases, the average moisture content of the particle increases as well.
Figure 4. Distribution of moisture through the particle during heating period, the Average Moisture content of the particle rose from 0.15 to 0.1683
4.4 Drying
This period was divided to two steps; the constant rate period and the falling rate period. 4.4.1 Constant Rate Period
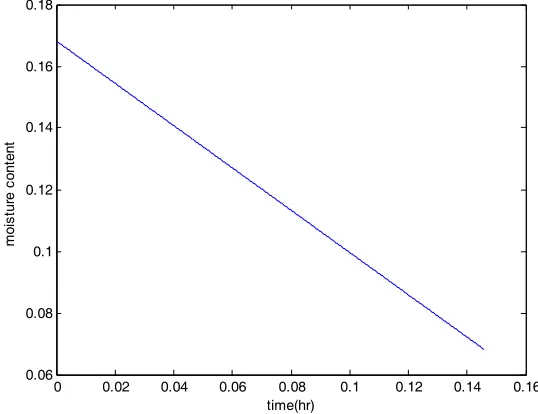
This step estimates the moisture content of the particle as function of heat transfer coefficient. This period assumes that the evaporation of the moisture happen only at the surface of the particle because migration of moisture from the interior of the particle to the surface is higher than the evaporation rate at the surface. Equation (22) estimates the amount of moisture loses as function of time as shown in Figure (5). Figure (5) shows a linear decline in the moisture content because at the constant rate period it was assumed that evaporation is happening from a layer of free water at the surface. In this period the surface of the particle will be covered by a layer of migrated moisture until no more moisture can be supported by diffusion from inside of the particle.
0 0.5 1 1.5 2 2.5 3 3.5 4 4.5 5 x 10⁻³ 0.15
0.2 0.25 0.3
m
oi
st
ur
e c
ont
ent
(
K
g w
at
er
/
K
g
dr
y s
ol
id)
Figure 5. Moisture content during constant rate period
4.4.2 Falling Rate Period, Recession of Moisture Content Controlled by Heat Conduction
This step estimates the temperature distribution along the radius of the particle using Equation (24). Also, Equation (27) was used to predict the temperature of the first layer of the particle. To estimate the recession of moisture from each layer of the particle starting from the surface, Equation (29) was used to locate the dried layers movements through the particle. The result from this equation then can be used to calculate the moisture content of the particle via Equation (30) when the geometry of the particle is known.
[image:15.595.178.418.549.732.2]Figure (6) shows the temperature at two points in the particle, the surface and the centre of the particle. The curve at the top is representing the particle surface temperature. The temperature of the first layer at the surface of the particle rises to water boiling temperature in a very short period. Recalling Figure (3), it takes less than one second for the temperature at the surface of the particle to rise to 100 oC (depend on the particle size). This temperature then remains constant at 100 oC until the particle’s moisture content reaches a critical. After this point the curve rises sharply because the surface of the particle is dry and it is no more been cooled via evaporation. Similar result is shown in Figure (6) for the particle’s centre temperature. The lower curve shows that the temperature at the centre remains at its initial temperature, after rising to 100 oC, for the whole heating period. This is because the heat transferred from the drying medium is consumed by the evaporation at the surface. For this reason its temperature will only start to rise when the surface is dry and the heat intrude the interior of the particle.
Figure 6. Temperature at the surface and the centre of the particle
0 0.02 0.04 0.06 0.08 0.1 0.12 0.14 0.16 0.06
0.08 0.1 0.12 0.14 0.16 0.18
time(hr)
m
oi
st
ur
e c
ont
ent
0 0.05 0.1 0.15 0.2 0.25 0.3 0.35 0.4 0.45 0.5 370
375 380 385 390 395 400
time(hr)
T
em
pe
rat
ur
e (
C
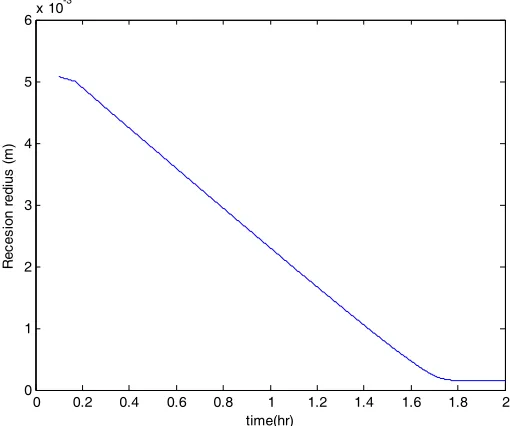
The moisture content of the particle during this period decreases smoothly from the critical moisture content to the equilibrium moisture content. In this period, the heat will transfer through the interior of the particle via conduction and recession of moisture will take place in each layer starting from the surface. As shown in Figure (7), this period takes longer time by many magnitudes compared to the constant rate period. This is due to high resistance to heat conduction and the difficulties associated with the receding moisture from a critical value to equilibrium moisture content. Critical moisture content represents the moisture that is available in the cell of the materials. As the recession go deeper through the particle, the resistance to the heat conduction increases. This explains the semi-flatten curve after long time of drying. The model also shows the position of the moisture as receding through the particle. Figure (8) illustrates the time required for each layer of the particle to dry to their equilibrium moisture content. The linearity in this relation is due to regular increase in the time of recession of each layer. When all the layers of the particle reach the equilibrium moisture content, the line flatten because there is no more moisture is available, except that chemically bonded.
Figure 7. Moisture content during the falling rate period
Figure 8. Recession of moisture through the particle
0.1 0.2 0.3 0.4 0.5 0.6 0.7 0.8 0.9 1 0
0.01 0.02 0.03 0.04 0.05 0.06 0.07
time(hr)
M
oi
st
ur
e c
on
tent
(
K
g/
K
g)
0 0.2 0.4 0.6 0.8 1 1.2 1.4 1.6 1.8 2 0
1 2 3 4 5 6x 10
-3
time(hr)
R
ec
es
ion r
edi
us
(
m
[image:16.595.171.426.483.696.2]5. Conclusion
The models have been applied in this research are results of literature review conducted in the field of drying under superheated steam. Also, energy balance was conducted in some other occasions. This paper is combining different models presented by many researchers in this filed to come up with a complete modelling sets for the entire drying steps under superheated steam. Finite difference with the aid of MATLAB software was used in order to apply the models. The theoretical results predicted from the models illustrate the drying behaviour under superheated steam. However, experiments were not conducted, the trends of the results are agreeing with the actual behaviour of drying under superheated steam. This article successfully presented a literature review focused on the modelling of drying under superheated steam. Also, full details in regards to modelling the all steps that take place under superheated steam drying were demonstrated.
Nomenclature
Symbol Description Unit Values assumed
) (g p
h
heat transfer coefficient between the SHS mediumand the surface of the particle. J /m
2.k.s 110-135
g
T
temperature of the SHS K 398-423-448) 0 (
p
T initial temperature of the particle K 298
w
density of water Kg/ m3 1000w p
C . specific heat of water KJ/ Kg.K 4.27
s
density of particle material (ceramic) Kg/ m3 1600s p
C . specific heat of particle material KJ/ Kg.K 0.64
v
density of the steam Kg/ m3 0.565v p
C. specific heat of the steam KJ/ Kg.K 2.007
vap
latent heat of vaporization of water KJ / Kg 2598R radius of the particle m 5 E-3
in
M initial moisture content of the particle Kg water/ Kg dry
solid 0.15
c
M critical moisture content of the particle Kg water/ Kg dry
solid 0.01
t
time interval s 3 E-8atm
P vapour pressure of the super heated steam KN/ m2 100
w
M molecular weight of water Kg / mol 18
g
R universal gas constant J / mol.K 8.314
g
k
thermal conductivity of steam J / m.k.s 2.48E-02g
u
superficial velocity of the steam m/ s 2.7g
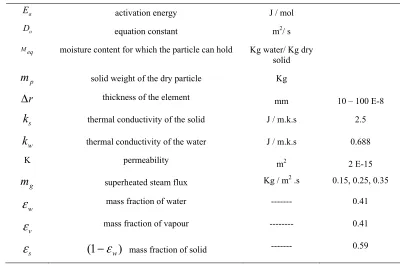
viscosity of the steam Pa.s 1.30211E-05eff
a
E activation energy J / mol
o
D equation constant m2/ s
M eq moisture content for which the particle can hold Kg water/ Kg dry solid
p
m
solid weight of the dry particle Kgr
thickness of the element mm 10 – 100 E-8s
k
thermal conductivity of the solid J / m.k.s 2.5w
k
thermal conductivity of the water J / m.k.s 0.688K permeability m2 2 E-15
g
m
superheated steam flux Kg / m2 .s 0.15, 0.25, 0.35w
mass fraction of water --- 0.41v
mass fraction of vapour --- 0.41s
(
1
w)
mass fraction of solid --- 0.59References
Agarwal, P. K., Genetti, W. E., & Lee, Y. Y. (1986). Coupled drying and devolatilization of coal in fluidized bed.
Chem. Eng. Science,41(9), 2373-2383. http://dx.doi.org/10.1016/0009-2509(86)85087-4
Babalis, S. J., Papanicolaou, E., Kyriakis, N., & Belessitis, V. G. (2006). Evaluation of thin-layer models for describing drying kinetics of figs. Journal of Food Engineering, 75, 205-214. http://dx.doi.org/10.1016/j.jfoodeng.2005.04.008
Beeby, C. (1984). Drying in Superheated steam-fluidized bed (PhD thesis). University of Monash, Chem. Eng. Dept, Australia.
Berghel, J., & Renstrom, R. (2002). Basic design criteria and corresponding results performance of a pilot-scale fluidized superheated atmospheric condition steam dryer. Biomass and Bioenergy, 23, 103-112. http://dx.doi.org/10.1016/S0961-9534(02)00040-5
Chemkhi, S., & Zagrouba, F. (2005). Water diffusion coefficient in clay material from drying data. Desalination, 185(1-3), 491-98. http://dx.doi.org/10.1016/j.desal.2005.04.052
Chen, Z., Wu, W., & Agarwal, P. K. (2000). Steam drying of coal part 1. Modeling the behavior of a single particle. Fuel, 79(8), 961-74. http://dx.doi.org/10.1016/S0016-2361(99)00217-3
Deventer, H. C., & Heijmans R. M. H. (2001). Drying with superheated steam. Drying Technology, 19(8), 2033-2045. http://dx.doi.org/10.1081/DRT-100107287
Elustondo, D. M., Mujumdar, A. S., & Urbicain, M. J. (2002). Optimum operating conditions in drying foodstuffs with superheated steam. Drying Technology, 20(2), 381-402. http://dx.doi.org/10.1081/DRT-120002548
Elustondo, D., Elustondo, M. P., & Urbicain, M. J. (2001). Mathematical modelling of moisture evaporation from foodstuffs exposed to subatmospheric pressure superheated steam. Journal of Food Engineering,49, 15-24. http://dx.doi.org/10.1016/S0260-8774(00)00180-1
Hager, J., Hermansson, M., & Wimmerstedt, R. (1997). Modelling steam drying of single porous ceramic sphere: Experiments and simulation. Che. Eng. Science, 52(8), 1253-64. http://dx.doi.org/10.1016/S0009-2509(96)00493-9
[image:18.595.94.494.68.338.2]in Superheated Steam. International Journal of Engineering, 24(2), 119-126.
Hamawand, I., & Yusaf, T. (2013). Particles Motion in a Cascading Rotary Drum Dryer. Canadian Journal of Chemical Engineering. In Press. http://dx.doi.org/10.1002/cjce.21845
Iyota, H., Nishimura, N., Yoshida, M., & Nomura. (2001). Simulation of superheated steam drying considering initial steam condensation. Drying Technology, 19(7), 1425-1440. http://dx.doi.org/10.1081/DRT-100105298
Khan, J. A., Beasley, D. E., & Alatas, B. (1991). Evaporation from packed bed of porous particles into superheated vapour. Int. J. Heat Mass Transfer, 34(1), 267-280. http://dx.doi.org/10.1016/0017-9310(91)90193-I
Kozanoglu, B., Vasquez, A., Chanes, J., & Patino, J. (2006). Drying of seed in superheated steam vacuum fluidized bed. Journal of Food Engineering, 75, 383-387. http://dx.doi.org/10.1016/j.jfoodeng.2005.03.063 Looi, A. Y., Golonka, K., & Rhodes, M. (2002). Drying kinetics of single porous particles in superheated steam
under pressure. Chemical Engineering Journal, 87, 329-338.
http://dx.doi.org/10.1016/S1385-8947(01)00244-3
Maa, J. (1967). Evaporation coefficient of liquid. Ind. Eng. Chem. Fundam, 6(4), 504-18. http://dx.doi.org/10.1021/i160024a005
Pakowiski, Z., Krupinka, B., & Adamski, R. (2007). Prediction of sorption equilibrium both in air and superheated steam drying of energetic variety of willow salix viminalis in wide temperature range. Fuel, 86, 1749-1757. http://dx.doi.org/10.1016/j.fuel.2007.01.016
Prachayawarakorn, S., Soponronnarit, S., Wetchacama, S., & Jaisut, D. (2002). Desorption isotherms and drying characteristics of shrimp in superheated steam and hot air. Drying Technology, 20(3), 669-684. http://dx.doi.org/10.1081/DRT-120002823
Pronyk, C., Cenkowski, S., & Muir, W. E. (2004). Drying foodstuff with superheated steam. Drying Technology, 22(5), 899-916. http://dx.doi.org/10.1081/DRT-120038571
Shibata, H., Mada, J., & Shinohara, H. (1988). Drying mechanism of sintered spheres of glass beads in superheated steam. Industrial & engineering chemistry research, 27(12), 2353-2362. http://dx.doi.org/10.1021/ie00084a020
Soponronnarit, S., Prachayawarakorn, S., Rordprat, W., Nathakaranakule, A., & Tia, W. (2006). A superheated steam fluidized bed dryer for Parboiled Rice: testing of pilot-scale and mathematical Model Development.
Drying technology, 24(11), 1457-67. http://dx.doi.org/10.1080/07373930600952800
Suvarnakuta, P., Devahastin, S., & Mujumdar, A. S. (2007). A mathematical model for low pressure superheated steam drying of biomaterial. Chemical Engineering and Processing, 46(7), 675-683. http://dx.doi.org/10.1016/j.cep.2006.09.002
Tang, Z., & Cenkowski, S. (2000). Dehydration dynamics of potatoes in superheated steam and hot air.
Canadian Agricultural Engineering, 42(1), 1-13.
Tang, Z., & Cenkowski, S. (2003). Modelling the superheated steam drying of a fixed bed of Brewers’ spent grain. Biosystems Engineering, 87(1), 67-77.
Tarasov, V. M., & Basargin, B. N. (1975). Kinetics of drying of moist materials in superheated steam. Translated from Inzhenerno-Fizicheskii Zhurnal, 28(1), 34-39.
Trommelen, A. M., & Crosby, E. J. (1969). Evaporation and drying of drops in superheated vapours. AICHE Journal, 16(5), 857-67. http://dx.doi.org/10.1002/aic.690160527
Wimmerstedt, R., & Hager, J. (1996). Steam drying–modelling and applications. Drying Technology, 14(5), 1099-1119. http://dx.doi.org/10.1080/07373939608917141
Copyrights
Copyright for this article is retained by the author(s), with first publication rights granted to the journal.