RESEARCH
Reduced eIF3d accelerates HIV disease
progression by attenuating CD8
+
T cell function
Ying Pan
1,2,3,4, Zi‑Ning Zhang
1,2,3,4, Lin‑Bo Yin
1,2,3,4, Ya‑Jing Fu
1,2,3,4, Yong‑Jun Jiang
1,2,3,4and Hong Shang
1,2,3,4*Abstract
Background: In human immunodeficiency virus (HIV) infection, 10–15% of individuals exhibit a rapid decline in CD4+ T cells and become rapid progressors (RPs). Overall, understanding the factors affecting rapid disease progres‑ sion in early HIV infection (EHI) can aid in treatment initiation. Recent studies show that eIF3s, classic scaffold proteins during the translation initiation process, can directly promote or inhibit the translation of mRNA, therefore partici‑ pating in the regulation of cell function. However, to our knowledge, it has not been addressed whether eIF3s are involved in the diverse prognosis of HIV infection.
Methods: Expression of eIF3s in primary cells from early or chronic HIV‑infected patients was detected by real‑time PCR. To investigate the potential mechanisms of eIF3d in the regulation of CD8+ T cell function, complete transcrip‑ tomes of eIF3d‑inhibited Jurkat T cells were sequenced by RNA sequencing (RNA‑Seq). Additionally, to examine the effect of eIF3d on CD8+ T cell function, eIF3d expression was inhibited alone or in combination with SOCS‑7 knock‑ down by siRNA in isolated CD8+ T cells. CD8+ T cell proliferation, IFN‑r secretion and apoptosis were detected by flow cytometry. Moreover, the effect of eIF3d on HIV replication was evaluated in Jurkat cells, peripheral blood mono‑ nuclear cells (PBMCs) and CD4+ T cells with eIF3d knockdown using a pNL4‑3 pseudotyped virus.
Results: At approximately 100 days of infection, only eIF3d was markedly decreased in RPs compared with chronic progressors (CPs). Expression of eIF3d correlated significantly with disease progression in EHI. Based on in vitro analy‑ ses, reduced eIF3d expression led to decreased proliferation and IFN‑γ secretion and increased apoptosis in CD8+ T cells. Inhibited expression of eIF3d caused enhanced expression of SOCS‑7, and inhibiting SOCS‑7 expression by siRNA rescued the attenuated CD8+ T cell function caused by eIF3d. Finally, when eIF3d was inhibited in Jurkat cells, PBMCs and CD4+ T cells, pNL4‑3‑VSV‑G virus replication was enhanced.
Conclusions: The current data highlight the importance of eIF3d in HIV infection by inhibiting CD8+ T cell function and promoting viral replication. Our study provides potential targets for improved immune intervention.
Keywords: HIV, Rapid progressors, CD8+ T cells, eIF3d, Proliferation, IFN‑γ, Apoptosis, SOCS‑7
© The Author(s) 2019. This article is distributed under the terms of the Creative Commons Attribution 4.0 International License (http://creat iveco mmons .org/licen ses/by/4.0/), which permits unrestricted use, distribution, and reproduction in any medium, provided you give appropriate credit to the original author(s) and the source, provide a link to the Creative Commons license, and indicate if changes were made. The Creative Commons Public Domain Dedication waiver (http://creat iveco mmons .org/ publi cdoma in/zero/1.0/) applies to the data made available in this article, unless otherwise stated.
Background
Untreated HIV-1 infection typically progresses to acquired immune deficiency syndrome (AIDS) within 8–10 years. However, 10–15% of individuals show a rapid decline in CD4+ T cells within 3 years of infec-tion; these patients are called rapid progressors (RPs)
[1–3]. Although previous studies have shown that
genetic background, viral factors and immunologi-cal status are all associated with the sharp reduction in CD4+ T cells in RPs [3–8], the underlying mechanisms have not been fully elucidated. Early HIV infection (EHI) is a condition that extends for approximately 6 months after infection. Events occurring during EHI are intrigu-ing because of their dramatic impact on the subsequent course of the disease [9, 10]. For example, depletion of
CD8+ T cell function, a key player in anti-HIV
immu-nity, in EHI is known to be a key characteristic of RPs [7,
11–19]. Understanding the factors affecting rapid disease
Open Access
*Correspondence: [email protected]
1 NHC Key Laboratory of AIDS Immunology (China Medical University),
Department of Laboratory Medicine, The First Affiliated Hospital of China Medical University, No 155, Nanjing North Street, He ping District, Shenyang, Liaoning 110001, China
progression in early HIV infection can aid in treatment commencement.
Eukaryotic initiation factor 3s (eIF3s), the largest and most complex eukaryotic translation initiation factor family, consist of 13 subunits [20, 21]. In addition to the classic role as scaffold proteins during the translation ini-tiation process, recent studies show that some eIF3 subu-nits directly promote or inhibit the translation of mRNA by binding to the 5′-end stem-loop structure of certain mRNAs during transcription, therefore participating in the regulation of cell functions such as proliferation and apoptosis [22]. For instance, knockout of eIF3b in renal cancer cells results in decreased cell proliferation and cell cycle arrest and increased apoptosis [23]. In prostate can-cer, levels of apoptosis in tumour cells with high eIF3d expression are reduced, with increased invasive ability and a poor prognosis [24]. Given the role of eIF3s in the pathogenesis of cancers [25, 26], the expression levels of eIF3s, including eIF3a, eIF3b, eIF3c and eIF3e, have been used as biomarkers in the prognosis of different diseases [27, 28]. In HIV infection, Jager et al. [29] showed that 12 subunits of eIF3s can bind to HIV protease and that eIF3d can block HIV replication in 293 cell types. How-ever, to our knowledge, the expression levels of eIF3s in HIV-infected patients and roles in disease progression have not yet been reported. Because eIF3s can affect both cell function and HIV replication, we postulate that eIF3s may also be involved in disease progression in EHI.
In this study, we aimed to explore the endogenous expression of 13 subunits of eIF3s in treatment-naive patients with EHI. We found a notable reduction in eIF3d in PBMCs from RPs compared with CPs, and expression of eIF3d was significantly correlated with disease progression. We then detected eIF3d
expres-sion in CD8+ T cells because these cells play
impor-tant roles in disease progression and found reduced
expression in CD8+ T cells from HIV-infected patients
than in healthy controls (HCs). Further in vitro anal-yses revealed that eIF3d attenuates cell prolifera-tion and IFN-γ secreprolifera-tion and promotes apoptosis in
Phytohemagglutinin (PHA)-stimulated CD8+ T cells.
In addition, decreased level of eIF3d attenuates CD8+
T cell function by elevating SOCS-7 expression.
Methods Study population
To examine the 13 subunits of eIF3s in early HIV infec-tion (EHI) patients, 15 treatment-naive EHI patients (8 RPs and 7 CPs) and 11 HCs were enrolled. EHI patients, defined as within the first 6 months of infection, were recruited from a large-scale prospective cohort of HIV-negative men who had sex with men, which was estab-lished in our institute from 2008 to 2010. Patients in the EHI group were divided into two groups according
to CD4+ T cell count during follow-up: RPs (CD4+ T
cell counts < 350 cells/μl within 1 year of infection) and CPs (CD4+ T cell counts remained > 500 cells/μl after 1 year of infection). At each visit, blood samples, includ-ing PBMCs, were cryopreserved. We detected eIF3 expression in PBMCs from EHI patients at approxi-mately 100 days post-infection (RPs: 99.63 ± 28.04 days;
CPs: 94.71 ± 14.23 days). The 11 HCs were randomly
selected from among HIV antibody-negative healthy
men age matched with those infected with HIV. Table 1
summarizes the relevant characteristics of the 15 patients with EHI and the 11 HCs.
To confirm whether eIF3d expression in CD8+ T
cells was altered in HIV-infected patients, 18 treat-ment-naive patients with chronic HIV-infected patients and 17 matched HCs were enrolled (summarized in
Additional file 1: Table S1). Among the 18 patients,
15 received ART during follow-up. Their PBMC sam-ples were preserved in our laboratory from the stages of treatment-naive to 2 years after ART. The Research and Ethics Committee of The First Affiliated Hospital of China Medical University approved the protocol for this study, and each enrolled individual provided their written informed consent for participation in the study.
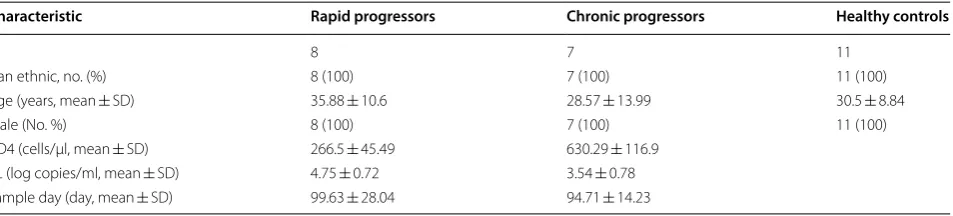
Table 1 Clinical characteristics of treatment-naive patients with EHI sample and HCs
VL viral load
Characteristic Rapid progressors Chronic progressors Healthy controls
N 8 7 11
Han ethnic, no. (%) 8 (100) 7 (100) 11 (100)
Age (years, mean ± SD) 35.88 ± 10.6 28.57 ± 13.99 30.5 ± 8.84
Male (No. %) 8 (100) 7 (100) 11 (100)
[image:2.595.63.540.608.716.2]Determination of eIF3 mRNA expression
Real-time polymerase chain reaction (PCR) was used to detect expression of eIF3s in cells. Total mRNA was iso-lated using the RNeasy Micro kit (Qiagen) and reverse
transcribed using the Primpscript®RT reagent kit
(TAKARA) according to the manufacturer’s instructions. Real-time PCR for the eIF3s mRNA was performed using
Roche LightCycler480 with SYBR® Premix Ex Taq™ II
(TAKARA). The levels of eIF3 mRNA expression were normalized to those of GAPDH. Relative mRNA expres-sion levels were calculated based on the change in the cycling threshold method as 2−ΔΔCt. The primers used in the experiment are provided in detail in Additional file 2: Table S2.
Isolation of primary cells and siRNA delivery
Whole blood samples were collected from each subject by venipuncture, and density gradient centrifugation was
used to extract PBMCs. CD4+ T cells (CD3+CD4+),
CD8+ T cells (CD3+CD8+), monocytes (CD3−
CD14+), natural killer (NK) cells (CD3−CD56+), and
B cells (CD3−CD19+) of HCs were sorted from PBMCs
using a BD FACS Aria flow cytometer. The following monoclonal antibodies (mAbs, Biolegend) were used: PerCP-conjugated anti-CD3, FITC-conjugated anti-CD4, PE-conjugated anti-CD8, PE-CY7-conjugated anti-CD14, PE-CY7-conjugated anti-CD56 and PerCP-conjugated
anti-CD19. STEMCELL was used to sort CD8+ T cells
from HIV-infected patients, and the sorting purity was detected by flow cytometry. CD8+ T cells were cultured in Roswell Park Memorial Institute (RPMI) 1640 supple-mented with 10% fetal bovine serum (FBS) (HyClone), 1% penicillin–streptomycin (Gibco) and IL-2 [30, 31] (30 U/ ml, Sigma). Transfection of siRNA and controls
(Invit-rogen) was performed with Lipofectamine™ RNAiMAX
Transfection Reagent (Invitrogen). Briefly, cells were transfected with 100 pmol of eIF3d siRNA or 75 pmol of eIF3d siRNA plus 75 pmol of SOCS-7 siRNA. Transfec-tion efficiency was measured by real-time PCR after 48 h of transfection.
Western blotting
Western blotting to detect the eIF3d protein was per-formed using standard methods. Total protein was extracted from transfected cells with RIPA buffer, and the protein concentration was measured using a BCA Pro-tein assay kit (Thermo Fisher Scientific, Inc.). The proPro-tein samples (30 µg) were subjected to SDS-PAGE (Bio-Rad, USA), transferred onto PVDF membranes and incu-bated overnight with primary antibodies at 4 °C. On the 2nd day, the membranes were incubated with secondary antibody at room temperature for 2 h. Immunoreactive
bands were detected with an ECL western blotting sys-tem (Clarity Western ECL Substrate; Bio-Rad). The antibodies used in this study were as follows: rabbit GAPDH (ab119716, Abcam), rabbit eIF3d anti-body (ab155419, Abcam), and goat anti rabbit IgG H&L (ab6721, Abcam).
Detection of CD8+ T cell function
To detect cell proliferation, sorted CD8+ T cells were
labelled with CellTrace™ Violet reagent (5 mM; Life
Technologies) in PBS and incubated for 15 min at 37 °C
after treatment with siRNA for 6 h. Labelled CD8+ T
cells were stimulated for 4 days with Phytohemagglutinin (PHA, 5 μg/ml, Sigma) [30]. Proliferation was measured at day 4 using a BD LSRII flow cytometer
(Becton–Dick-inson). To detect apoptosis, sorted CD8+ T cells from
HCs were stimulated for 48 h with PHA after treatment with siRNA for 6 h. The cells were then stained with PE-conjugated-Annexin V and 7-aminoactinomycin D (7-AAD, Biolegend) for 30 min at 4 °C and analysed using an LSRII flow cytometer. An intracellular IFN-γ stimulation assay, was carried out in which freshly iso-lated CD8+ T cells were transfected with siRNA for 48 h and then stimulated for 6 h with 2 µl/ml Cell Activation Cocktail (each vial of this cocktail contained phorbol-12-myristate 13-acetate 40.5 µM, ionomycin 669.3 µM, and Brefeldin A 2.5 mg/ml in dimethylsulfoxide (DMSO) Biolegend). Finally, the cells were intracellularly stained with APC-conjugated anti-IFN-γ (Biolegend) and ana-lysed using an LSRII flow cytometer.
RNA sequencing and bioinformatics analysis
Production of pNL4‑3‑derived vesicular stomatitis virus glycoprotein (VSV‑G) pseudotyped virus and infection To generate the pNL4-3-VSV-G virus, 16 µg pNL4-3 with green fluorescent protein (GFP) and 4 µg of VSV-G plas-mid were transiently transfected into 293T cells using Lipofectamine 2000 (Invitrogen). The culture superna-tant was collected at 48 h and filtered, and P24 was quan-tified using an ELISA kit (Quantobio). Concentrations of P24 were calculated using a standard curve. STEMCELL
was employed to sort CD4+ T cells from HCs. PBMCs
and CD4+ T cells were stimulated with PHA at a
con-centration of 5 μg/ml for 1 day prior to infection. One million cells were infected using the pNL4-3-VSV-G virus supernatant with 5 ng of P24gag antigen plus 1 µl of polybrene.
Data analysis
SPSS 17.0 and GraphPad Prism were utilized to conduct statistical analyses. Independent-sample t-tests were used to compare eIF3s expression among patients. Corre-lations between eIF3s, CD4+ T cells, and viral loads were evaluated using Spearman correlation analysis. Kaplan– Meier survival analysis was applied to evaluate the effect
of eIF3d expression on the reduction in CD4+ T cell
counts. One-way analysis of variance (ANOVA) was employed to investigate eIF3d across the five cell types from HC PBMCs. The paired t-test was used to compare eIF3d expression and apoptosis, proliferation and IFN-γ secretion after siRNA inhibition. P values < 0.05 were considered statistically significant.
Results
Reduced levels of eIF3d in HIV‑infected patients are linked to disease progression
It has been reported that eIF3s can act as a predictor of disease prognosis in some tumours [28, 32]. However, the relationship between eIF3 subunits and HIV dis-ease progression has not been reported. We first inves-tigated the levels of 13 eIF3 subunits in PBMCs from the EHI patients enrolled in our study (Additional file 3: Table S3). We found that patients with EHI had reduced levels of eIF3d and eIF3k (P = 0.001, P = 0.001) and increased levels of eIF3b, eIF3c, eIF3l and eIF3m com-pared to HCs (P < 0.001, P < 0.001, P = 0.004, P = 0.009, Additional file 4: Figure S1). We subsequently compared the expression levels of eIF3b, eIF3c, eIF3d, eIF3k, eIF3l and eIF3m between RPs and CPs and found that among the six eIF3 subunits, only the expression of eIF3d was significantly altered between RPs and CPs, with the for-mer having a lower level (P = 0.002, Fig. 1a). In addition, eIF3d was positively correlated with CD4+ T cell counts (r = 0.804, P < 0.001, Fig. 1b) and negatively correlated with viral load (r = 0.835, P < 0.001, Fig. 1c). These data
showed lower levels of eIF3d expression to be related to HIV rapid progression. To confirm this, we performed survival analysis in which EHI patients in the prospec-tive cohort were divided into high and low expressers (above and below the median value, respectively)
accord-ing to the median value of eIF3d expression; CD4+ T
cell counts reaching 350 cells/μl were considered as the end point for follow-up. Kaplan–Meier survival
analy-sis showed that the mean time for CD4+ T cell counts
to reach 350 cells/μl in low expressers was significantly shorter than that in high expressers (P < 0.001, Fig. 1d). To the best of our knowledge, our study is the first to sug-gest that eIF3d is significantly correlated with the rapid progression of HIV infection.
Decreased eIF3d expression attenuates CD8+ T cell proliferation and IFN‑γ secretion and promotes apoptosis Although eIF3s have been reported to directly influence the proliferation and invasion of tumour cells [24, 33], no relevant research on human T cells can be found in the literature. We suspected that eIF3d may exert effects
on CD8+ T cell function in HIV infection. Because
PBMCs were used for detecting the 13 eIF3 subunits in patients with EHI, we hoped to identify which primary cell subtype among PBMCs contributes to the observed alterations in eIF3d. Expression of eIF3d in different cell subsets (CD4+ T cells, CD8+ T cells, NK cells, B cells, and monocytes) of PBMCs from five healthy controls
was sorted by flow cytometry, and we found that CD8+
T cells displayed the highest level of eIF3d expression (P = 0.026, Fig. 2a). CD8+ T cells are among the most important effector cells in HIV infection, and their func-tion has been shown to be related to faster disease pro-gression [34]. This suggested that the reduction in eIF3d may affect the function of CD8+ T cells. We then
exam-ined the expression levels of eIF3d in sorted CD8+ T
cells from 18 treatment-naïve patients with chronic
HIV-infected patients and 17 HCs. The CD8+ T cell sorting
purity was 99.3% (Fig. 2b). Expression of eIF3d mRNA
was significantly lower in treatment-naïve patients (0.31 ± 0.13) than in HCs (0.95 ± 0.58, P = 0.008, Fig. 2c). Among the 18 patients referred to in Fig. 2c, 15 received
ART during follow-up. CD8+ T cells were sorted from
PBMCs, and eIF3d was detected. According to the results, eIF3d mRNA levels in CD8+ T cells (0.65 ± 0.38) were increased after ART (P = 0.013, Fig. 2c) compared with the levels in treatment-naïve patients. We also com-pared eIF3d expression in the same patients before and 2 years after ART and observed that levels recovered significantly after treatment (P = 0.018, Fig. 2d). In addi-tion, there was a significant positive correlation between
eIF3d expression in CD8+ T cells from treatment-naïve
Fig. 2e). This result indicates that eIF3d may affect HIV
disease progression by impacting the function of CD8+
T cells. Therefore, we examined the effects of eIF3d on CD8+ T cell proliferation, apoptosis, and IFN-γ secre-tion. EIF3d siRNA or control siRNA was transfected into CD8+ T cells, which led to a 60% reduction at 48 h after transfection, as determined by RT-PCR (P = 0.012,
Fig. 2f). Compared with controls, eIF3d siRNA-treated
CD8+ T cells showed a significantly lower level of pro-liferation (P = 0.046, Fig. 2g, h) and IFN-γ secretion (P = 0.026, Fig. 2k, l) after PHA stimulation. However,
the level of apoptosis in CD8+ T cells was significantly increased (P = 0.031, Fig. 2i, j) after eIF3d inhibition. According to our results, eIF3d knockdown directly attenuates CD8+ T cell proliferation and IFN-γ secretion and promotes apoptosis.
Inhibition of eIF3d increases expression of SOCS‑7
Previous studies have reported that eIF3d regulates tumour cell function via different signalling pathways [33, 35, 36]. However, the mechanism by which eIF3d
Fig. 1 The expression levels of eIF3d in PBMCs of EHI patients were reduced and negatively correlated with disease progression. a The expression levels of eIF3d mRNA in PBMCs of EHI patients and healthy controls (P = 0.001). b EIF3d was positively correlated with CD4+ T cell counts (P = 0.0003). c EIF3d was negatively correlated with viral loads (P = 0.0001). d Based on the median of eIF3d, EHI patients were divided into high‑ and low‑expression groups. CD4+ T cell counts < 350 cells/μl were considered as the end point of follow‑up in Kaplan–Meier survival analysis. The mean time for CD4+ T cell counts to reach 350 cells/μl in low expressers was significantly shorter than that in high expressers (P = 0.0003, Fig. 1d)
[image:5.595.57.539.87.398.2]regulates T cells remains unclear. To identify which
mRNA in CD8+ T cells eIF3d may be responsible for
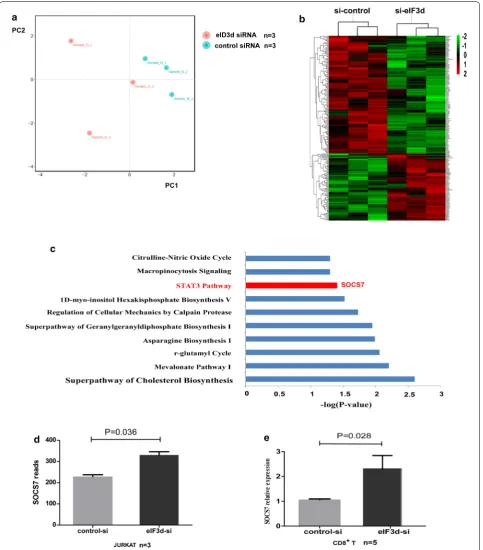
regulating, we knocked down eIF3d in Jurkat cells and performed comprehensive transcriptome analysis. We obtained 19,975 genes using gene and sample require-ment filtering. According to principal component analy-sis (PCA), the expression profile of individual samples in the eIF3d siRNA group was separate from that of the
control siRNA group (Fig. 3a). In all, 211 transcripts
were significantly differentially expressed between eIF3d siRNA-treated Jurkat cells and controls, including 76 upregulated and 135 downregulated transcripts (P < 0.05, absolute fold change > 1.2). These genes were sorted by FPKM differences in expression, and hierarchical cluster analysis was employed to illustrate the patterns of these differentially expressed genes (Fig. 3b).
We identified the top ten scoring pathways using ingenuity pathway analysis (IPA) enrichment analysis (Fig. 3c). Of these, the Janus kinase-signal transducer and activator of transcription (JAK-STAT) pathway was shown to be involved in the regulation of cell function. We further characterized SOCS-7, which is known to negatively regulate JAK-STAT signalling, and found that it was upregulated in eIF3d siRNA-treated Jurkat cells (P = 0.036, Fig. 3d). Next, we validated these findings in
primary CD8+ T cells. After knocking down the eIF3d
gene with siRNA in CD8+ T cells from three HCs, we
found that the expression level of SOCS-7 was signifi-cantly increased, with a fold change of 2.27 (P = 0.028, Fig. 3e), suggesting that eIF3d can negatively regulate expression of SOCS-7.
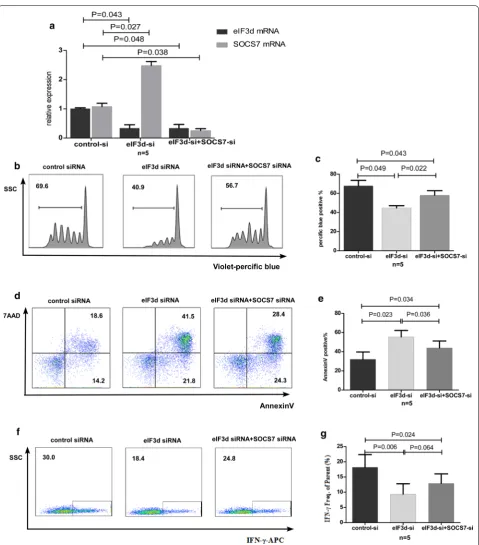
Simultaneous treatment of CD8+ T cells with eIF3d siRNA and SOCS‑7 siRNA restores cell function
Transcriptomic analysis suggested that reduced expres-sion of eIF3d may directly result in increased expresexpres-sion of SOCS-7. Nonetheless, it remains unknown whether
eIF3d can weaken the function of CD8+ T cells by
up-regulating SOCS-7. Therefore, we evaluated the
func-tion of human primary CD8+ T cells by simultaneously
knocking down eIF3d and SOCS-7 by transiently trans-fecting eIF3d siRNA alone or plus SOCS-7 siRNA into
CD8+ T cells using Lipofectamine, followed by
cultur-ing to monitor proliferation, IFN-γ secretion, and apop-tosis. In the co-knockdown group, the eIF3d inhibition
rate was 67% (P = 0.048), and the SOCS-7 inhibition
rate was 76% (P = 0.038) (Fig. 4a). Western blotting
veri-fied a knockdown efficiency of eIF3d protein in CD8+
T cells of 57% (Additional file 5: Figure S2). Compared with the single-knockdown eIF3d group, cell prolif-eration was significantly restored in the co-knockdown group (P = 0.022, Fig. 4c, d), and the rate of apoptosis was reduced (P = 0.036, Fig. 4e, f). Additionally, secretion of
IFN-γ was slightly restored (P = 0.064, Fig. 4g, h). How-ever, proliferation and IFN-γ secretion in the co-knock-down group were still lower than those in the HC group (P = 0.043, P = 0.024), and the rate of apoptosis was still
higher (P = 0.034). These results suggest that
mecha-nisms involving molecules other than SOCS-7 are likely to exist in the eIF3d-induced regulation of CD8+ T cells.
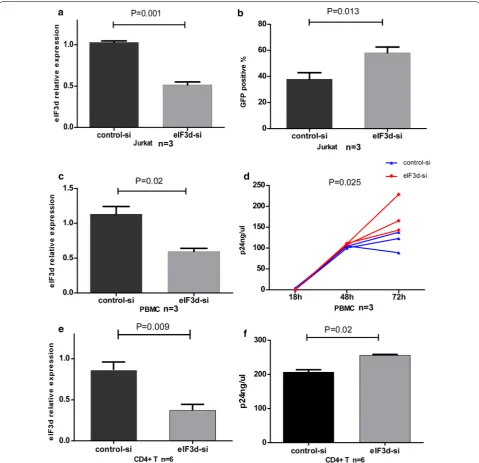
EIF3d siRNA transfection results in an increase in NL4‑3 replication
In addition to its clear association with CD8+ T cells, we postulated that eIF3d may affect HIV disease progression by regulating viral replication. Although previous studies have shown an increase in HIV-1 reverse transcripts in HEK 293 cells in which eIF3d was knocked down [29], it has not been addressed whether eIF3d affects HIV rep-lication in primary T cells. We transfected eIF3d siRNA
and control siRNA into Jurkat cells, PBMCs and CD4+
T cells, with knockdown efficiencies of 51% in Jurkat cells (P = 0.001, Fig. 5a), 45% in PBMCs (P = 0.02, Fig. 5c) and 56% in CD4+ T cells (P = 0.009, Fig. 5e) compared to the control group. Western blotting showed a knockdown
efficiency for the eIF3d protein in Jurkat and CD4+ T
cells of 42% and 48%, respectively (Additional file 5: Fig-ure S2). Next, using a fusion of HIV (pNL4-3-VSV-G), we explored the proportion (%) of Jurkat cells express-ing GFP and assessed P24 in the culture supernatant of
PBMCs and CD4+ T cells. The levels of GFP in eIF3d
siRNA-treated Jurkat cells were significantly higher than the levels in controls after 48 h (P = 0.013, Fig. 5b). In addition, levels of P24 in eIF3d siRNA-treated PBMC and CD4+ T cell culture supernatants were significantly higher than those in controls after 72 h (P = 0.025, Fig. 5d; P = 0.02, Fig. 5f). The findings suggest that reduced levels of eIF3d promote HIV virus replication.
Discussion
Immune responses are a dominant feature of durable immune control and contribute to the diverse progno-ses of HIV infection [37, 38]. Understanding the intrinsic factors that affect the immune system is important not only for future intervention treatment but also for devel-oping prognostic markers [39, 40]. Recent studies have shown that eIFs can directly regulate the translation of
mRNA and thus affect cellular function [22]. However,
Fig. 3 Differentially expressed transcripts after eIF3d siRNA‑treated compared with control siRNA‑treated Jurkat cells and pathway enrichment analysis results. a PCA was used to compare the gene expression signatures of the eIF3d siRNA group and the control siRNA group. b Hierarchical cluster analysis of differentially expressed mRNAs in the eIF3d siRNA group compared with that in the control siRNA group, with P < 0.05 and an absolute fold change of at least 1.2. Each row represents an individual transcript, and each column represents an individual. c The top 10 enriched pathways of genes that were significantly altered in the eIF3d siRNA group compared with the control siRNA group with an absolute fold change of at least 1.2 and P < 0.05. Pathway enrichment analysis was performed using the IPA database, and pathways were arranged according to P values. d
[image:8.595.58.542.87.638.2]We first systematically analysed the expression levels of 13 eIF3 subunit mRNAs in EHI and HCs and found that expression of eIF3d mRNA was lowest in the RP group and significantly negatively correlated with disease pro-gression. Previous reports have indicated that eIF3d can serve as a marker for tumour metastasis and prognosis [24, 41, 42]. Our study suggests that in EHI, a low level of
eIF3d in the host is correlated with rapid disease progres-sion. The underlying mechanisms of eIF3d might affect the host’s immune function and/or HIV replication. That was interesting because eIF3d was expressed at higher levels in CD8+ T cells and it is known that these cells play a key role in anti-viral responses in HIV infection. Moreover, the levels of eIF3d in CD8+ T cells from treatment-naive HIV
[image:10.595.58.538.87.550.2]patients were significantly lower than in HCs, and eIF3d levels in CD8+ T cells recovered significantly after 2 years of ART. We then sought to determine whether eIF3d affects the function of CD8+ T cells. Previous studies on eIF3d in tumours have shown that over expression leads to the abnormal proliferation of tumour cells [35, 41, 43]. Our study demonstrated that a reduction in eIF3d expression in human CD8+ T cells attenuated cell proliferation and secretion of IFN-γ and promoted apoptosis, which was consistent with the finding of the function of this protein in tumour cells. The increase in apoptosis was accompa-nied by a reduction in proliferation, indicating that the stable self-renewal of CD8+ T cells, which can exert an antiviral effect, was destroyed; thus, the function of these cells was greatly reduced [44, 45]. We postulated that the low expression of eIF3d in RPs can lead to disease pro-gression by impairing the function of CD8+ T cells. Pres-ently, eIF3d is being used for gene therapy in tumours [36], and increasing eIF3d expression in HIV-infected patients, thereby delaying disease progression, may provide innova-tive ideas for immune intervention.
Next, we further explored the mechanism by which
eIF3d regulates CD8+ T cells. Previous studies have
shown that in gallbladder cancer cells, eIF3d leads to tumour progression via stable expression of G-protein coupled receptor kinase 2 (GRK2) and activation of the phosphatidylinositol 3-kinase (PI3K)-AKT signalling
pathway [35]. Silencing eIF3d in renal cell carcinoma
is known to down-regulate the cell cycle B1/cyclin-dependent kinase-1 (CDK1) signalling pathway [36], and knocking down eIF3d in breast cancer cells inhibits the
Wnt/β-catenin signalling pathway [33]. Regardless, the
mechanism by which eIF3d regulates the functions of
CD8+ T cells remains unclear. In this study, we found
that knocking down eIF3d in both Jurkat cells and
pri-mary CD8+ T cells increased expression of SOCS-7,
which is also involved in the JAK-STAT pathway [46–48]. SOCS can directly act on the JAK protein, inhibit its phosphorylation, and then suppress activation of JAK-STAT signalling, resulting in decreased cell proliferation
and increased apoptosis [49–52]. Current research is
increasingly focusing on SOCS1-3 molecules [49, 53–56], and our study showed that SOCS-7 has effects similar to those of SOCS1-3. When we simultaneously inhibited eIF3d and SOCS-7, we found that although the reduced
proliferation of CD8+ T cells induced by eIF3d, the
secretion of IFN-γ and the increased levels of apoptosis were all restored, the levels were still significantly lower than those in HCs. This indicates that SOCS-7 is an important target gene for eIF3d in CD8+ T cells. Because the decline in eIF3d acts on multiple target genes, mech-anisms involving genes other than SOCS-7 may also par-ticipate in eIF3d-mediated regulation of CD8+ T cells.
The regulation of eIF3d and corresponding signalling pathway molecules is therefore of great significance for the recovery of CD8+ T cells in HIV-infected patients.
According to previous reports, eIF3d can inhibit HIV in HEK 293 cells [29], and we confirmed that Jurkat cells in which eIF3d had been knocked down are more conveni-ent for HIV replication. In addition, inhibition of eIF3d may enhance HIV replication in primary human PBMCs
and CD4+ T cells. Below, we discuss some implications
of our results. Our research and that of others have shown that low levels of eIF3d contribute to HIV infection. We also found that patients with low level of eIF3d may lead to the accelerated HIV disease progression. We are there-fore inclined to believe that low levels of eIF3d lead to the increased replication of HIV and accelerated disease pro-gression. In addition, a previous study showed that HIV infection will lead to a reduction of eIF3d in 293 cells [29]. We postulated that low levels of eIF3d leads to an increase in HIV replication which may further promote the reduc-tion in eIF3d. Besides, we found that eIF3d expression is different in healthy people. We supposed that the low expression level or genetic defect of eIF3d may play a role in determining whether people can be infected by HIV. But we cannot make a conclusion based on our present data. The current data highlight the importance of eIF3d in HIV infection by inhibiting CD8+ T cell function and by pro-moting viral production.
Conclusions
In summary, by systematically evaluating the expression of eIF3s mRNA in PBMCs from HIV-infected patients, we successfully identified that levels of the host factor eIF3d can influence disease progression. Our results indi-cate that eIF3d is correlated with disease progression and that abnormally low levels of eIF3d negatively regulate the antiviral ability of CD8+ T cells by increasing expres-sion of SOCS-7. Our study provides potential targets for improved immune intervention.
Additional files
Additional file 1: Table S1. Clinical characteristics of treatment‑naive chronic HIV‑infected patients and HCs.
Additional file 2: Table S2. The 13 eIF3 subunits and reference gene primer sequences.
Additional file 3: Table S3. Expression levels of the 13 eIF3 subunits mRNAs in PBMCs from EHI and HCs.
Additional file 4: Figure S1. Expression levels of other eIF3s in PBMCs from EHI and HCs.
Abbreviations
HIV‑1: human immunodeficiency virus 1; EHI: early HIV infection; eIF3s: eukaryotic initiation factor 3s; mRNA: message RNA; PBMC: peripheral blood mononuclear cell; RPs: rapid progressors; CPs: chronic progressors; HC: healthy control; RNA‑Seq: RNA sequencing; RT‑PCR: real‑time PCR; NGS: next‑genera‑ tion sequencing; QC: quality control; FPKM: fragments per kb per million reads; SOCS‑7: suppressor of cytokine signaling‑7; GFP: green fluorescent protein; VSV‑G: vesicular stomatitis virus glycoprotein; IPA: ingenuity pathway analysis; JAK‑STAT : Janus kinase‑signal transducer and activator of transcription.
Acknowledgements
The authors express their gratitude to the patients who participated in this study. This report has been edited by native English‑speaking medical editors (http://autho rserv ices.sprin gerna ture.com/langu age‑editi ng/), who we thank profusely.
Authors’ contributions
HS, Z‑NZ, and YP conceived and designed the experiments. YP and L‑BY per‑ formed the experiments. YP analysed the data. L‑BY, Y‑JF, Y‑JJ, H‑BD, and J‑JX contributed reagents/materials/analysis tools. YP and Z‑NZ wrote the paper. All authors read and approved the final manuscript.
Funding
This study was supported by grants from the Mega‑Projects of National Science Research for the 12th Five‑Year Plan (2012ZX10001‑006) and 13th Five‑Year Plan (2017ZX110201101).
Availability of data and materials
The authors can confirm that all relevant data and materials are available on request from the authors.
Ethics approval and consent to participate
The study was reviewed and approved by the local ethics review commit‑ tee. All participants provided written informed consent prior to research participation.
Consent for publication Not applicable.
Competing interests
The authors declare that they have no competing interests.
Author details
1 NHC Key Laboratory of AIDS Immunology (China Medical University), Depart‑
ment of Laboratory Medicine, The First Affiliated Hospital of China Medical University, No 155, Nanjing North Street, He ping District, Shenyang, Liaoning 110001, China. 2 Key Laboratory of AIDS Immunology of Liaoning Province,
The First Affiliated Hospital of China Medical University, Shenyang 110001, China. 3 Key Laboratory of AIDS Immunology, Chinese Academy of Medi‑
cal Sciences, Shenyang 110001, China. 4 Collaborative Innovation Centre
for Diagnosis and Treatment of Infectious Diseases, 79 Qing Chun Street, Hangzhou 310003, China.
Received: 17 January 2019 Accepted: 15 May 2019
References
1. Sidorovitch IG, Ignatieva GA. Immunopathogenesis of HIV infection: a specific anti‑HIV tolerance as a mechanism of control of disease progres‑ sion. Allergy Proc. 1995;16(4):203–7.
2. Khanlou H, Salmon‑Ceron D, Sicard D. Characteristics of rapid progressors in HIV infection. Ann Med Interne. 1997;148(2):163–6.
3. Zwolinska K. Host genetic factors associated with susceptibility to HIV infection and progression of infection. Postepy Hig Med Dosw. 2009;63:73–91.
4. Carrington M, Walker BD. Immunogenetics of spontaneous control of HIV. Annu Rev Med. 2012;63:131–45.
5. Katoh J, Kawana‑Tachikawa A, Shimizu A, Zhu D, Han C, Nakamura H, et al. Rapid HIV‑1 disease progression in individuals infected with a virus adapted to its host population. PLoS ONE. 2016;11(3):e0150397. 6. Hayashida T, Tsuchiya K, Kikuchi Y, Oka S, Gatanaga H. Emergence of
CXCR6‑tropic HIV‑1 variants followed by rapid disease progression in hemophiliac slow progressors. PLoS ONE. 2017;12(5):e0177033. 7. Streeck H, Jolin JS, Qi Y, Yassine‑Diab B, Johnson RC, Kwon DS, et al.
Human immunodeficiency virus type 1‑specific CD8+ T‑cell responses during primary infection are major determinants of the viral set point and loss of CD4+ T cells. J Virol. 2009;83(15):7641–8.
8. Hunt PW, Carrington M. Host genetic determinants of HIV pathogenesis: an immunologic perspective. Curr Opin HIV AIDS. 2008;3(3):342–8. 9. Cohen MS, Shaw GM, McMichael AJ, Haynes BF. Acute HIV‑1 infection. N
Engl J Med. 2011;364(20):1943–54.
10. Streeck H, van Bockel D, Kelleher A. T‑cell responses in primary HIV‑1 infection. Curr Opin HIV AIDS. 2008;3(1):52–9.
11. Dalmau J, Rotger M, Erkizia I, Rauch A, Reche P, Pino M, et al. Highly pathogenic adapted HIV‑1 strains limit host immunity and dictate rapid disease progression. AIDS. 2014;28(9):1261–72.
12. Streeck H, Nixon DF. T cell immunity in acute HIV‑1 infection. J Infect Dis. 2010;202(Suppl 2):S302–8.
13. Cao J, McNevin J, Malhotra U, McElrath MJ. Evolution of CD8+ T cell immunity and viral escape following acute HIV‑1 infection. J Immunol. 2003;171(7):3837–46.
14. Munier CM, Kelleher AD, Kent SJ, De Rose R. The role of T cell immunity in HIV‑1 infection. Curr Opin Virol. 2013;3(4):438–46.
15. Gulzar N, Copeland KF. CD8+ T‑cells: function and response to HIV infec‑ tion. Curr HIV Res. 2004;2(1):23–37.
16. Negi N, Mojumdar K, Singh R, Sharma A, Das BK, Sreenivas V, et al. Comparative proliferation capacity of Gag‑C‑specific naive and memory CD4+ and CD8+ T lymphocytes in rapid, viremic slow, and slow progres‑ sors during human immunodeficiency virus infection. Viral Immunol. 2018;31(7):513–24.
17. Saeidi A, Buggert M, Che KF, Kong YY, Velu V, Larsson M, et al. Regula‑ tion of CD8+ T‑cell cytotoxicity in HIV‑1 infection. Cell Immunol. 2015;298(1–2):126–33.
18. Jansen CA, Piriou E, Bronke C, Vingerhoed J, Kostense S, van Baarle D, et al. Characterization of virus‑specific CD8(+) effector T cells in the course of HIV‑1 infection: longitudinal analyses in slow and rapid progressors. Clin Immunol. 2004;113(3):299–309.
19. McBrien JB, Kumar NA, Silvestri G. Mechanisms of CD8(+) T cell‑mediated suppression of HIV/SIV replication. Eur J Immunol. 2018;48(6):898–914. 20. Siridechadilok B, Fraser CS, Hall RJ, Doudna JA, Nogales E. Structural roles
for human translation factor eIF3 in initiation of protein synthesis. Sci‑ ence. 2005;310(5753):1513–5.
21. Hinnebusch AG. eIF3: a versatile scaffold for translation initiation com‑ plexes. Trends Biochem Sci. 2006;31(10):553–62.
22. Lee AS, Kranzusch PJ, Cate JH. eIF3 targets cell‑proliferation mes‑ senger RNAs for translational activation or repression. Nature. 2015;522(7554):111–4.
23. Zang Y, Zhang X, Yan L, Gu G, Li D, Zhang Y, et al. Eukaryotic Translation Initiation Factor 3b is both a promising prognostic biomarker and a potential therapeutic target for patients with clear cell renal cell carci‑ noma. J Cancer. 2017;8(15):3049–61.
24. Gao Y, Teng J, Hong Y, Qu F, Ren J, Li L, et al. The oncogenic role of EIF3D is associated with increased cell cycle progression and motility in prostate cancer. Med Oncol. 2015;32(7):518.
25. Dong Z, Zhang JT. Initiation factor eIF3 and regulation of mRNA transla‑ tion, cell growth, and cancer. Crit Rev Oncol Hematol. 2006;59(3):169–80. 26. Yin JY, Dong Z, Zhang JT. eIF3 regulation of protein synthesis, tumorigen‑
esis, and therapeutic response. Methods Mol Biol. 2017;1507:113–27. 27. Buttitta F, Martella C, Barassi F, Felicioni L, Salvatore S, Rosini S, et al. Int6
expression can predict survival in early‑stage non‑small cell lung cancer patients. Clin Cancer Res. 2005;11(9):3198–204.
•fast, convenient online submission •
thorough peer review by experienced researchers in your field • rapid publication on acceptance
• support for research data, including large and complex data types •
gold Open Access which fosters wider collaboration and increased citations maximum visibility for your research: over 100M website views per year •
At BMC, research is always in progress.
Learn more biomedcentral.com/submissions
Ready to submit your research? Choose BMC and benefit from:
29. Jager S, Cimermancic P, Gulbahce N, Johnson JR, McGovern KE, Clarke SC, et al. Global landscape of HIV‑human protein complexes. Nature. 2011;481(7381):365–70.
30. Brzezinska A, Magalska A, Szybinska A, Sikora E. Proliferation and apopto‑ sis of human CD8(+)CD28(+) and CD8(+)CD28(−) lymphocytes during aging. Exp Gerontol. 2004;39(4):539–44.
31. Carbone F, De Rosa V, Carrieri PB, Montella S, Bruzzese D, Porcellini A, et al. Regulatory T cell proliferative potential is impaired in human autoim‑ mune disease. Nat Med. 2014;20(1):69–74.
32. Hershey JWB. Regulation of protein synthesis and the role of eIF3 in cancer. Braz J Med Biol Res. 2010;43(10):920–30.
33. Fan Y, Guo Y. Knockdown of eIF3D inhibits breast cancer cell prolifera‑ tion and invasion through suppressing the Wnt/beta‑catenin signaling pathway. Int J Clin Exp Pathol. 2015;8(9):10420–7.
34. Buseyne F, Riviere Y. HIV‑specific CD8+ T‑cell immune responses and viral replication. AIDS. 1993;7(Suppl 2):S81–5.
35. Zhang F, Xiang S, Cao Y, Li M, Ma Q, Liang H, et al. EIF3D promotes gall‑ bladder cancer development by stabilizing GRK2 kinase and activating PI3K‑AKT signaling pathway. Cell Death Dis. 2017;8(6):e2868. 36. Pan XW, Chen L, Hong Y, Xu DF, Liu X, Li L, et al. EIF3D silencing sup‑
presses renal cell carcinoma tumorigenesis via inducing G2/M arrest through downregulation of Cyclin B1/CDK1 signaling. Int J Oncol. 2016;48(6):2580–90.
37. Paranjape RS. Immunopathogenesis of HIV infection. Indian J Med Res. 2005;121(4):240–55.
38. Chuenchitra T, Wasi C, Louisirirojchanakul S, Nitayaphan S, Sutthent R, Cox JH, et al. Longitudinal study of humoral immune responses in HIV type 1 subtype CRF01_AE (E)‑infected Thai patients with different rates of disease progression. AIDS Res Hum Retrovir. 2003;19(4):293–305. 39. Colomer‑Lluch M, Ruiz A, Moris A, Prado JG. Restriction factors: from
intrinsic viral restriction to shaping cellular immunity against HIV‑1. Front Immunol. 2018;9:2876.
40. Simon V, Bloch N, Landau NR. Intrinsic host restrictions to HIV‑1 and mechanisms of viral escape. Nat Immunol. 2015;16(6):546–53.
41. He J, Wang X, Cai J, Wang W, Qin X. High expression of eIF3d is associated with poor prognosis in patients with gastric cancer. Cancer Manag Res. 2017;9:539–44.
42. Lin Z, Xiong L, Lin Q. Knockdown of eIF3d inhibits cell proliferation through G2/M phase arrest in non‑small cell lung cancer. Med Oncol. 2015;32(7):183.
43. Latosinska A, Mokou M, Makridakis M, Mullen W, Zoidakis J, Lygirou V, et al. Proteomics analysis of bladder cancer invasion: targeting EIF3D for therapeutic intervention. Oncotarget. 2017;8(41):69435–55.
44. Riou C, Burgers WA, Mlisana K, Koup RA, Roederer M, Abdool Karim SS, et al. Differential impact of magnitude, polyfunctional capacity, and specificity of HIV‑specific CD8+ T cell responses on HIV set point. J Virol. 2014;88(3):1819–24.
45. Graw F, Regoes RR. Predicting the impact of CD8+ T cell polyfunctionality on HIV disease progression. J Virol. 2014;88(17):10134–45.
46. Liongue C, Ward AC. Evolution of the JAK‑STAT pathway. Jakstat. 2013;2(1):e22756.
47. Cai B, Cai JP, Luo YL, Chen C, Zhang S. The specific roles of JAK/STAT signaling pathway in sepsis. Inflammation. 2015;38(4):1599–608. 48. Linossi EM, Babon JJ, Hilton DJ, Nicholson SE. Suppression of cytokine
signaling: the SOCS perspective. Cytokine Growth Factor Rev. 2013;24(3):241–8.
49. Yoshikawa H, Matsubara K, Qian GS, Jackson P, Groopman JD, Manning JE, et al. SOCS‑1, a negative regulator of the JAK/STAT pathway, is silenced by methylation in human hepatocellular carcinoma and shows growth‑ suppression activity. Nat Genet. 2001;28(1):29–35.
50. Cooney RN. Suppressors of cytokine signaling (SOCS): inhibitors of the JAK/STAT pathway. Shock. 2002;17(2):83–90.
51. Yoshimura A, Naka T, Kubo M. SOCS proteins, cytokine signalling and immune regulation. Nat Rev Immunol. 2007;7(6):454–65.
52. Kazi JU, Kabir NN, Flores‑Morales A, Ronnstrand L. SOCS proteins in regulation of receptor tyrosine kinase signaling. Cell Mol Life Sci. 2014;71(17):3297–310.
53. Tamiya T, Kashiwagi I, Takahashi R, Yasukawa H, Yoshimura A. Suppressors of cytokine signaling (SOCS) proteins and JAK/STAT pathways: regulation of T‑cell inflammation by SOCS1 and SOCS3. Arterioscler Thromb Vasc Biol. 2011;31(5):980–5.
54. Neuwirt H, Eder IE, Puhr M, Rudnicki M. SOCS‑3 is downregulated in progressive CKD patients and regulates proliferation in human renal proximal tubule cells in a STAT1/3 independent manner. Lab Invest. 2013;93(1):123–34.
55. Shi J, Wei L. Regulation of JAK/STAT signalling by SOCS in the myocar‑ dium. Cardiovasc Res. 2012;96(3):345–7.
56. O’Sullivan LA, Liongue C, Lewis RS, Stephenson SE, Ward AC. Cytokine receptor signaling through the Jak–Stat–Socs pathway in disease. Mol Immunol. 2007;44(10):2497–506.
Publisher’s Note