RIT Scholar Works
Theses Thesis/Dissertation Collections
2007
Using eye tracking to understand banner blindness
and improve website design
Chad Lapa
Follow this and additional works at:http://scholarworks.rit.edu/theses
This Thesis is brought to you for free and open access by the Thesis/Dissertation Collections at RIT Scholar Works. It has been accepted for inclusion in Theses by an authorized administrator of RIT Scholar Works. For more information, please [email protected].
Recommended Citation
Using Eye Tracking to Understand Banner Blindness
and Improve Website Design
By
Chad Lapa
Thesis Committee: Evelyn Rozanski, Keith Karn, Anne Haake
Thesis submitted in partial fulfillment of the requirements for the
degree of Master of Science in Information Technology
Rochester Institute of Technology
B. Thomas Golisano College
of
Computing and Information Sciences
Using Eye Tracking to Understand Banner Blindness
and Improve Website Design
Chad J. Lapa
Golisano College of Computing and Information Sciences Rochester Institute of Technology
Table of Contents
ABSTRACT ...3
INTRODUCTION ...4
METHODS...10
ANALYSIS...18
RESULTS...22
RECOMMENDATIONS FOR FURTHER STUDY ...36
ACKNOWLEDGEMENTS ...38
REFERENCES ...39
APPENDIX I: SCREENING QUESTIONNAIRE ...41
APPENDIX II: IRB FORM A ...46
APPENDIX III: IRB FORM C ...53
APPENDIX IV: ROCHESTER INSTITUTE OF TECHNOLOGY CAMPUS / DIRECTIONS...54
APPENDIX V: DETAILED OUTLINE OF FOUR TASKS...55
APPENDIX VI: TASK RELEVANT QUESTIONS...57
APPENDIX VII: FREE VIEWING RELEVANT QUESTIONS ...58
APPENDIX VIII: INFORMED CONSENT ...59
APPENDIX IX: INTRODUCTION PROCEDURE...61
APPENDIX X: CALIBRATION PROCESS DETAILS ...63
APPENDIX XI: EYE TRACKING RECORDING SHEET...71
APPENDIX XII: BANNER SCREEN SHOTS ...90
APPENDIX XIII: EYE TRACKING RECORDING DATA SUMMARY...92
Abstract
Banners, as a form of advertising on the web, are important for businesses. Conversely
customers want to navigate the site without being distracted by irrelevant or annoying ads.
Design and placement of banners is not well understood and "banner blindness", which occurs
when users overlook the banner entirely, is what causes the ineffectiveness of the banner. This
study employs eye tracking to investigate how banner background color and the banner’s
relevance to users’ tasks influence banner blindness. Eye movements were collected for users
performing several tasks and viewing banners in a task-free context. Different banners were
counterbalanced with task order. Findings on viewing behavior and user preference based on
both questionnaires and eye tracking analysis offered evidence that banner background color and
relevance did not influence banner viewing behavior. Through the use of eye tracking, we
attempt to identify the effectiveness of banners on a website and offer recommendations for
Introduction
Businesses commonly monitor the frequency with which users click on banners as a
measure of their effectiveness in capturing the user’s attention. Recently a major corporation
observed that banner click-through rates dropped when homepage banners with a uniform, white
background were replaced with banners with a more varied color background (see Figures 17
and 18). This study investigated whether this decreased user interaction was due to banner
blindness (when users overlook banners) and investigated several factors that may influence
banner viewing behavior. Banner variables included background color and relevance to the
user’s task. We gathered eye movement data for users performing four tasks and also in a free
viewing (task-free) context.
What is ‘Banner Blindness’?
Benway and Lane (1998, Benway, 1998) introduced the concept of banner blindness and
coined the term. Wikipedia (2005) defines banner blindness as
“A usability phenomenon in which a website visitor completely overlooks a banner.
Such a banner may either be an advertising banner from an external site, or a banner that
the serving site intends to use to promote content or a navigation link.”
Banners, as a common form of advertising, were introduced in 1994 as a way to attract users’
attention and to trigger a desired reaction. The desired reaction was largely getting users to click
on the banner to visit the advertised site. This is commonly known as the banner’s
“click-through rate” and is determined by dividing the number of page views by the number of banner
clicks. A study done in 1996 by a digital advertising company, DoubleClick, found that many
banner ads were not catching users’ attention at all but rather were reinforcing the idea that
banner ads contained information that was predominantly irrelevant to the task at hand. This
reinforced condition thus led users to avoid these ad spaces. DoubleClick’s study showed that the
probability of a user clicking on a web banner ad declined significantly after repeat exposures.
Subsequent studies have reported conflicting results (Bayles, 2000; Albert, 2002). Bayle’s study
concluded that animation to enhance banner awareness was not effective while Albert’s study
told of several banner variables that could be adjusted to help increase banner awareness. Other
click-through rates year over year for a website. Williamson (1996) reported a national average
for click-through rates of 2.1%. Click through rates subsequently declined for five consecutive
years starting in 1995. The click through rate fell from 2.0% in 1995 to 0.2% in 2000
(Williamson, 1996). Starkov (2003) reports that click-through rates have dropped from 2% in
1997 and 3% in 1998 to less than 0.3% in 2002. This trend is also reflected in the percentage of
total dollars spent on online advertising as advertisers are seeking new ways to promote their
goods. The national average in 1996 showed that 56% of all Internet marketing budgets were
spent on banner ads. This number dropped to 48% in 2000, 36% in 2001 and approximately 32%
in 2002 (Amiri & Menon, 2003).
The upside to banner blindness is that it may allow the user to create an instant visual
apparition of the webpage, based on past experiences, and thus pushes users towards the useful
components of the page (Clark, 2002). This is assuming the banner itself is composed of
information that is irrelevant to what the user is actually trying to find within the site.
Importance
Webpage banners are an important form of advertising for businesses that want to
improve product or service sales through the website or convey some message to the user.
Customers want to navigate the site and find the pertinent information they are looking for
without being distracted by irrelevant or annoying ads. Contradictory results have been
documented regarding the effectiveness of banner advertisements on websites. A study done by
the Internet Advertising Bureau (1997) on over 16,000 users found that online advertising has
tremendous communication power. The study showed that eight of the twelve banners tested
produced a significant increase in brand awareness. The Internet Advertising Bureau states:
A single exposure [to banner ads] can generate increases in advertisement awareness, brand awareness, product attribute communication and purchase intent. Nearly all of the impact measured was generated without a ‘click-through’ to the advertiser’s site, proving the power of the ubiquitous banner. (pg. 7)
A banner’s content has significant implications for both businesses and visitors of the
site. Businesses want to improve their website’s usability to help increase visitor retention and
performance by reducing user frustrations and errors. If the website does not effectively address
Customers want a site that is easy to understand and provides a clear navigational layout that is
void of irrelevant information or distracting ads. The design and placement of banner ads within
websites needs to be better understood in order to maximize their effectiveness for both
businesses and visitors to the site.
Methodologies Used for the Study of Web Interfaces
Usability testing is used to help designers improve the usability of the artifacts that they
design (e.g., webpages, electronic interfaces, devices, software, and documents). Rather than
attempt to formulate universal principles, as in more scientific studies, usability testing focuses
more specifically on improving a single object or interface. Typical usability evaluation methods
include think-aloud protocols, task-based usability tests, questionnaires, and heuristic
evaluations. The test administrator needs to arrange a setting where users can interact with the
object or interface and provide feedback regarding specific variables that either help or hinder
use. A representative sample of the user population participates in order to give designers insight
into how people expect the interface to work.
The concurrent think-aloud protocol is a common usability technique to help the
administrator understand the thought processes of the users. Participants are asked to verbalize
what they are thinking as they navigate through the interface or interact with the object. This
technique is used because it can be difficult for the test administrator to make sense of why a
participant performed a certain action. One problem with having the users think aloud while
performing a task is that it can disrupt delicate, ongoing cognitive processes. This distraction of
having to think-aloud could skew results (Nielsen, 1994).
The way in which the usability test itself is conducted can affect participant behavior
(John & Marks, 1997). Participants who are given specific tasks to perform, that accurately
reflect a realistic situation, will behave differently from participants who are given atypical tasks
to perform that they would not otherwise perform outside the laboratory environment. The form
in which a participant seeks information (search paradigm - directed, undirected, active or
Trying to pinpoint the area of the interface with which a user had problems, can be the
most difficult part of a study. Accurately interpreting the user’s behavior is essential to the
reliability of the study but not always clear cut. Users actions can be driven by many different
variables (Pan et al ETRA, 2004). The administrator needs to be able to decipher whether or not
the user disregarded a portion of the interface because he or she did not see it or because they felt
the area contained information irrelevant to the task at hand. The same can be said if a user is
interacting with an object. For example a user may not press a button because he or she did not
see it, did not understand what it did, or did not realize that it was required to accomplish the
task.
To make the experiment as natural as possible, a usability test administrator is trained not
to distract the user or ask questions that could bias the user’s answer. This makes it very
difficult for the administrator to determine what the true reasoning behind a participant’s actions
might have been. To help gain better insight into the thought and decision-making process of the
participant, usability professionals are increasingly turning to eye tracking.
Modern eye tracking uses a combination of hardware and software to determine the
location of the user’s dwell on a given interface or scene. Eye tracking was originally introduced
over 100 years ago by Dodge and Cline (1901). They used an invasive procedure that involved
direct physical contact with the eye. This type of experiment, one could only imagine, would
disrupt the participant’s natural behavior. Eye tracking has since evolved technologically. New
equipment is helping to make it a more viable option. Eye tracking technologies continue to
become more portable, more accurate, less intrusive and less expensive and thus a more practical
supplement to traditional usability testing techniques (Jacob & Karn, 2003).
There are many benefits of including eye tracking in a usability study. The primary
advantage is that it can help the investigator uncover usability issues that conventional usability
tests would otherwise miss. Eye tracking produces a large amount of data, leaving the test
administrator with many options in terms of analysis. The experimenter can compute
information such as fixations (i.e., eye’s focus on a single point), scan paths (i.e., order in which
multiple fixations occur), and the number and duration of dwells (i.e., consecutive observations
Schroeder (1998) states that eye trackers can also help determine:
• if the user is looking at the screen
• if the user is reading or scanning the words on a page
• the relative intensity of a user’s attention to various parts of the interface • whether the user is searching for a specific item
• user scan patterns
Technological limitations, such as equipment size and invasiveness, are disadvantages of
eye tracking compared to traditional usability tests. Eye tracking systems require extensive
calibration procedures to ensure accuracy. Use of this apparatus can prove time-consuming.
Wearing a head-mounted system can make participants cautious of their actions, thus limiting
how naturally the participant behaves in the testing environment. Even after calibration is
complete, eye movement analysis cannot prove that a participant actually perceives something.
It merely indicates the participant’s point of regard. It also doesn’t prove that users did not
perceive something (i.e., through peripheral vision). Additional disadvantages of eye tracking
compared to traditional usability tests include the cost to purchase the software and equipment
needed, the additional time required to calibrate participants and some limitation of participants
that can be tested based on eye shape. Due to the increased time necessary for eye tracer
calibration and also for data analysis, the number of participants that can be eye tracked is
usually smaller than the number that could be tested if using conventional usability testing in the
same given time frame. Another disadvantage that is also listed as an advantage is the amount of
data that is produced by eye tracking. This gives the investigator plenty of options with respect
to what he or she choose to analyze but it also means a possible significant increase in the length
of time it takes to analyze the rich data produced by eye tracking (Jacob & Karn, 2003).
Study of Xerox Web Banner Design Using Eye Tracking in Usability Testing
A collaborative usability project between Rochester Institute of Technology (RIT) and
Xerox Corporation was conducted using eye tracking. The experiment in the Laboratory for
Computer-Human Interaction and Performance Support at Rochester Institute of Technology was
experienced a significant drop in the number of visitors clicking on their primary banner
advertisement when switching from a banner with a white background to a banner with a color
background. RIT conducted the usability test in a controlled environment using eye tracking to
test the variables that could have led to the significant decrease in visitor click through
performance.
Hypothesis
To test the banner’s effectiveness in capturing the user’s attention, controlled alterations
were made to the banner. The only variable manipulated was the design of the banner.. We
made the following hypotheses.
• Hypothesis 1: The background color of the banner would influence participants viewing
behavior. Banners with a color background would decrease the frequency or total
duration of dwells on a visual element.
• Hypothesis 2: The relevance of the banner content to the task at hand would influence
participants viewing behavior. Banners that contained information relevant to the task
would increase the frequency or total duration of dwells on the banner.
Eye movement data were collected from participants performing four realistic tasks and
in a free viewing context to help gain more insight into understanding user behavior while
navigating websites that contain banner ads. This study used traditional usability testing
Methods
Participants
A market research firm recruited 24 participants in the Rochester, NY area for the study.
The participants included ten males and fourteen females. One female participant was unable to
be eye tracked due to difficulties getting an accurate calibration, leaving thirteen female
participants and a total of 23 participants. All participants were recruited from surrounding
small, medium, and large Rochester area companies. We developed a screening telephone
questionnaire (see Appendix I) with the following criteria which most closely targets the
intended user population for the Xerox website:
• Researches, recommends, or purchases office equipment (e.g., laser printers, copiers, or
multi-function office products). At least one such purchase ≥$1,000 within the last 18
months.
• Uses equipment manufacturers’ websites as a primary source to gather information about
office products.
• Has no experience managing or designing websites.
• Is willing to wear eye tracking headgear and be videotaped for analysis. • Does not work for Xerox Corporation or any Xerox agent or dealer. • Is not of Asian or Pacific Island origin1.
• Is able to speak and read English.
If all of these criteria were met, then the participant was scheduled for an individual
session of 1.5 hours. The number of employees at the companies at which our participants
worked ranged from 7 to over 2500.
1
Individuals of Asian or Pacific Island origin generally cannot be eye tracked because the shape
Apparatus
The team conducted five pilot sessions and many issues were uncovered and addressed.
Issues addressed included better wording of the questions so that they would be presented in an
unbiased fashion. The setup of the lab and observatory were arranged to be more efficient and
less intrusive. In order to experiment with human subjects, RIT required the filing and approval
of both the Institutional Review Board (IRB) Form A (Appendix II) and IRB Form C (Appendix
III). The experimental design itself was also altered slightly to accommodate for time
restrictions.
The entire eye tracking study was conducted in the Laboratory for Computer-Human
Interaction and Performance Support located in the Center for Advancing the Study of Cyber
Infrastructure (CASCI) on the Rochester Institute of Technology campus (Appendix IV). The
laboratory contained the eye tracking equipment and an observation area for others to watch in
real time as participants were tested.
The laboratory environment included a 19” Dell Ultrasharp LCD monitor, the Applied
Science Laboratories (ASL) head mounted eye tracking system (Figure 1), ASL software, two
computers running Pentium 4 processors with 2 gigabytes of RAM and 250 Gigabyte hard
drives, an over-the-shoulder video camera mounted high behind participant to record body
[image:13.612.72.317.518.733.2]language, and a microphone and mixer to record audio.
The eye tracker was an ASL model 501 head-mounted system that came equipped with
ASL’s E5Win software with serial cable connection, model 5000 control unit, and the headband
with optics. Other lab equipment included additional monitors, a mini DV tape recording deck,
DVD-R’s, a 17” Apple Powerbook with DVD burner used for DVD creation and other
miscellaneous tasks and a 42” Gateway plasma monitor used in the observatory.
After participants had completed testing, the encoding of the mini Digital Video (DV)
tape was done in the Visual Perception lab located in the Carlson Center for Imaging Science at
RIT. The mini DV tape was played back using a JVC BR-DV600UA mini DV editing video
tape recorder, RS-422 control, and controller (to control playback speed). The software used in
conjunction with the equipment that allowed us to define our areas of interest and manually
encode the tapes was written by Professor Jeff Pelz using the Matlab software package. All of
the encoding work was done via a serial connection to a Dell PC.
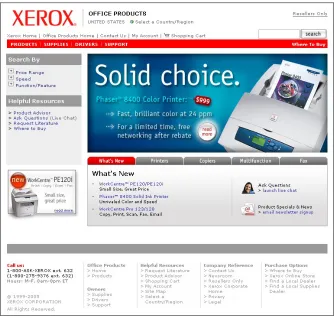
The website used in the study was a subset of the live site of Xerox Corporation that
focuses on office equipment (see Figure 2). The site provides sales-related information for new
products, customer support information for existing products, on-line ordering, and downloads of
product-related software. Participants interacted with the website via a web browser (Internet
Explorer 6.0) running on a PC with the Microsoft Windows XP Professional operating system, a
two button, optical scroll mouse and English keyboard, and a 19 inch, flat panel display1 with
1024x768 pixel resolution. In other respects, the lab simulated a typical office environment.
1
Figure 2: Home page of the tested site.
Design of Experiment
The tasks for our experiment were broken down into two main sections, a task-driven
section and a free-viewing section to better help us assess how participants view webpage banner
advertisements. The tasks, pertinent to the site and appropriate for the recruited participants.
Banner ads were carefully controlled on the live site throughout the course of the experiment.
The website used in the experiment was the office section of the Xerox Corporation website
(http://www.office.xerox.com), which provides sales-related and customer support information.
The sales-related information included products currently being offered along with a detailed
description and the supplies that accompanied those products. The customer support information
included an extensive help section that provided additional information about driver downloads,
Frequently Asked Questions (FAQ), and additional contact information such as phone numbers,
business addresses, email addresses, and a form submission option. Each session had a
prominent banner advertisement, for a Xerox product, with the intent to advertise new products
and services to site visitors. The banner advertisement occupied 25% of the total area on the
area served as a link to the detailed information page of the product that it was advertising.
The task-driven portion of our study, that always occurred first, involved participants
performing a series of tasks on the Xerox office website. Participants were not given a time limit
to complete each task. Participants were instructed to notify the test administrator when they had
finished the task or felt that they could not finish the task.
The four tasks (for details see Appendix V) included:
• Find a printer that meets a set of four criteria (i.e., prints in color at 20 pages per minute or faster, prints 2-sided, network ready, costs less than $1,500)
• Find and purchase a multifunction product meeting a set of four criteria (i.e., Copies,
prints, scans, and faxes, costs less than $1,000, prints on 8.5” x 14” paper, prints at least
20 pages per minute in black & white)
• Find a support solution (i.e., for color spots and marks on printed output) • Find and download a specific printer driver (i.e., for a Phaser 7750 color printer)
One of four banners appeared in each of the four tasks and no banner appeared more than
once for a participant. This was controlled by setting up banner viewing assignment prior to the
participant arriving to ensure each banner only appeared once across the four tasks. Each of the
four banners was displayed separately in one of four separate browser windows and then all were
minimized to hide them from view. When it was time for the task, the window containing the
appropriate banner was maximized for viewing. Each banner was unique, but all were
advertisements for Xerox office products. Background color, which was varied systematically
(white or color). The other controlled variable was banner relevance. Banner relevance was
defined by whether the content of the banner was relevant or irrelevant to the completion of that
task (i.e., an advertisement for, and link to, the product that met the criteria for a search task).
Since all four banner ads were intended as promotions for specific new products, none were ever
relevant to two of the tasks (finding a support solution and printer driver download). In order to
have two banners that were task-relevant and two that were not, the ads appearing during the two
Find Printer tasks were always relevant (i.e., provided information and a direct link to the
product for which the participant searched). As a result, banner relevance was confounded with
specific tasks. While this is an undesirable side effect of this experimental design, it reflects a
the four banners presented, two banners contained information that was relevant to the task and
two banners contained information that was irrelevant to the task. Of the two banners that
contained relevant information, one banner had a color background and the other banner had a
white background. The same was true for the banners that contained information irrelevant to
the task. At the end of each task, we asked the participant a series of questions (Appendix VI)
before moving on to the next task.
During the free-viewing portion of our study, which always occurred last, participants
were instructed by the test administrator to simply “look at” the webpage. Scrolling was
permitted to allow participants to view the entire webpage, but we did not permit any clicking or
other navigation off the webpage. Participants were given 15 seconds to view and scroll around
the webpage without a specific task to perform. At the end of the viewing time we asked the
participant a series of questions related to the webpage (Appendix VII) as a whole before
moving on to the next webpage. Each participant viewed a total of six web pages that each
displayed six different banners. The banners were the only difference between web pages.
Procedure
All participants were tested individually. The recruiter scheduled participants for
90-minute sessions between the dates of January 31st and February 15th, 2005. A detailed map and
directions to the lobby of the Golisano College of Computer and Information Sciences
(Appendix IV) along with a visitor-parking pass was mailed to each participant before the
scheduled date of their session.
Upon arrival, either the test administrator or an assistant greeted the participant in the
lobby. The participant was led to the lab and briefed regarding how the session would be
conducted. Each participant was given a consent form (Appendix VIII) to read and sign. The
test administrator explained that the participant could end the session at any time, for any reason,
without penalty. The participant was given a chance to ask any questions he/she had before
going into the lab. For greater detail on the introduction procedure, see Appendix IX. All
Once in the lab, the participant was briefed on the laboratory equipment. A brief
explanation on how the eye tracker worked, including the location of the cameras, monocle, and
infrared light were pointed out. The PC mouse and keyboard were the only equipment the
participant needed to interact with to browse the website on the monitor. Once the participant
was briefed, he/she put on the head-mounted eye tracker and the calibration process began.
Participants were notified that if, at anytime during the session, they felt discomfort, the eye
tracker could be adjusted, removed for a few minutes, or the session terminated. The test
administrator answered any further questions for the participant, then proceeded with the
calibration process.
The eye tracker headgear was placed on the participant and adjusted to fit snugly enough
so that it would not move during testing and not be tight enough to cause pain. Once the fit was
adjusted, the test administrator adjusted the monocle and cameras used to capture the pupil and
corneal reflection. Next, the administrator adjusted the E5Win software program to ensure
capture of the best image of the eye. These adjustments were to the camera brightness, pupil
diameter reading, and corneal reflection. Once a good calibration of the participant’s eye was
being displayed, the participant was instructed to look at nine different points on the monitor to
locate the foveal gaze.
The eye tracker was calibrated to a visual accuracy of 0.78 degree (arctan 0.32/24). This
degree of accuracy was determined by having the participant sit 24 inches away from the
monitor and look at each of the nine different calibration targets when instructed. The targets
were located in rows of three across the top, middle and bottom of the screen. Each calibration
target measured 0.32 inches in radius. For greater detail on the calibration screen points and
layout, see Appendix X. The point of gaze was computed in real time and presented
simultaneously on the screen along with the nine calibration checking circles. The point of gaze
had to be within the 0.65 inch (1.55 degree) diameter circle when the participant fixated the
center, to be considered accurate enough to move on to the next point for calibration. The
participant was instructed to look at each target during calibration and if the crosshair marker
(displayed as real-time feedback of the eye tracker’s computation of the participants gaze) was
within the 0.65 inch diameter circle on the screen, the calibration was determined to be accurate.
Participant was then instructed to view the next calibration target. Once the calibration of all
was clipped to the participant’s shirt to record audio during the session. Two mini DV tapes
were used to record video; one tape was for the scene camera and the second tape for the
over-the-shoulder camera.
The administrator then began the task-driven part of the session by reading a scenario
(Appendix V). The scenario simulated a real life situation where he/she would have to
accomplish a task. The participant had no time limit and was told to work at a pace and with a
level of care representative of how the participant would behave in his or her own office setting.
The test administrator read the instruction to the participant and the participant was asked if
he/she fully understood their objective and had any questions. If the participant did not have any
other questions and fully understood their objective, the administrator handed a reference card
(Appendix V) with the basic information needed to complete the task to the participant.
Participants typically placed the card on the desk and would read it from the desk or pick it up
and read it, then set it back down on the desk. The administrator brought up the starting
webpage and the participant began the task. As the participant worked through each task, the
administrative assistant in the lab took detailed notes about the participant’s behavior and
comments. For greater detail on the note-taking template used, see Appendix XI.
The participant was instructed to close the browser window when finished with the task.
The participant was handed a series of questions to follow along with while the administrator
read the questions aloud (Appendix VI). After all the questions had been answered, the
calibration of the eye tracker was checked again. The participant was instructed to look at a
point on the monitor to ensure the calibration was still accurate to within 1.55 degree visual
angle. The participant was recalibrated if necessary. This process was repeated for each of the
four tasks. At the end of the fourth task the participant was asked a series of questions related to
the website as a whole. Specific questions can be found in Appendix VI.
Before we began the second part of the session, which was the free-viewing portion, the
calibration was checked again and recalibrated if necessary. The administrator explained to the
participant that this portion of the experiment would not involve any navigation of the website.
Participants were instructed to simply “look at” the webpage. They were permitted to scroll the
webpage, but were told not to click on any hyperlinks and/or navigate off the page. Once the
15 seconds. At the end of the 15 seconds, the administrator asked the participant a series of
questions (Appendix VII) related to the webpage. No reference to the banners was made at this
point. After completion of the questions for that page, calibration was checked again, using just
a single point, and adjustments were made if needed. The administrator brought up the next
webpage for the participant. This process was repeated for each of the six webpages the first
pass through. After the participant had gone through each webpage once, they were instructed to
go back to the first webpage again. This time, the participant was asked a series of banner
specific questions (Appendix VII). This process was again repeated for each of the six
webpages.
At the completion of the second pass through the six webpages, each participant was then
asked a series of questions pertaining to the website as a whole. Further details of these
questions can be found in Appendix VII. Time permitting, participants were then instructed to
look at one last webpage that contained an animated banner. They were asked a series of
questions related to this banner (Appendix VII). Screen shots of the six banners used can be
found in Appendix XII.
At the end of the test, the test administrator notified the participant that the experiment
was over and the eye tracker headgear was removed. The administrator stopped recording of
both DV tapes and turned off the audio equipment. Participants were notified as to how they
would be receiving their payment and given the contact information of the recruiter in the event
of questions regarding payment. The test administrator thanked the participant for their time and
showed him/her back to the lobby from which they entered. This concluded the session. Further
details of Eye Tracking Recording Sheet can be found in Appendix XI.
Analysis
Eye Tracking Analysis
The eye tracking video data were encoded and analyzed after the data collection sessions.
The encoding of the eye tracking data used a custom MATLAB software application. This
program allowed us to capture the user’s point of fixation during the task starting at the time of
entrance into an area of interest (AOI) and stopping when they exited the area of interest. Figure
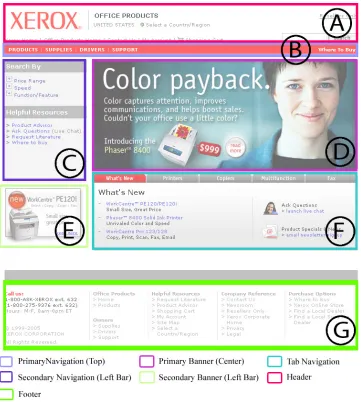
Figure 3: Areas of Interest on the Website.
The areas of interest in our study included:
• Header (A)
Manual encoding was done by playing back the eye tracking video that represented the
participant’s point of fixation with a cross-hair overlay on the screen. Figure 4 shows an image
captured through the scene camera with a picture-in-picture (PIP) of the eye camera. This image
demonstrates what the crosshairs looked like as they overlaid the screen with which the
[image:22.612.71.547.187.503.2]participant was interacting.
Figure 4: Scene Camera with Crosshairs Overlaid on the Screen and a picture-in-picture
inset of the Eye Camera.
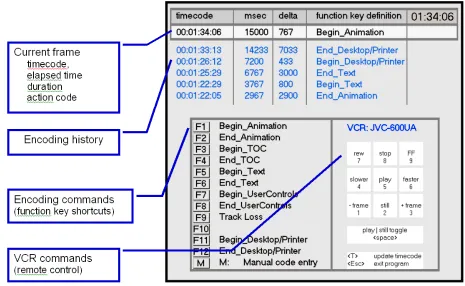
As the crosshairs moved in and out of different areas of interests the experimenter
pressed one of eleven function keys to record movement into and out of the predefined areas of
interest. When the function key was pressed, a timestamp associated with the video clip was
recorded. Function keys represented the entering and exiting of areas of interest. The total time
spent on the area of interest could then be calculated along with the number of dwells. The
encoding application also allowed for customized inputs. Figure 5 below shows a screen shot of
Figure 5: Screen shot of the encoding application interface with main areas labeled.
After data from each participant was encoded and saved, the results were exported to a
spreadsheet where they could be further analyzed. The individual participant data spreadsheets
were eventually combined so that further statistical analysis could take place. We performed ad
hoc analyses to compare the visual behaviors in the Task and Task-free conditions. We wanted
to see if the way in which the study itself was conducted (i.e., whether it was task free or task
driven) would influence participants’ viewing behavior. We looked at how task free searches
and task driven searches would increase or decrease the frequency or total duration of dwells on
a visual element. We also analyzed the data to determine whether users spend less time looking
Results
Task Driven Results
The task-driven portion of our experiment attempted to address our hypotheses.
Hypothesis 1 stated that the background color of the banner would influence banner-viewing
behavior. Hypothesis 2 stated that the relevance of the banner content to the task at hand would
influence banner-viewing behavior. Tables 1 and 2 below show summary data of total and
average time and dwells on white and color background banners and relevant and irrelevant
banners to the task on the homepage.
Total time spent viewing the banner across all
participants (sec)
Average time spent viewing the banner per participant (sec)
Time on Color BG: 60.2 2.6
Time on White BG: 63.5 2.8
Total number of dwells on the banner across all participants (dwells)
Average number of dwells on the banner per participant (dwells)
Dwells on Color BG: 66 2.9
[image:24.612.70.516.261.415.2]Dwells on White BG: 78 3.4
Table 1: Time and Dwells on White and Color Background Banners.
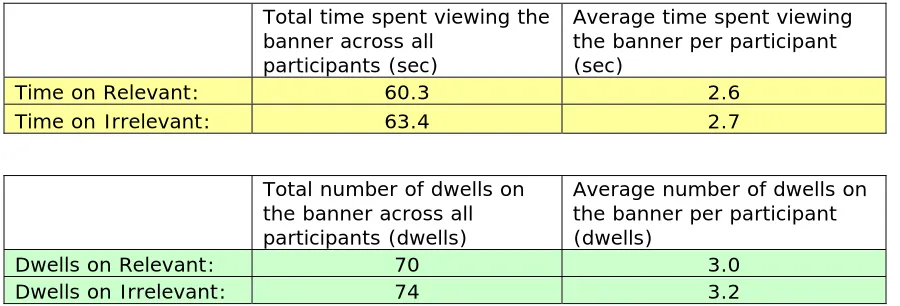
Total time spent viewing the banner across all
participants (sec)
Average time spent viewing the banner per participant (sec)
Time on Relevant: 60.3 2.6
Time on Irrelevant: 63.4 2.7
Total number of dwells on the banner across all participants (dwells)
Average number of dwells on the banner per participant (dwells)
Dwells on Relevant: 70 3.0
Dwells on Irrelevant: 74 3.2
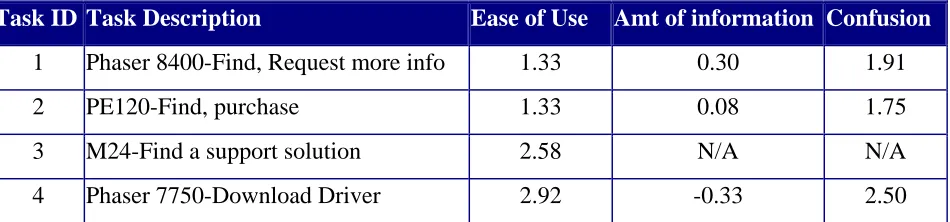
[image:24.612.70.520.474.627.2]Each of the twenty-four participants answered a series of questions after each task
(Appendix VI). Tables 3 and 4 outline the participant feedback to the task driven questionnaire.
Each scale ranged from -4 (Extremely difficult, Much too Little Information, or Extremely
Confusing) to +4 (Extremely Easy, Much too Much Information, or Extremely Clear) with 0
being neutral. See Appendix XI for further details of eye tracking recording sheet and Appendix
XIII for a summary of the eye tracking recording data.
Average Ratings By Task
Task ID Task Description Ease of Use Amt of information Confusion
1 Phaser 8400-Find, Request more info 1.33 0.30 1.91
2 PE120-Find, purchase 1.33 0.08 1.75
3 M24-Find a support solution 2.58 N/A N/A
[image:25.612.75.550.229.340.2]4 Phaser 7750-Download Driver 2.92 -0.33 2.50
Table 3: Participant feedback and ratings to the task driven questionnaire.
Website Attributes
Attribute Count
Attribute # of Participants who agreed
professional 22 savvy 5
vibrant 5
complicated 4 slow 2 playful 1 dull 1 none of the above 1
disorganized 0
Additional Information:
# who selected professional alone: 10 # who selected professional and savvy: 5 # who selected savvy alone: 0 # selected professional and vibrant: 4 # selected vibrant alone: 1 # selected professional and complicated: 3 # selected complicated alone 1 # selected professional, savvy, vibrant 2
Analysis of the eye tracking data during the task driven portion of the experiment
revealed no significant difference between the white and color banner background with respect
to total time participants dwelled on the banner (1-Tailed Wilcoxon Signed-Rank Test, P =
0.4801) or the number of dwells on the banner (1-Tailed Wilcoxon Signed-Rank Test, P =
0.3156). Graphs of the median total dwell time and median number of dwells on the banner with
[image:26.612.83.545.251.528.2]respect to banner background color across 4 tasks can be found in Figure 6 and Figure 7.
Figure 6: Median Total Dwell Time with respect to Banner Background Color Across Four
Figure 7: Median Number of Dwells on the Banner with respect to Banner Background
Color Across 4 Tasks. Asterisks (*) represent the median values.
We found no significant difference between a task relevant banner and a task irrelevant
banner with respect to total time participants dwelled on (1-Tailed Wilcoxon Signed-Rank Test,
P = 0.1379) or number of dwells (1-Tailed Wilcoxon Signed-Rank Test, P = 0.2578) on the
banner. Graphs of the median total dwell time and median number of dwells on the banner with
respect to banner relevance can be found in Figures 8 and 9. The output of the statistical
Dwells on Homepage Banner Across 4 Tasks
0 5 10 15 20 25
Relevant Banners Irrelevant Banners
Median Total Dwell Time
on Homepage Banner (seconds)
[image:28.612.84.490.88.342.2]n=23 Boxes: 1st - 3rd quartile Whiskers: Min & Max Asterisks (*): Median Value
Figure 8: Median Total Dwell Time on the Banner with Respect to Banner Relevance.
Dwells on Homepage Banner Across 4 Tasks
0 2 4 6 8 10 12 14
Relevant Banners Irrelevant Banners
Median Number of Dwells on Homepage Banner
n=23 Boxes: 1st - 3rd quartile Whiskers: Min & Max Asterisks (*): Median Values
[image:28.612.87.491.417.661.2]
We plotted total dwells on homepage vs. task order because we were interested in seeing
if repeated exposure to the same webpage resulted in an increase in banner blindness (i.e.,
decreasing frequency or duration of dwells on the banner).
Banner viewing, with respect to total dwells, decreased significantly with each successive
task (Friedman test, p<.05) see Figure 10.
Total Dwells on Homepage Banner vs. Task Order
0 10 20 30 40 50 60 70
First Task Second Task Third Task Fourth Task
Task Order
[image:29.612.109.533.232.501.2]n=23
Figure 10: Total Dwells For All Participants Across Tasks on Homepage.
We hypothesized that the decreasing time spent viewing the banner with later tasks could
result from either of two causes:
1. Participants learn where the banner ad is, judge that it is irrelevant to their work and
avoid it.
2. Participants learn the general structure of the site and become faster at performing tasks
and leave the home page more quickly on later tasks thus having less opportunity to see
the banner ad.
While it is difficult to distinguish between these two possibilities, we plotted total dwells
on the homepage banner vs. elapsed time spent on the homepage accumulated across tasks as a
time elapses on the homepage suggesting that participants quickly learn to avoid banners
perceived to be irrelevant to the task with elapsed time spent on the homepage.
ells on Banner Across Elapsed Time on Homepage
We predicted that task free vs. task driven viewing would impact participant viewing
s
,
Figure 11: Total Dw
behavior and be reflected in an increase or decrease in the frequency or total duration of dwell
on the banner. While we tracked participants’ eye movements for the first 15 seconds on each
home page stimulus in the task free condition, participants spent different amounts of time
viewing the home page before navigating to another page or completing the task in the task
driven condition. As a result, tasks on which a participant spent more time on the home page
provided a greater opportunity for dwells on the banner advertisement. To remove such a bias
we looked at only the first 10 seconds2 of eye position data for comparison between the four
tasks and the free viewing condition. Some participants completed some tasks in less than 10
seconds. In those cases we normalized the data as follows. If the participant spent at least 10
seconds on the home page before navigating off or completing the task, no adjustment was
2
[image:30.612.80.537.151.416.2]io of
performed. If a participant spent less than 10 seconds on the homepage, we looked at the rat
dwell time on the banner to the total amount of time spent on the homepage. We multiplied this
ratio times 10 seconds to reflect 10 seconds of viewing time to better compare the results against
each other and ensure no data were lost. This process was repeated across each task. There were
six such cases in the first task, eight such cases in the second task, thirteen such cases in the third
task and fourteen such cases in the fourth task. As participants became more familiar with the
site, they spent less time on the homepage. We found significantly more dwells on the banner
and more total banner viewing time (Friedman test, p<.05) in the task-free context. A graph of
[image:31.612.76.518.290.560.2]banner dwells with respect to task presentation can be found in Figure 12.
Figure 12: Normalized Time Spent on Homepage Banner
Free Viewing Results
The free viewing portion of our experiment gave participants a standard viewing time (15
seconds) of a webpage in which they were instructed to simply look over the webpage and not
click on any links or navigate off the page. At the end of the time, they were asked a series of
website related questions the first pass through (Appendix VII). Tables 5 and 6 below outline
the participant feedback to the free viewing questionnaire. The banner rating ranged from -4
(Extremely difficult, Much too Little Information, or Extremely Confusing) to +4 (Extremely
Easy, Much too Much Information, or Extremely Clear) with 0 being neutral.
Banner ID
Product advertised
Title Background Person Displayed Price Overall Appeal Attention-getting Background Appeal
1 WorkCentre Streamline Complex In BG No 1.17 2.13 1.58 2 Phaser Solid Choice White No Yes -0.54 1.38 -1.13
3 Phaser Color
Payback Complex Yes Yes 0.71 1.38 1.17
4 WorkCentre Delegate White On printouts No -0.50 1.46 -0.96 5 Phaser Solid Choice Complex No Yes 2.21 2.54 2.13
6 WorkCentre Delegate Complex Yes Yes 1.08 1.13 0.50
[image:32.612.60.566.265.433.2]Animated Xerox Color N/A White No No 1.83 2.79 N/A
Table 5: Mean Banner Ratings Comparison. Banner ID’s 2, 4, 5, 6 were used in the first part of the study.
Each participant was asked three questions at the conclusion of the free viewing part of the
experiment.
1. Do you prefer banners with a white or color/image background?
Number preferring White: 6 Number preferring Color/Image: 18
2. Do you prefer banners with an image of a person or without an image of a person?
Number preferring Person: 11 Number preferring No Person: 13
3. Do you think the price of the product should or shouldn’t be displayed on a banner?
Number preferring Price: 20 Number preferring No Price: 4
The result of question one suggests that a participant’s preference for a color/image
background does not translate into increased banner fixations during task driven or free viewing
scenarios. This is important to acknowledge because had the experiment been run using only
subjective questions like those in Table 6, the experiment would have only been testing the
of eye tracking. This allows for a more in-depth observation of how the participant interacts
with the environment and measures their performance rather than simply gathering opinions.
Reporting only the opinions displayed in Table 6 back to Xerox would have been greatly
misleading and conflicting with the results from eye tracking.
Eye tracking data of participants looking at the webpage in the task-free condition were
recorded and analyzed. The webpage was broken down into seven areas of interest: header,
header navigation, left navigation, primary banner (center), secondary banner (left), tab
navigation and footer. Refer to Figure 3 for further details of the area of interest. Each banner
was then broken down in several areas of interests depending on the banner’s content. These
areas of interest included main title, block of text, person/face, read more button, printer image,
editors choice button and a price tag. Banner areas of interest were not always the same size,
(i.e., the size the printer and human/face areas of interest differed between banners), and thus
were adjusted for size so they could be compared. Calculating the area of interest size (pixels)
divided by the total dwell time multiplied by 1000 did this. See Figures 13 and 14 for outline of
how each banner area of interest was defined. Each banner area of interest fell into the category
of title text, detail text, printer image, facial image, price tag or read more button. Figure 15
shows each banner element and the adjusted dwell time (mS). No further analysis was done on
[image:33.612.73.509.476.711.2]this data.
[image:35.612.74.509.68.694.2]
Discussion
We expected that changes to the background color of the banner and the banner relevance
to the task at hand would have a significant effect on participant banner-viewing behavior. The
statistical evidence does not support our hypotheses.
Hypothesis 1: The background color of the banner would influence banner-viewing
behavior. The background color of the banner had no significant effect on banner-viewing
behavior (i.e., time or number of dwells on the banner). Table 1 shows time and dwells on
both white and color background banners. Despite the differences found, none proved to be
significant (Appendix XIV). This could have been partially due to the relatively small
sample size of 23 participants.
Hypothesis 2: The relevance of the banner content to the task at hand would influence
banner-viewing behavior. The relevance of the banner content to the task did not
significantly affect the viewing time or number of dwells on the banner. Table 2 shows time
and dwells on banners that were relevant and irrelevant to the task. None proved to be
significant (Appendix XIV).
Deploying visual attention to banners seems to be most common when a user initially
visits a webpage. Users quickly learn the structure of a webpage and avoid visual fixations on
banner ads. This learning sees to occur mostly during the initial exposure to a web page. Our
study suggests that users generally assume that banner ads are irrelevant to the task at hand
indicating that users generalize experiences from one webpage to another. Eye tracking data
proved to be a valuable supplement to other quantifiable measurements such as click-through
rates because it allows for a deeper look into the participant’s behavioral actions than does
click-through rate measurement alone. Just because a user did not click on the banner does not mean
that he or she did not fixate on it and/or gain insight on the information they were seeking though
the banner. Our study shows that eye tracking is a useful tool for understanding user behavior
and evaluating alternative designs when developing websites.
The time that participants spent looking at banners with white backgrounds was slightly
backgrounds. (see Table 1). This may suggest that some participants did not distinguish
between the white banner background and the white webpage background, thus making the
banner content blend better into the page itself. With a higher sample size, this difference could
prove to be significant. This would confirm that a user’s preference, in terms of banner
aesthetics, is not always what he or she fixates on during a real task scenario. Participants might
be assuming that clearly distinguishable banner ads contain irrelevant information and thus avoid
it.
The contradictory results, participants preferring color background banners but fixating
and clicking more on white background banners, is a testament to the value added by eye
tracking and the way in which the usability experiment was conducted. Taking the results of
only the traditional usability questionnaire (Appendix VII), would have suggested that
participants preferred banners with a color background.
Participants in a task driven scenario, as opposed to sitting in front of a screen and being
asked simply to look at a web page, yielded significantly different results. Refer to Figure 12 for
a graph of banner dwells with respect to task presentation. Another study (Wong, 2001) claims
participants are not “totally banner blind” but never tested the banner in a task driven scenario to
see how users would react. Our study showed significantly higher dwells and total viewing time
on the banner in the task-free context, suggesting that the way in which the experiment is
Recommendations for Further Study
This study has opened the door to other future research possibilities that we either did not
touch upon at all during our research or touched upon modestly. Other such research
possibilities could include:
• How banner animation affected participant behavior. We looked briefly at banners that
had animation in them and how that affected user behavior. We did not analyze the
data and did not conduct enough tests to really gain a firm understanding of banner
animation. A separate experiment could be setup to look specifically at this.
• Various banner placements on a webpage. All banners tested were constantly displayed in the same position on the webpage. Consider experimenting with a design that moves
banner ads on the page from visit to visit to determine if such variable placement of ads
might increase their attention-getting effectiveness without disrupting the user task
performance.
• Content within the banners. Although we did some analysis on banner content the
experiment itself was not set up in a way that could give us concrete results that would
point to specific banner content such as a person’s face.
• Users’ memory for the content of banner ads (Spillers, 2004). We did not test if
participants could accurately recall the different contents within the banner ad.
• The size and text within the banner. We did not vary the size of any of the banners and
we also did not control the text within the banners.
• Consider conducting more in-depth analysis of the eye tracking data to investigate the pattern of eye movements over extended periods of time (Pelz & Canosa & Babcock,
2000). We only analyzed a fixed amount of time during the task-drive portion of the
experiment. A software tool, created by Julia West (2005), called eyePatterns could be
We recommend choosing a banner background color based on factors other than their
ability to attract visual attention. Google is one company that offers content specific advertising
to target audiences. Their advertising success with small banner and text ads could be worth
further research. Further research in any of these areas would help us gain a better understanding
of customer behavior thus helping businesses, which want to improve their site’s usability for
sales and for customers who want to navigate the site without being distracted by irrelevant or
annoying ads. Assume that users of the website will be most likely to look at a banner on their
first visit to a page. Analyze the tasks of users on initial visits to the home page and target
banner advertising accordingly.
Additional cost-benefit analysis of usability testing (Ellender, 2003; Nielsen, 2003) in the
corporate world with respect to how best to incorporate usability testing into a project could be
done. Ellender suggests that the best returns on your usability investments will be yielded if
usability testing is done at the earliest stages and continues throughout the development process
but only offers one example. This idea could be tested more extensively in a controlled setting.
Acknowledgements
I would like to thank all of the following for their hard work and support throughout this
entire project: Julia West, Christina Sekella, Melissa Spike, Mary Ellen Arndt, David Bates,
Henry Eakland, Rebecca Ducsik, Aanand Parthasarathi, Jeff Pelz, Chad Weeden, Tracy Clark
References
Albert, W. (2002). Do Web Users Actually Look at Ads? A Case Study of Banner Ads and Eye-Tracking Technology. Waltham, MA: Proceedings of the 11th Annual Conference of the
Usability Professionals Association. Orlando, FL, July 2002.
Amiri, A. & Menon, S. (2003). Efficient scheduling of Internet banner advertisements. ACM Transactions on Internet Technology (TOIT),3 (4), 334-346.
Bayles, M.E. (2002). Designing Online Banner Advertisements: Should We Animate?
Proceedings of the SIGCHI conference on Human factors in computing systems, Minneapolis, Minnesota, 363 – 366. ACM Press: New York.
Benway, J. P. (1998). Banner blindness: The irony of attention grabbing on the World Wide Web. Proceedings of the Human Factors and Ergonomics Society 42nd Annual Meeting, 1, 463-467.
Benway, J. P. & Lane, D.M. (1998). Banner blindness: Web searchers often miss 'obvious' links, Internetworking. ITG Newsletter, 1(3).
Benway, J.P. (1999) "Banner blindness: What searching users notice and do not notice on the World Wide Web". PhD thesis, Rice University, Houston, Texas.
Clark, J. (2002). Building Accessible Websites: A New Book on Web Accessibility, Berkeley, CA: New Riders Press.
Dodge and Cline (1901). The angle velocity of eye movements. Psychological Review, 8, 145-157.
DoubleClick. Research Sources and Findings: Banner Ad Placement Study.
http://www.webreference.com/dev/banners/research.html Web accessed on November 20, 2005.
Ellender, D. (2003, March). Usability testing is not a panacea. So when is the right time to spend your usability budget? Nomensa. Retrieved November 15, 2005.
http://www.nomensa.com/resources/articles/user-experience-strategy-articles/usability-when-to-spend.html
Internet Advertising Bureau (IAB) Online Advertising Effectiveness Study 1997: Beyond the Banner.
Jacob, R.J. and Karn, K.S. (2003) Eye tracking in human-computer interaction and usability research: Ready to deliver the promises. In Radach, H.J. and Deubel, H. (Eds.), The Mind’s Eye: Cognitive and Applied Aspects of Eye Movement Research. Elsevier Science, Amsterdam.
Jerz, D. (2002) Usability Testing is Not Opinion Gathering,
http://jerz.setonhill.edu/design/usability/tips.htm Web accessed on December 20, 2006.
Larson, R. Interaction Paradigms. http://sherlock.berkeley.edu/ucla_dl_workshop/node5.html
Web accessed on December 1, 2005.
Nielsen, J. (2003). Usability Return on Investment. Fremont, CA: Nielsen Norman Group.
http://www.useit.com/alertbox/20030107.html Web accessed on November 27, 2005.
Nielsen, J. (1994). Usability Engineering: The Morgan Kaufmann Series in Interactive Technologies. San Francisco, CA: Morgan Kaufmann.
Pan, B. and Hembrooke, H. and Gay, G. and Granka, L. and Feusner, M. and Newman, J. (2004) The determinants of web page viewing behavior: an eye-tracking study, Proceedings of the 2004 symposium on Eye tracking research & applications, p.147-154, March 22-24, 2004, San
Antonio, Texas
Pelz, J.B. and Canosa, R. and Babcock, J. (2000) Extended tasks elicit complex eye movement patterns. In: Proceedings of the Eye Tracking Research and Applications Symposium 2000. ACM Press, NY, 37-43.
Schroeder, W. (1998) What is Eye-Tracking Good For?, User Interface Engineering,
http://www.uie.com/articles/eye_tracking_benefits Web accessed on November 29, 2005.
Spillers, F. (2004) Eye-Tracking Studies – Usability Holy Grail?
http://experiencedynamics.blogs.com/site_search_usability/2004/12/eyetracking_stu.html Web accessed on November 29, 2005.
Starkov, M. (2003). Brand Erosion, or How Not to Market Your Hotel on the Web. Hospitality eBusiness Strategies,
http://www.hospitalitynet.org/news/4016069.search?query=current+banner+ad+click Web accessed on December 12, 2005.
West, J. & Haake, A. & Rozanski, E., Karn, K. (2005). eyePatterns: software for identifying patterns and similarities across fixation sequences. San Diego, CA: Proceedings of the 2006 symposium on Eye tracking research & applications. 149-154.
Wikipedia (2005). Banner Blindness. http://en.wikipedia.org/wiki/Banner_blindness Web accessed on December 15, 2005.
Williamson, D. (1996), Web ads mark 2nd birthday with decisive issues ahead, Advertising Age,
http://www.adage.com/interactive/articles/19961021/article2.html Web accessed on November 21, 2005.
Appendix I: Screening Questionnaire
Usability Screener for Xerox.com Eye-tracking Study
December 20, 2004Respondent Name: Telephone#:
Title: Interviewer:
Company: Appointment Date & Time:
INTERVIEWER: Ask to speak with a person who is involved in the process of selecting office equipment such as printers, copiers, fax machines, or multi-function machines for the organization. The potential participant might perform any of the following in addition to other job responsibilities: researching, evaluating, recommending, specifying, approving, or purchasing printers, copiers, fax machines, or multifunction office machines.
Hello, My name is __________ of Karlamar Associates. This is not a sales call. We have been commissioned by Xerox Corporation and Rochester Institute of Technology to find qualified people to participate in a study of how people seek information when considering a purchase decision. The purpose of this call is to identify people who may have the qualifications and interest to participate in the study. Participants in the study will browse websites while researchers track their eye movements. The eye tracking system is comfortable and safe to use. It simply requires the participant to wear a headband that supports two miniature cameras. Each person who participates in a one-hour session will receive a financial honorarium of $100. The sessions will be scheduled January 31, 2005 through February 13, 2005 on the Rochester Institute of Technology campus. I'm calling to find out if you are interested and if you fit the profile of the participants that we seek. If you are interested, I would like to ask you some questions about your work experience. Your responses to these questions will determine if you are qualified to participate in the study and will take about 10 minutes. Is this a convenient time?
Yes CONTINUE
No SCHEDULE CALLBACK DATE & TIME:___________________
Refused ASK FOR A REFERRAL TO SOMEONE ELSE
Keep in mind that there are no right or wrong answers to these questions. It is important that you answer the questions as honestly as possible.
1. Have you or any member of your household ever worked for Xerox Corporation or any Xerox agent or dealer?
Yes – THANK AND TERMINATE
No – CONTINUE
2. Have you ever worked at designing or managing websites?
Yes – THANK AND TERMINATE
No – CONTINUE
Eye tracking technology is safe and the headband can be adjusted for comfort. Will you allow the use of the eye-tracking system?
Yes – CONTINUE
No – THANK AND TERMINATE
4. The evaluation sessions are typically recorded on videotape for analysis. Are you willing to allow video recording of the evaluation?
Yes – CONTINUE
No – THANK AND TERMINATE
5. The eye-tracking system may need to be adjusted based on the shape of your eyes. In order for us to enable proper adjustments we need to know your ethnic origin. Please select all ethnicities that apply. Are any of your ancestors …
Caucasian?
African /African American? American Indian / Alaska Native?
Asian / Pacific Islander? - THANK AND TERMINATE
6. Are you comfortable reading information on websites written in English and conversing fluently in English about your experiences?
Yes – CONTINUE
No – THANK AND TERMINATE
7. In the past 18 months, which of the following types of office equipment have you been involved in investigating, recommending and or purchasing for work? Please include brand and model. Please exclude purchases made for personal home use:
Inkjet printer – THIS ALONE DOES NOT QUALIFY
Direct-connect, desktop laser printer – CONTINUE
Network laser printer – CONTINUE
Copier – CONTINUE
Fax machine – CONTINUE
Multi-function inkjet product (e.g., combination copier / printer) – THIS ALONE DOES NOT QUALIFY
Multi-function laser product (e.g., combination copier / printer) – CONTINUE
Other ________________________________
None – THANK AND TERMINATE
Note to interviewer: Must have purchased some sort of “Xerox-class product” (i.e., laser technology – not just ink-jet and cost >$500,) If “Other” need to qualify with usability test administrator. Home business purchases are OK, but products for personal home use do not qualify.