RESEARCH
Malaria intervention scale-up in Africa:
effectiveness predictions for health programme
planning tools, based on dynamic transmission
modelling
Eline Korenromp
1*, Guy Mahiané
2, Matthew Hamilton
2, Carel Pretorius
2, Richard Cibulskis
3, Jeremy Lauer
4,
Thomas A. Smith
5,6and Olivier J. T. Briët
5,6Abstract
Background: Scale-up of malaria prevention and treatment needs to continue to further important gains made in the past decade, but national strategies and budget allocations are not always evidence-based. Statistical mod-els were developed summarizing dynamically simulated relations between increases in coverage and intervention impact, to inform a malaria module in the Spectrum health programme planning tool.
Methods: The dynamic Plasmodiumfalciparum transmission model OpenMalaria was used to simulate health effects of scale-up of insecticide-treated net (ITN) usage, indoor residual spraying (IRS), management of uncomplicated malaria cases (CM) and seasonal malaria chemoprophylaxis (SMC) over a 10-year horizon, over a range of settings with stable endemic malaria. Generalized linear regression models (GLMs) were used to summarize determinants of impact across a range of sub-Sahara African settings.
Results: Selected (best) GLMs explained 94–97 % of variation in simulated post-intervention parasite infection prevalence, 86–97 % of variation in case incidence (three age groups, three 3-year horizons), and 74–95 % of variation in malaria mortality. For any given effective population coverage, CM and ITNs were predicted to avert most preva-lent infections, cases and deaths, with lower impacts for IRS, and impacts of SMC limited to young children reached. Proportional impacts were larger at lower endemicity, and (except for SMC) largest in low-endemic settings with little seasonality. Incremental health impacts for a given coverage increase started to diminish noticeably at above ~40 % coverage, while in high-endemic settings, CM and ITNs acted in synergy by lowering endemicity. Vector control and CM, by reducing endemicity and acquired immunity, entail a partial rebound in malaria mortality among people above 5 years of age from around 5–7 years following scale-up. SMC does not reduce endemicity, but slightly shifts malaria to older ages by reducing immunity in child cohorts reached.
Conclusion: Health improvements following malaria intervention scale-up vary with endemicity, seasonality, age and time. Statistical models can emulate epidemiological dynamics and inform strategic planning and target setting for malaria control.
Keywords: Malaria, Prevention, Treatment, Vector control, Mortality, Morbidity, Health impact, Insecticide-treated mosquito nets, Indoor residual spraying, Programme planning, Modelling
© 2016 The Author(s). This article is distributed under the terms of the Creative Commons Attribution 4.0 International License (http://creativecommons.org/licenses/by/4.0/), which permits unrestricted use, distribution, and reproduction in any medium, provided you give appropriate credit to the original author(s) and the source, provide a link to the Creative Commons license, and indicate if changes were made. The Creative Commons Public Domain Dedication waiver (http://creativecommons.org/ publicdomain/zero/1.0/) applies to the data made available in this article, unless otherwise stated.
Open Access
*Correspondence: [email protected] 1 Avenir Health, Geneva, Switzerland
Background
Effective malaria prevention and treatment interven-tions have been scaled-up substantially with increas-ing national and donor fundincreas-ing since the early 2000s. Between 2000 and 2015, malaria incidence rates fell 37 % globally, and malaria mortality rates by 60 %, with even greater declines in Africa, the highest-burden region [1]. This was likely a combined result of improved malaria control and other factors independent of interventions [2].
To sustain these improvements, the World Health Organization (WHO) Global Technical Strategy for Malaria recommends further scale-up to universal cov-erage with suitable preventive and curative interventions [3]. Funding for malaria has now plateaued, however, placing more emphasis on prioritizing interventions with the most impact. While most countries focus on WHO-recommended proven effective interventions, national strategies and plans vary considerably in budget alloca-tions across intervenalloca-tions, and rationales for mixes of interventions are often not explicit [4]. National malaria control strategies and budget allocations should be evidence-based and explicitly justified. Field trials can directly inform only a sub-set of decisions, while sepa-rately parameterizing and analysing dynamical transmis-sion models tailored to each individual setting and policy option is prohibitively complex.
For HIV/AIDS, tuberculosis, family planning and other health areas, strategic decision-making is supported by simple programme planning tools that project the impact and cost of user-defined scale-up scenarios. One such tool is the Spectrum suite of policy models, used by over 120 low and middle-income countries for estima-tion of burdens, trends, service needs and programme impact for family planning, HIV/AIDS and tuberculo-sis [5–8]. As of 2015, Spectrum did not have a malaria module, though a simple linear coverage-impact func-tion included in the Lives Saved Tool (LiST) can model impacts of a sub-set of malaria interventions on under-5 mortality [9–11].
This article reports improved coverage-impact rela-tionships developed for a Spectrum malaria impact mod-ule. Impacts on both morbidity and mortality of scale-up of insecticide-treated mosquito nets (ITNs), indoor residual spraying (IRS), effective management of uncom-plicated malaria cases (CM) and seasonal malaria chemo-prophylaxis (SMC) were analysed using OpenMalaria, an individual-based stochastic model of Plasmodium
falci-parum infection and disease dynamics in human
popu-lations exposed to mosquitoes, which has been fitted to extensive data on age and exposure patterns of preva-lence and disease in sub-Sahara African settings with sta-ble endemic malaria [12, 13]. The simulated impacts (in
different age groups) were summarized using regression models, and the results compared with previous interna-tional consensus estimates and key empirical data. The validity, precision and accuracy of the resulting statistical relationships were considered with a view to their use for national programme planning.
Methods
Definition of interventions
For each of the four interventions coverage-impact rela-tionships were simulated for scale up with coverage vary-ing between 0 and 80 %.
Effective coverage of CM, defined as ‘adherence to and completion of a full course of a recommended treat-ment with a good-quality anti-malarial medication’, was expressed in terms of coverage within 14 days of onset of the episode, and modelled as described in [14]. A value of 48 % was assumed for effective coverage of appropriate care for severe cases in all simulations [15].
IRS was simulated with the long-acting insecticide Actellic CS, which kills mosquitoes up to 12 months or longer [16], at the beginning of each year i.e. before the peak transmission season. Unlike for other interventions, for IRS the coverage simulated was either 0 or 80 % of the population at risk protected, without any intermedi-ate values, to reflect policy-making and practice of IRS implementation at district level.
ITNs were modelled as pyrethroid-impregnated long-lasting nets, assuming full mosquito susceptibility (type Zeneti) [17, 18]. The proportion of mosquitoes whose biting is potentially impeded by ITNs and IRS (πi), based on patterns of night-time versus day-time biting and human behaviours, was set at 0.65 [19, 20]. ITN coverage was defined as the proportion of people of any age at risk of malaria who slept under an ITN the previous night. In OpenMalaria, this coverage was achieved simulating annual deployments of ITNs, each assumed to be effec-tive for 1 year without decay.
coverage proportion of children receiving all three SMC rounds, and the remaining non-covered children receiv-ing no SMC at all. In OpenMalaria, SMC acts as an effec-tive short-acting drug treatment, clearing any malaria infections (whether symptomatic or not) over the 10 days following drug administration, and lowering acquired immunity, similar to the effect of vaccination [23].
Simulation of status quo
Simulated populations had an age distribution as in rural Tanzania [24]. All simulations included a low level of imported infections (1 per 1000 people per year) to pre-vent stochastic malaria extinction. Six different variants (calibrations) of OpenMalaria were used [25], differing in assumptions about immunity decay, heterogeneity in transmission, and co-morbidity [13]. These contributed uncertainty to the statistical impact functions. All pos-sible combinations of parameter values listed in Table 1 comprise a total of 165,888 scenarios. Each scenario was simulated once for a population of 50,000 individu-als, which was judged adequate to minimize undesired stochastic noise in case incidence. Simulations were run using OpenMalaria Schema version 32 [26].
Differing endemicity was simulated by varying both the level and seasonality of the annual entomological inoculation rate (EIR). Six baseline transmission levels, covering the EIR range from 1 to 300 infectious bites per person-year (Table 1), were modelled. Seasonality in transmission was parameterized as the coefficient of variation (CV) in EIR over a year, defined as the stand-ard deviation divided by the year-average of monthly EIR [27], and simulated at three values (Table 1):
• Low seasonality, as the 5th percentile of CV across
malaria-endemic sub-Saharan Africa, based on a
map of seasonality estimates provided by the Malaria
Atlas Project (MAP) [2, 28]; such a seasonality might
be expected in Equatorial Guinea;
• High seasonality, as the 95th percentile of CV,
repre-senting for example northern Burkina Faso;
• Intermediate seasonality, corresponding to the 50th
percentile.
Populations were simulated with long warm-up phases so that intervention scale-up started at endemic equilibrium prevalence of infection with P. falciparum (PfPR) with the assigned EIR and initial coverage of CM (Table 1) applied throughout the warm-up [29]. The sim-ulations were run forward with the 2015 coverage of IRS added in, to reach a new approximate steady state. ITN scale-up to the initial (2015) coverage was simulated as a linear increase from 0 % of people sleeping under an ITN in 2004 up to the defined initial coverage in 2014 (Table 1) in line with ITN scale-up patterns in sub-Saha-ran Africa [1].
Simulation of scale‑up
Target coverage levels of interventions are given in Table 1. The 80 % maximum coverage target corre-sponds to projections used by WHO’s Malaria Global Technical Strategy [3], with universal coverage of core malaria interventions interpreted as 80–90 % for ITNs, 80–90 % for SMC as well as 80–90 % for artemisinin-based treatment of laboratory-confirmed malaria cases in the public sector [30]. Scale-up to target coverages was implemented as a one-off step increase at the start of 2016, maintained until the end of 2025.
Health outcomes
The outcomes analysed were:
Table 1 Design of simulations in OpenMalaria dynamic transmission model
Parameter Parameter values specifying simulations
Transmission seasonality
Coefficient of variation in EIR over a year Low seasonal: 0.121Moderately seasonal: 1.31 Highly seasonal: 2.66 Pre-intervention annual EIR (infectious bites per person per year) during simulation’s warm-up phase
before IRS intervention starts 1, 3, 10, 30, 100 and 300 ITN coverage: people sleeping under ITN the previous night Initial: 0, 30, 60 %
Target: 0, 30, 60, 80 %
IRS coverage: people protected Initial: 0, 80 %
Target: 0, 80 % Case management: uncomplicated cases treated effectively Initial: 0, 30, 60 %
Target: 0, 30, 60, 80 % Seasonal malaria chemoprophylaxis: children 3–59 months old receiving three courses within a malaria
[image:3.595.56.538.550.713.2]
• Incidence of malaria episodes (including
uncom-plicated and severe episodes), in 0–4 year olds,
5–14 year olds and 15+ year olds;
• Malaria-attributable mortality rate, in 0–4 year olds,
5–14 year olds and 15+ year olds;
• PfPR in 2–9 year olds, which is the age group for
which most PfPR data are available.
Impacts were analysed as proportional reductions in case incidence, malaria-attributable mortality and PfPR, relative to ‘counterfactual’ scenarios with zero coverage of the intervention concerned over the same time period, to characterize the full impact of each intervention. Impacts were modelled separately for three time horizons: 1–3 years following intervention scale-up, and 4–6 years and 8–10 years after intervention scale-up in year ‘1’ (denoted 2016 in calendar time). Simulation outcomes were recorded at monthly intervals, and aggregated to annual averages or totals for statistical modelling.
Statistical analysis
Relationships between intervention coverage, endemicity and the following health burden outcomes in OpenMa-laria simulations were fitted using polynomial regres-sions. Outcome variables (i.e. dependent variables) were:
• Incidence rate of malaria episodes/cases
(uncompli-cated and severe), in 0–4 year olds, 5–14 year olds
and 15+ year olds in the population (whether or not
diagnosed in a health facility);
• Direct malaria-attributable death rate, in 0–4 year
olds, 5–14 year olds and 15+ year olds;
• PfPR (a ratio), in 2–9 year olds.
Each outcome in each age group was assessed sepa-rately for three different time periods within the time horizon most relevant to strategic planning, i.e. 10 years from intervention start. The three time periods were taken as multiple-year averages, to reduce stochastic noise: years 1–3, years 4–6 and years 8–10.
Outcome variables were logit-transformed. Outcomes that can take values greater than one were rescaled by dividing each value by the maximum value across all simulations. To allow well-defined regressions on logit-transformed outcomes, all zero outcomes (i.e. an aver-age of zero over years 1–3, years 4–6 or years 8–10) were replaced by half of the minimum rate in any other simulated scenario-year for that outcome. This was done for <0.01 % of simulation-year data points for PfPR and case incidence in all time periods and age groups, for 18–24 % of for malaria-attributable mortality data points in 0–4 year olds (across the three horizons), for 7–11 %
of data points for 5–14 year olds and for 5–10 % of data points for 15+ year olds.
Explanatory (i.e. independent) variables (all continu-ous; Additional files 1, 2) were:
• Simulated PfPR in 2–9 year olds averaged over 2000–
2002, and PfPR in 2–9 year olds averaged over 2000–
2002 to the power of one-third (1/3);
• Simulated annual EIR, averaged over 2000–2002 at a
log10 scale, as well as a coefficient for the one-third power of simulated EIR at a log10 scale;
• OpenMalaria model variant;
• Seasonality CV;
• Initial (2015) coverages for ITN, IRS and CM;
• Target coverages (2016 and onwards) for ITN, IRS,
CM and SMC.
Model and predictor variable selection was done using Akaike’s Information Criterion (AIC) [31], for the impact functions for each of the seven outcomes at the 2019–2021 time horizon. All potential predictors, including simulated PfPR and EIR, and their second-order (quadratic) terms, together with the interaction effects were included in an initial model. The stepwise (bidirectional elimination) AIC procedure was then applied to select models. The seven resulting regres-sion structures for this (years 4–6) time horizon were then imposed and applied to the corresponding seven outcomes for years 1–3, and to the seven outcomes for years 8–10 models for each of the health outcome and age group combinations, so as to obtain standardized statistical impact models for each of the seven combina-tions of health outcomes and age groups, that are easily interpreted and compared in terms of the pattern over the overall 10-year horizon.
Statistical modelling was performed using the R-sta-tistical package [32] version 3.1.3, using the linear model function ‘lm’ in R. The R code is available from Avenir Health upon request.
Statistical predictions
The selected statistical models and their parameteriza-tions were applied to predict health impacts of inter-vention scale-up (and scale-down) for four hypothetical provinces, covering the range of endemicity situations occurring in sub-Saharan Africa with respect to base-line endemicity and seasonality. Seasonality values at the 2.5th and 97.5th percentiles of seasonality CVs across Admin1 units in sub-Saharan Africa [2, 28] were selected; for each of these two seasonality CV values, selected PfPR values were the 10th and 90th percentile of distri-butions of simulated PfPR in 2–9 years averaged over 2000–2002 in the subset of OpenMalaria scenarios with 0 % baseline coverage of all interventions: i.e. for a low seasonality CV of 0.2, PfPR values of 11 and 82 %; and for the high seasonality CV of 2.5, PfPR values of 0.3 and 71 %, respectively.
Prediction results were presented as proportional reductions in the burden rate, based on burden rates pre-dicted following intervention scale-up, compared with burden rates at the same time horizon for a ‘counterfac-tual scenario’ without that intervention’s (or combination of interventions) scale-up. Unless otherwise indicated, predictions assumed 0 % coverage of all interventions before 2016. Proportional reductions were the focus out-come instead of absolute reductions, because OpenMa-laria burden levels were not calibrated on burden levels as estimated by the WHO, which have different defini-tions. The Spectrum programme planning tool will apply the predicted proportional reductions to WHO ‘baseline burden’ estimates to predict future burdens as a function of intervention scale-up.
Assessing internal and external validity of statistical models
Internal validity of the statistical models was assessed based on adjusted coefficient of determination (R2), for the selected models described above and several alterna-tive models, differing in the treatment of simulated zero outcomes, in the transformation applied to simulation outcomes before regressions, or in predictor variables included.
For each model, furthermore, out-of-sample predic-tions were performed, by drawing random samples of 100,000 simulations to inform the regression functions. Prediction errors were then assessed by estimating the mean squared error (MSE), evaluated using the remain-ing 65,888 simulations. This process was repeated 25 times and the average of their MSE was expressed and evaluated relative to the variance in the simulated health outcome of interest.
External validity was assessed by comparing patterns of predicted proportional health impacts as a function of
endemicity, age, time, coverage levels, and interactions among interventions with earlier simulations by Open-Malaria and other dynamic transmission models.
In addition, predictions were performed for three cluster-randomized ITN trials conducted in the 1990s in Western Kenya, coastal Kenya and Ghana that observed estimated community-level ITN impacts on parasite infection prevalence, case incidence and mortality in chil-dren under-5 years [33], which are considered the gold standard for earlier global, regional and country-level ITN impact estimations [10, 11, 34–36]. These predic-tions, in contrast to those for the hypothetical provinces, used separate regression functions for only years 1 and 2 following ITN scale-up, to match the two-year duration of the trials. Predictor variables for the three trial predic-tions were based on endemicity as estimated by MAP, and trial data on coverage of ITNs and CM (Additional file 3). For mortality, since trials used as key observed outcome all-cause under-5 mortality, trial predictions included not only direct malaria-attributed mortality, but also indirect malaria-related mortality, which in OpenMalaria simula-tions for African settings occurs at similar rates as direct malaria-attributable mortality [15]. For comparison with trial data, predicted direct and indirect malaria mortality reductions were converted into all-cause under-5 mortal-ity reductions and an overall malaria-related mortalmortal-ity reduction applying the one-cause-one-death framework and calculation proposed by the UN Child Epidemiology Reference Group [10, 11] (Additional file 3).
Results
Statistical models: internal validity
Statistical impact functions fitted OpenMalaria simula-tions reasonably well, with the proportion of explained variation (adjusted R2, in the logit scale) ranging 94–97 % for PfPR and 86–97 % for case incidence across the three time horizons and age groups (Additional file 2). R2s were 74–95 % for malaria mortality, a slightly less good fit, likely reflecting stochastic noise in the simulations asso-ciated with small numbers of deaths. For each outcome, R2s were similar across the three horizons, but generally higher for younger age groups (where larger numbers of burden events reduced stochastic noise).
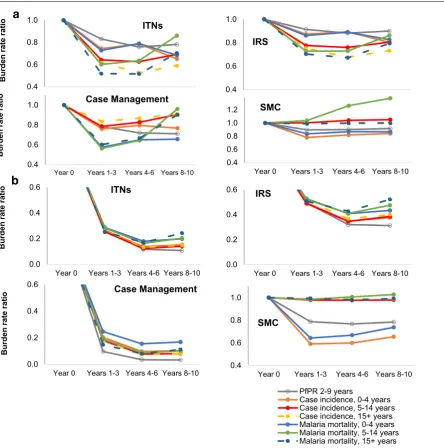
Statistical models: epidemiological patterns
reductions across the four interventions was stable across hypothetical Admin1 units that differ in baseline ende-micity and seasonality (Fig. 1).
Proportional burden reductions were larger at lower baseline PfPR (red lines in Figs. 1, 2) and, within low-endemic settings, larger at lower seasonality (solid red lines in Fig. 1). An exception is SMC, for which (as expected) proportional impacts were always larger under high seasonality, at both low and high baseline
PfPR.
Proportional burden reductions were typically slightly larger for parasite prevalence and case incidence than for malaria mortality (Fig. 2).
Across interventions, the maximum impact (lowest burden rate ratios) were generally achieved 4–6 years after reaching target coverage levels, with some partial rebounds over years 7–9, notably for mortality in children 5–14 years of age, due to reduced acquired immunity. For the simulated one-off coverage increases implemented instantaneously and then sustained, 70–90 % of long-term impacts were reached within the 1–3 year horizon (Fig. 2).
Across age groups, the proportional burden reductions achieved by ITNs, IRS and CM were similar at 1–6 years after scale-up, although at 7–9 years after scale-up the mortality reductions were slightly less in older age groups.
SMC, in contrast, reduced burdens of PfPR, case inci-dence and mortality only in the targeted age group of 0–4 year olds, and slightly increased mortality for 5–14 year olds starting from years 4–6 after scale-up onward, reflecting reduced acquired immunity among the cohort of children who received SMC at age 0–4 years. Impacts of SMC were highest in areas with high malaria seasonality (dashed lines in Fig. 1d), but also considerable in areas with non-seasonal malaria (solid lines in Fig. 1d).
For CM and especially ITNs (the interventions with the largest impact), the proportional burden reduc-tion for a given coverage percentage increase started to gradually diminish with increasing coverage, noticeably from a coverage of about 40 % (Fig. 1). In contrast, SMC impacts, which were smaller, increased linearly through-out the coverage increase. IRS impacts were near-linear
0.2 0.4 0.6 0.8 1.0
0% 20% 40% 60% 80%
,oi
tar
et
ar
ec
ne
dic
ni
es
a
C
NTI
%0
ot
de
ra
p
mo
c
co
ve
rage
ITN coverage, 2016-2018
0.2 0.4 0.6 0.8 1.0
0% 20% 40% 60% 80%
Case
in
cidence
rate ratio,
compared to 0% IRS
co
ve
rage
IRS coverage, 2016-2018
Admin1 A: PfPR 71%, high seasonal Admin1 B: PfPR 82%, low seasonal Admin1 C: PfPR 0.3%, high seasonal Admin1 D: PfPR 11%, low seasonal
0.2 0.4 0.6 0.8 1.0
0% 20% 40% 60% 80%
,oi
tar
et
ar
ec
ne
dic
ni
es
a
C
M
C
%0
ot
der
ap
mo
c
cov
erage
Case Management coverage, 2016-2018
0.2 0.4 0.6 0.8 1.0
0% 20% 40% 60% 80%
Case
in
cidence
rate ratio,
compared to 0% SMC
cov
erage
SMC coverage, 2016-2018
a
d
b
c
Fig. 1 Proportional reductions in malaria case incidence in 0–4-year-olds, 1–3 years after intervention scale-up. a ITNs, b IRS, c case
[image:6.595.55.542.87.383.2]with coverage as well, which may, however, be an arti-fact of the regression being based on only two simulated extreme coverage levels.
When combining CM and ITNs, their overall impact was slightly larger than the sum of the individual inter-ventions for settings with high baseline endemicity (Fig. 3), reflecting that proportional burden reductions increase with decreasing endemicity (Fig. 1), and com-bined interventions more powerfully reduce endemic-ity from high baseline endemicendemic-ity. For settings with low baseline endemicity, in contrast, the proportional impact
of either intervention did not vary with the coverage level of the other intervention.
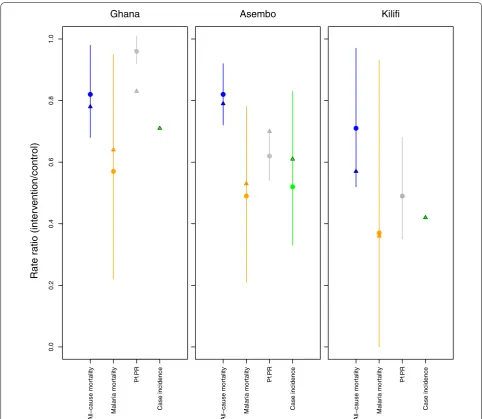
External validity: predicted impacts against ITN trial data Predicted proportional burden reductions in the ITN tri-als were generally comparable to those observed, with the largest proportional reductions for malaria mortality, followed by case incidence, and lesser reductions in PfPR and all-cause post-neonatal under-5 mortality (Fig. 4; Additional file 3). In line with trial results, impacts were generally largest in Kilifi, followed by Asembo and 0.4
0.6 0.8 1.0
2014 base 2015-2017 2018-2020 2022-2024
oi
tar
et
ar
ne
dr
u
B
ITNs
PfPR 2-9 years
Case incidence, 0-4 years Case incidence, 5-14 years Case incidence, 15+ years Malaria mortality, 0-4 years Malaria mortality, 5-14 years Malaria mortality, 15+ years
0.4 0.6 0.8 1.0
2014 base 2015-2017 2018-2020 2022-2024
IRS
PfPR 2-9 years
Case incidence, 0-4 years Case incidence, 5-14 years Case incidence, 15+ years Malaria mortality, 0-4 years Malaria mortality, 5-14 years Malaria mortality, 15+ years 0.4
0.6 0.8 1.0
Year 0 Years 1-3 Years 4-6 Years 8-10
oi
tar
et
ar
ne
dr
u
B
Case Management
0.4 0.6 0.8 1.0 1.2
Year 0 Years 1-3 Years 4-6 Years 8-10
SMC
PfPR 2-9 years
Case incidence, 0-4 years Case incidence, 5-14 years Case incidence, 15+ years Malaria mortality, 0-4 years Malaria mortality, 5-14 years Malaria mortality, 15+ years 0.0
0.2 0.4 0.6
Year 0 Years 1-3 Years 4-6 Years 8-10
oi
tar
et
ar
ne
dr
u
B
ITNs
PfPR 2-9 years
Case incidence, 0-4 years Case incidence, 5-14 years Case incidence, 15+ years Malaria mortality, 0-4 years Malaria mortality, 5-14 years Malaria mortality, 15+ years
0.0 0.2 0.4 0.6
Year 0 Years 1-3 Years 4-6 Years 8-10
IRS
PfPR 2-9 years
Case incidence, 0-4 years Case incidence, 5-14 years Case incidence, 15+ years Malaria mortality, 0-4 years Malaria mortality, 5-14 years Malaria mortality, 15+ years 0.0
0.2 0.4 0.6
Year 0 Years 1-3 Years 4-6 Years 8-10
oi
tar
et
ar
ne
dr
u
B
Case Management
0.4 0.6 0.8 1.0
Year 0 Years 1-3 Years 4-6 Years 8-10
SMC
PfPR 2-9 years
Case incidence, 0-4 years Case incidence, 5-14 years Case incidence, 15+ years Malaria mortality, 0-4 years Malaria mortality, 5-14 years Malaria mortality, 15+ years
b
a
Fig. 2 Impact of up scaling coverage from 0 to 60 % for Admin1 units with a high; b low PfPR. Estimates from statistical models, as averages for
[image:7.595.91.536.87.536.2]Ghana, reflecting the ranking of the sites in baseline endemicity i.e. PfPR (lowest in Kilifi, highest in Ghana). For nine of the ten health outcomes that could be evalu-ated across the three trials, the model-predicted relative risk was within the 95 % confidence interval (CI) of the observed data (Fig. 4). Simulations agreed with the tri-als in that PfPR in Ghana had the smallest proportional reduction of all outcomes across the three trials, but the model-predicted reduction of 17 % in this outcome was outside the 95 % CI of the observed reduction (a point estimate of only 4 %).
Sensitivity analysis
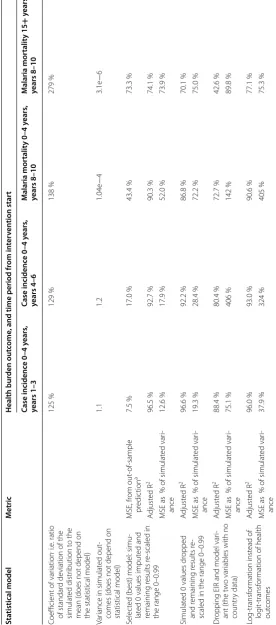
In out-of-sample predictions, regression models for health outcomes that had smaller simulated values, and thus more simulated zero outcomes (e.g. mortality in 15–99 years), generally gave higher MSE, higher ratio of MSE to variance, and lower R2.
Alternative regression models with outcome variables that dropped instead of imputed zero values, or that applied log instead of logit transformation on simulated outcomes, or that dropped the OpenMalaria model vari-ant and simulated EIR as predictor variables, generally
had lower R2 and higher MSE-to-variance ratios than the selected best models (Table 2).
Nevertheless, across all alternative statistical models explored, the ranking of proportional burden reductions between interventions (for a given population coverage), between age groups, between health outcomes, between hypothetical Admin1 areas, and over time horizons was unchanged compared to the selected best model (Addi-tional file 4). Excluding data with zero values made little difference to predicted risk ratios, with risk ratios vary-ing between −6 and +2 % (median <0.0000 %) relative to the selected best model. Dropping EIR and Model Vari-ant as predictor variables caused larger differences, with risk ratios varying −26 to +17 % (median −5 %) from the selected best model. The method of transformation had the largest influence, with risk ratios varying −51 to +17 % (median −6 %) from the selected best model.
Discussion Methodology
This analysis shows that micro-simulations of complex patterns of health impacts following scale-up of malaria control in endemic African settings can be emulated by
0.20 0.40 0.60 0.80 1.00
0% 20% 40% 60%
,
oit
ar
et
ar
ec
ne
dic
ni
es
a
C
NTI
%0
ot
d
er
ap
mo
c
Pf
PR
)
h
gi
h(
eg
ar
ev
oc
ITN coverage (scale-up) Case Management coverage 60% Case Management coverage 30% Case Management coverage 10% Case Management coverage 0%
0.20 0.40 0.60 0.80 1.00
0% 20% 40% 60%
Case
in
cidence
rate ratio,
compared to 0% CM cove
rage (high
Pf
PR
)
Case Management coverage
ITN coverage 60% ITN coverage 30% ITN coverage 10% ITN coverage 0%
0.20 0.40 0.60 0.80 1.00
0% 20% 40% 60%
,
oit
ar
et
ar
ec
ne
dic
ni
es
a
C
NTI
%0
ot
der
ap
mo
c
Pf
PR
)
wol
( e
gar
ev
oc
ITN coverage
Case Management coverage 60% Case Management coverage 30% Case Management coverage 10% Case Management coverage 0%
0.20 0.40 0.60 0.80 1.00
0% 20% 40% 60%
Case incidence rate ratio, compared to 0% CM coverage (low
Pf
PR
)
Case Management coverage
ITN coverage 60% ITN coverage 30% ITN coverage 10% ITN coverage 0%
Fig. 3 Proportional reductions in case incidence in 0–4-year-olds 8–10 years following ITN and/or CM scale-up. Estimated by statistical models,
[image:8.595.60.539.88.372.2]fitting fairly simple regression models to the simulated outputs. The emulations can use data on malaria ende-micity and baseline intervention coverage to project the impact of alternative scale-up strategies for specific locations.
The high explanatory power of regressions attests to good internal validity against OpenMalaria simulations (Table 2; Additional file 2). The somewhat lower R2s for mortality outcomes may be explained by random noise in simulation results for mortality, since deaths are much rarer than positive infection status or cases. The impu-tation (or dropping) of zero simulation outcomes, the (logit) transformations applied to all outcomes before
regression modelling, the re-scaling of health outcomes which did not naturally fall in the range 0–1 in order to allow logit transformation, and the implementation of predictor variables simulated in discrete steps as con-tinuous in the regression (needed for predictions for a range of provinces) may have led to sub-optimally speci-fied models. However, external and internal validities suggested that the potential bias introduced by this is minimal.
Added value for programme planning projection tools The impact functions thus developed for the Spectrum programme planning tool considerably improve on ●
●
●
0.0
0.2
0.4
0.6
0.
81
.0
Rate ratio (inter
vention/control)
All−cause mo
rt
alit
y
Malar
ia mor
talit
y
Pf
PR
Case incidenc
e
Ghana
●
●
●
●
All−cause mo
rt
alit
y
Malar
ia mor
talit
y
Pf
PR
Case incidenc
e
Asembo
●
●
●
All−cause mo
rt
alit
y
Malar
ia mor
talit
y
Pf
PR
Case incidenc
e
Kilifi
Fig. 4 ITN impact on malaria outcomes: comparison between ITN trial observations and statistical model predictions. For calculation details and
[image:9.595.56.539.86.505.2]Table 2 S ta tistic al p er formanc e of selec ted and alt erna tiv e sta tistic al impac t pr edic tion mo dels
a A
ver
age of 25 simula
tions in which sub
-samples of 100,000 simula
tions w er e r andomly dr awn t o tr
ain and selec
t the sta
tistical model
, and each time the r
emaining 65,888 simula
tions w
er
e used t
o assess its MSE
Sta tistical model M etric Health bur den out come
, and time period fr
om in ter ven tion star t Case incidenc e 0–4 y ears , years 1–3 Case incidenc e 0–4 y ears , years 4–6 M alaria mor talit y 0–4 y ears , years 8–10 M alaria mor talit y 15 + y ears , years 8–10
Coefficient of var
iation
, i.e
. ratio
of standar
d de
viation of the
simulat
ed distr
ibution t
o the
mean (
does not depend on
the statistical model)
125 % 129 % 138 % 279 % Var
iance in simulat
ed out
-comes (
does not depend on
statistical model) 1.1 1.2 1.04e − 4 3.1e − 6 Selec
ted (best) model: simu
-lat
ed 0 values imput
ed and
remaining r
esults r
e-scaled in
the range 0–0.99
MSE, fr om out -of-sample pr edic tion a 7.5 % 17.0 % 43.4 % 73.3 % A djust ed R 2 96.5 % 92.7 % 90.3 % 74.1 % MSE as
% of simulat
ed var i-ance 12.6 % 17.9 % 52.0 % 73.9 % Simulat
ed 0 values dr
opped
and r
emaining r
esults r
e-scaled in the range 0–0.99
A djust ed R 2 96.6 % 92.2 % 86.8 % 70.1 % MSE as
% of simulat
ed var i-ance 19.3 % 28.4 % 72.2 % 75.0 % Dr
opping EIR and model var
i-ant (the t
w
o var
iables with no
countr y data) A djust ed R 2 88.4 % 80.4 % 72.7 % 42.6 % MSE as
% of simulat
ed var i-ance 75.1 % 406 % 142 % 89.8 % Log-transf or mation inst ead of log it-transf or
mation of health
out comes A djust ed R 2 96.0 % 93.0 % 90.6 % 77.1 % MSE as
% of simulat
[image:10.595.159.436.98.725.2]earlier malaria planning tools (notably the LiST child survival model), by: (i) predicting morbidity reductions, which accrue faster and are in the long term proportion-ally larger than mortality reductions; (ii) simulating dif-ferent age groups, with proportional burden reductions in adults not much less than in young children; (iii) cap-turing variations in impacts over time, including partial rebounds. These rebounds result from the achieved ende-micity reductions and consequent declines in acquired immunity, and become apparent from around 7 years after scale-up, in particular for mortality for people older than 5 years, as previously described in dynamic simula-tion studies of ITNs and SMC scale-up [23, 37, 38].
The incorporation of dependence of health impacts on baseline endemicity is another improvement. Modeled burden reductions are proportionally larger in settings with lower baseline malaria infection prevalence rates, and less seasonality in malaria transmission. This is con-sistent with observations from ITN trials [33] (Fig. 4) and with models of the dynamics induced by various malaria interventions [27, 39–41]. The absolute health gains— in terms of cases and deaths averted for a given cover-age increase—are generally larger for higher-endemic settings, due to the larger baseline burden compared to lower-endemic settings. Existing programme planning tools, in contrast, have typically assumed fixed burden reductions at any time after intervention scale-up, in all countries and areas of Africa irrespective of endemicity.
Furthermore, the regression models capture non-lin-earity in the incremental health impact from progres-sive coverage increases, with some degree of saturation (diminishing returns) at high coverage levels. They also capture the synergy apparent in dynamic modelling stud-ies [17] of higher-endemic settings between impacts of CM and ITNs.
Consistent with dynamic model-based assessments [30], impacts for a given population effective coverage level are larger for CM than for ITNs and IRS. However, it is often easier to achieve high-level coverage for vec-tor control interventions (often delivered through verti-cal programmes, as campaigns) than for effective CM (through complex multi-layer health systems), so this ranking does not imply that CM is necessarily a better investment than vector control. The Spectrum-Malaria programme planning tool, by linking the current statis-tical effectiveness predictions with its costing module OneHealth Tool, will enable evaluation of both impacts and costs of malaria interventions and their trade-offs in short- and longer-term.
The models did not consider age differences in ITN and CM coverage, but these are likely to have only second-ary effects since the burden reductions are partly driven by transmission effects which depend—especially in the
longer term—mainly on average population-wide cover-age and not just the covercover-age in people directly accessing the intervention.
There remains a need to refine these impact func-tions to incorporate drug and insecticide resistance, and extend them to impacts on Plasmodium species other than P. falciparum, such as P. vivax malaria (for countries with high prevalence of this species), which has very dif-ferent dynamics from P. falciparum [42].
Consistency with effectiveness data
These predictions of vector control impacts were gener-ally consistent with best available data, as also used by WHO, the Roll Back Malaria partnership and interna-tional malaria donors [4, 34–36]. In particular, the pre-dicted proportional burden reductions in young children following ITN scale-up were generally in line with those observed in cluster-randomized trials and other field studies and evaluations.
Also, the statistical predictions were consistent with recent ecological estimates of average ITN field impacts across sub-Saharan Africa based on synthesis of cli-matic, entomological, epidemiological and programmatic data across Africa, including larger proportional burden reductions at lower baseline PfPR [2]. For malaria-related mortality in under five-year old children, the predicted 36–64 % reduction within 2 years for settings resembling the ITN trials in Kenya and Ghana, is similar to the esti-mate used in the LiST model of child survival of a fixed 55 at 100 % household ITN ownership (irrespective of endemicity or seasonality) [10, 11]. Predicted longer-term impacts were somewhat higher than the LiST time-fixed 55 % reduction, which reflects additional long-term transmission dynamic effects.
The external validation against trial data is complicated by imprecision and measurement challenges in ITN trial data: (i) The observed case incidences vary and are poten-tially biased across the trials by intensity of active case surveillance and treatment access, and the parasite den-sity threshold used in case definition. (ii) The infection
prevalence reductions depend strongly on
malaria-related deaths, but not other-cause deaths, and extrapolations from OpenMalaria predicted direct and indirect mortality reductions to either all-cause under-5 or reductions in malaria-attributable mortality involved some uncertain assumptions (Additional file 3).
The ITN and IRS type and effectiveness modelled were judged the most relevant generic representation of ITN and IRS as recommended for African programmes [44, 45]. The relative efficacies of ITNs and IRS reflect measurements from experimental hut studies using the insecticide Actellic CS recommended by the WHO’s Pes-ticide Evaluation Scheme for African programmes (for settings with mosquitoes fully susceptible to the insecti-cides used [18, 46]). These data drive the typically larger proportional burden reductions for ITNs than for IRS, which align with the recommendation of the WHO 2015 Global Technical Strategy to prioritize ITNs for vector control. However, absolute and relative effectiveness of ITN and IRS will vary among settings depending on local insecticide product choice (with the duration of protec-tion sometimes less than the assumed 12 months), and site-specific insecticide resistance and ITN decay and usage and adherence patterns [47]. Current simulations and statistical functions did not capture these features, although they can be simulated in OpenMalaria through reduced effects on mosquito survival, and extent of per-sonal protection [18]. There is also variation across Africa in the tendency of vector species to bite humans and to bite indoors. Highest ITN and IRS effectiveness and impact are expected in settings where highly anthropo-philic (human biting) and indoor biting mosquitos (e.g.
Anopheles gambiae, more so than Anopheles arabiensis)
are responsible for most of the transmission.
For SMC, based on seven relevant trials in highly sea-sonal settings, the WHO has estimated a 75 % reduction in malaria case incidence, and considerable child mortal-ity reduction within the year of implementation, but with unknown longer-term impacts [21]. The external valid-ity of model results for SMC, therefore, remains to be assessed following future programme evaluations upon large-scale, long-term implementation.
The authors are not aware of any field studies of the effect of prompt and effective treatment of uncompli-cated disease on incidence of severe malaria and mortal-ity. Correspondingly, the models of the impact of scale-up of CM on burden are highly uncertain in OpenMalaria. Projections of impacts of scale-up of CM at country level face further uncertainty in estimates of effective cover-age of treatment, which are typically available only from caregiver’s recall of treatment of febrile children under 5 years of age without stratification between malarial and non-malarial fevers, and without clear distinction of inef-fective and efinef-fective treatment regimens [48, 49].
Conclusions
In conclusion, predictions of health improvements fol-lowing scale-up of malaria control interventions in varying P. falciparum-endemic areas in Africa, from computationally expensive transmission dynamic els, can to a large extent be emulated by regression mod-els. The regression models developed in this study can be used to improve the simplistic effectiveness assumptions currently used in malaria programme planning and eval-uation tools, despite substantial remaining uncertainties in the dynamic models underpinning the predictions.
Abbreviations
AIC: Akaike’s information criterion; CM: effective case management; CV: coef-ficient of variation; EIR: entomological inoculation rate; GLM: generalized linear model(s); IRS: indoor residual spraying; ITN: insecticide-treated mosquito net; LiST: lives saved tool (=child survival/mortality impact model); MAP: malaria atlas project; MSE: mean squared error; PfPR: prevalence of Plasmodium falciparum parasite infection; SMC: seasonal malaria chemoprophylaxis; WHO: World Health Organization.
Authors’ contributions
EK, TAS and OJTB designed the study. GM, OJTB and EK implemented the analysis. CP and TAS advised on statistical methods. RC advised the design, interpretation and validation of malaria interventions. MH and RC compiled WHO and MAP data informing distributions of malaria endemicity. EK wrote the paper. All authors contributed to interpretation and final manuscript. All authors read and approved the final manuscript.
Author details
1 Avenir Health, Geneva, Switzerland. 2 Avenir Health, Glastonbury, USA. 3 World Health Organization Global Malaria Programme, Geneva, Switzerland. 4 World Health Organization Health Systems Governance and Financing dept., Geneva, Switzerland. 5 Swiss Tropical and Public Health Institute, Basel, Switzer-land. 6 University of Basel, Basel, Switzerland.
Acknowledgements
The views expressed in this paper are those of the authors and do not neces-sarily represent the position of Avenir Health, the Swiss Tropical and Public Health Institute or the World Health Organization. We thank Ewan Cameron (Oxford University, Malaria Atlas Project) for advice regarding malaria endemic-ity distributions and indicators. We thank Shufang Zhang (the Global Fund to Fight AIDS, Tuberculosis and Malaria), John Stover and Rachel Sanders (Avenir Health) for advising the modelling requirements for strategic planning projec-tion tools and for project oversight. OpenMalaria simulaprojec-tions were performed at sciCORE (http://www.scicore.unibas.ch/) scientific computing core facility at University of Basel.
Competing interests
The authors declare that they have no competing interests. Additional files
Additional file 1. Regression models of OpenMalaria-simulated malaria intervention impacts: predictor variable coefficients, with p values, and adjusted R2s.
Additional file 2. Coefficients and p values of OpenMalaria-based statis-tical impact functions.
Additional file 3. Simulation input assumptions and calculations on statistically predicted burden reductions for ITN trials.
Availability of data and materials
The datasets supporting the conclusions of this article are included within the article, its additional files, and the referenced publicly accessible studies.
Funding
Avenir Health’s contribution was supported by grants from the Global Fund to fight AIDS, Tuberculosis and Malaria; Swiss Tropical and Public Health Institute’s contribution was supported by a grant from the World Health Organization’s Health Systems Governance and Financing department.
Received: 7 May 2016 Accepted: 29 July 2016
References
1. WHO. World malaria report 2015. Geneva: World Health Organization; 2015.
2. Bhatt S, Weiss DJ, Cameron E, Bisanzio D, Mappin B, Dalrymple U, et al. The effect of malaria control on Plasmodium falciparum in Africa between 2000 and 2015. Nature. 2015;526:207–11.
3. WHO. Global technical strategy for malaria 2016–2030. Geneva: World Health Organization; 2015.
4. Korenromp EL, Hosseini M, Newman RD, Cibulskis RE. Progress towards malaria control targets in relation to national malaria programme fund-ing. Malar J. 2013;12:18.
5. Stover J, Ross J. How increased contraceptive use has reduced maternal mortality. Matern Child Health J. 2010;14:687–95.
6. Stover J, Johnson P, Zaba B, Zwahlen M, Dabis F, Ekpini RE. The Spectrum projection package: improvements in estimating mortality, ART needs, PMTCT impact and uncertainty bounds. Sex Transm Infect. 2008;84(Suppl 1):i24–30.
7. Stover J, McKinnon R, Winfrey B. Spectrum: a model platform for linking maternal and child survival interventions with AIDS, family planning and demographic projections. Int J Epidemiol. 2010;39(suppl 1):i7–10. 8. Houben RM, Lalli M, Sumner T, Hamilton M, Pedrazzoli D, Bonsu F, et al.
TIME impact—a new user-friendly tuberculosis (TB) model to inform TB policy decisions. BMC Med. 2016;14:56.
9. Johns Hopkins University—Bloomberg School of Public Health: LiST (Lives Saved Tool). An evidence-based decision-making tool for estimat-ing intervention impact. Baltimore; 2010.
10. Eisele T, Larsen DA, Walker N, Cibulskis R, Yukich JO, Zikusooka CM, et al. Estimates of child deaths prevented from malaria prevention scale-up in Africa 2001–2010. Malar J. 2012;11:93.
11. Eisele TP, Larsen D, Steketee R. Protective efficacy of interventions for pre-venting malaria mortality in children in Plasmodium falciparum endemic areas/modeling the impact of scaling up interventions for malaria. Int J Epidemiol. 2010;39(Suppl. 1):i88–101.
12. Smith T, Ross A, Maire N, Rogier C, Trape JF, Molineaux L. An epidemio-logic model of the incidence of acute illness in Plasmodium falciparum
malaria. Am J Trop Med Hyg. 2006;75(2 Suppl):56–62.
13. Smith T, Ross A, Maire N, Chitnis N, Studer A, Hardy D, et al. Ensemble modeling of the likely public health impact of a pre-erythrocytic malaria vaccine. PLoS Med. 2012;9:e1001157.
14. Tediosi F, Maire N, Smith T, Hutton G, Utzinger J, Ross A, et al. An approach to model the costs and effects of case management of Plasmodium falciparum malaria in sub-saharan Africa. Am J Trop Med Hyg. 2006;75(2 Suppl):90–103.
15. Ross A, Maire N, Molineaux L, Smith T. An epidemiologic model of severe morbidity and mortality caused by Plasmodium falciparum. Am J Trop Med Hyg. 2006;75(2 Suppl):63–73.
16. World Health Organization, Pesticide Evaluation Scheme (WHOPES). Pes-ticides and their application for the control of vectors and pests of public health importance. 16th ed. Geneva; 2006.
17. Briët OJ, Penny MA. Repeated mass distributions and continuous distribu-tion of long-lasting insecticidal nets: modelling sustainability of health benefits from mosquito nets, depending on case management. Malar J. 2013;12:401.
18. Briet OJ, Penny MA, Hardy D, Awolola TS, Van Bortel W, Corbel V, et al. Effects of pyrethroid resistance on the cost effectiveness of a mass distribution of long-lasting insecticidal nets: a modelling study. Malar J. 2013;12:77.
19. Russell TL, Govella NJ, Azizi S, Drakeley CJ, Kachur SP, Killeen GF. Increased proportions of outdoor feeding among residual malaria vector popula-tions following increased use of insecticide-treated nets in rural Tanzania. Malar J. 2011;10:80.
20. Briet OJ, Chitnis N. Effects of changing mosquito host searching behav-iour on the cost effectiveness of a mass distribution of long-lasting, insecticidal nets: a modelling study. Malar J. 2013;12:215.
21. WHO. Policy recommendation: seasonal malaria chemoprevention (SMC) for Plasmodium falciparum malaria control in highly seasonal transmission areas of the Sahel sub-region in Africa. Geneva: World Health Organiza-tion; 2012.
22. Cairns M, Roca-Feltrer A, Garske T, Wilson AL, Diallo D, Milligan PJ, et al. Estimating the potential public health impact of seasonal malaria chemo-prevention in African children. Nat Commun. 2012;3:881.
23. Pemberton-Ross P, Smith TA, Hodel EM, Kay K, Penny MA. Age-shifting in malaria incidence as a result of induced immunological deficit: a simula-tion study. Malar J. 2015;14:287.
24. Maire N, Tediosi F, Ross A, Smith T. Predictions of the epidemiologic impact of introducing a pre-erythrocytic vaccine into the expanded program on immunization in sub-Saharan Africa. Am J Trop Med Hyg. 2006;75(2 Suppl):111–8.
25. Penny MA, Verity R, Bever CA, Sauboin C, Galactionova K, Flasche S, et al. Public health impact and cost-effectiveness of the RTS, S/AS01 malaria vaccine: a systematic comparison of predictions from four mathematical models. Lancet. 2016;387(10016):367–75.
26. OpenMalaria. https://github.com/SwissTPH/OpenMalaria/wiki. Accessed 16 Aug 2016.
27. Stuckey EM, Smith T, Chitnis N. Seasonally dependent relation-ships between indicators of malaria transmission and disease provided by mathematical model simulations. PLoS Comput Biol. 2014;10(9):e1003812.
28. Cameron E, Battle KE, Bhatt S, Weiss DJ, Bisanzio D, Mappin B, et al. Defin-ing the relationship between infection prevalence and clinical incidence of Plasmodiumfalciparum malaria. Nature Commun. 2015;6:8170. 29. Penny M, Maire N, Bever C, Pemberton-Ross P, Briët OJT, Smith DL, et al.
Distribution of malaria exposure in endemic countries in Africa consider-ing country levels of effective treatment. Malar J. 2015;14:384. 30. Griffin JT, Bhatt S, Sinka ME, Gething PW, Lynch M, Patouillard E, et al.
Potential for reduction of burden and local elimination of malaria by reducing Plasmodium falciparum malaria transmission: a mathematical modelling study. Lancet Infect Dis. 2016;16:465–72.
31. Akaike H. A new look at the statistical model identification. IEEE Trans Autom Control. 1974;19:716–23.
32. R: a language and environment for statistical computing. R Foundation for Statistical Computing. http://www.R-project.org/. Accessed 16 Aug 2016. 33. Lengeler C. Insecticide-treated bed nets and curtains for preventing
malaria. Cochrane Database Syst Rev. 2004;2:CD000363. 34. Komatsu R, Low-Beer D, Schwartlander B. Global fund-supported
programmes contribution to international targets and the millen-nium development goals: an initial analysis. Bull World Health Organ. 2007;85:805–11.
35. WHO. World malaria report 2014. Geneva: World Health Organization; 2014.
36. Korenromp EL. Lives saved from malaria prevention in Africa—evidence to sustain cost-effective gains. Malar J. 2012;11:94.
37. Smith T, Hii JL, Genton B, Muller I, Booth M, Gibson N, et al. Associations of peak shifts in age–prevalence for human malarias with bednet coverage. Trans R Soc Trop Med Hyg. 2001;95:1–6.
38. Griffin JT, Ferguson NM, Ghani AC. Estimates of the changing age-burden of Plasmodium falciparum malaria disease in sub-Saharan Africa. Nat Commun. 2014;5:3136.
• We accept pre-submission inquiries
• Our selector tool helps you to find the most relevant journal
• We provide round the clock customer support
• Convenient online submission
• Thorough peer review
• Inclusion in PubMed and all major indexing services
• Maximum visibility for your research
Submit your manuscript at www.biomedcentral.com/submit
Submit your next manuscript to BioMed Central
and we will help you at every step:
40. Okell LC, Drakeley CJ, Bousema T, Whitty CJ, Ghani AC. Modelling the impact of artemisinin combination therapy and long-acting treatments on malaria transmission intensity. PLoS Med. 2008;5:e226 (discussion
e226).
41. Penny MA, Galactionova K, Tarantino M, Tanner M, Smith TA. The public health impact of malaria vaccine RTS, S in malaria endemic Africa: country-specific predictions using 18 month follow-up Phase III data and simulation models. BMC Med. 2015;13:170.
42. Hetzel MW, Pulford J, Timbi D, Koimbu G, Barnadas C, Siba PM et al. Dynamic changes in prevalence and incidence of malaria after intensify-ing control across Papua New Guinea. In: Sons JW editor. 9th European congress on tropical medicine and international health. vol. 20. Basel. 43. Ross A, Smith T. Interpreting malaria age-prevalence and incidence
curves: a simulation study of the effects of different types of heterogene-ity. Malar J. 2010;9:132.
44. WHO recommended insecticides for indoor residual spraying against malaria vectors. http://www.who.int/entity/whopes/Insecticides_IRS_2_ March_2015.pdf?ua=1. Accessed 16 Aug 2016.
45. WHO recommended long-lasting insecticidal nets. http://www.who. int/entity/whopes/Longlasting_insecticidal_nets_September_2015. pdf?ua=1. Accessed 16 Aug 2016.
46. Tchicaya ES, Nsanzabana C, Smith TA, Donze J, de Hipsl ML, Tano Y, et al. Micro-encapsulated pirimiphos-methyl shows high insecticidal efficacy and long residual activity against pyrethroid-resistant malaria vectors in central Cote d’Ivoire. Malar J. 2014;13:332.
47. Bhatt S, Weiss DJ, Mappin B, Dalrymple U, Cameron E, Bisanzio D, et al. Coverage and system efficiencies of insecticide-treated nets in Africa from 2000 to 2017. ELife. 2015;4:e09672.
48. Galactionova K, Tediosi F, De Savigny D, Smith TA, Tanner M. Effective coverage and systems effectiveness for malaria case management in sub-Saharan African countries. PLoS One. 2015;10:e0127818. 49. Eisele TP, Silumbe K, Yukich J, Hamainza B, Keating J, Bennett A, et al.