Rochester Institute of Technology
RIT Scholar Works
Theses
Thesis/Dissertation Collections
10-1-1993
Infrared symbolic scene comparator
Thomas G. Servoss
Follow this and additional works at:
http://scholarworks.rit.edu/theses
This Thesis is brought to you for free and open access by the Thesis/Dissertation Collections at RIT Scholar Works. It has been accepted for inclusion in Theses by an authorized administrator of RIT Scholar Works. For more information, please contactritscholarworks@rit.edu.
Recommended Citation
Infrared Symbolic Scene Comparator
By
Thomas G. Servoss
A thesis submitted in partial fulfillment
of the requirements for the degree of
Master of Science in the Center for
Imaging Science in the College of
Imaging Arts and Sciences of the
Rochester Institute of Technology
October 1993
Signature of Author: Thomas G. Servoss
COLLEGE OF IMAGING ARTS AND SCIENCES
ROCHESTER INSTITUTE OF TECHNOLOGY
ROCHESTER, NEW YORK
CERTIFICATE OF APPROVAL
M. S.
DEGREE THESIS
The M.S. Degree Thesis of Thomas G. Servoss
has been examined and approved
by the thesis committee as satisfactory
for the thesis requirement for the
Master of Science degree
Dr. John R. Schott
Thesis Advisor
Dr. Roger Easton
Mr.
Carl Salvaggio
Mr. Rolando Raqueno
THESIS RELEASE PERMISSION FORM
ROCHESTER INSTITUTE OF TECHNOLOGY
COLLEGE OF IMAGING ARTS AND SCIENCES
Title of
Thesis: Infrared Symbolic Scene Comparator
Acknowledgments
I
wouldlike
to thank thefollowing
people:Steve
Schultz
Gus
Braun
Donna Rankin
This
project would nothave
been
completedif
it
weren'tfor
thetremendous
contributions madeby
these three people.Their
contributions are too numerous to mention
here,
but
they
know
how
they
have helped.
I
also want to thankDr. John
Schott
for
giving
me theopportunity
to
finish my
education.If
he
hadn't
invited
me toapply
to graduateDedication
This
write-up,and
the
six years of workleading
up
toits
completion,is dedicated
tomy family:
My
motherSandra,
My
father
Delmar,
My
"brother"James,
My
sisterKathrin,
My
nephewKevin,
(who
I
hope has
even more opportunitiesto excelthanI
have
had)
and
My
future
wifeElizabeth,
Table
of
Contents
Table
ofContents
viTable
ofFigures
viiiTable
ofTables
xAbstract
xi1.0 Introduction
1
2.0
Background Literature Review
3
3.0 Approach
12
3.1
Scientific
Theory
123.2
Sub-system Descriptions
16
3.2.1
Symbolic Scene Creation
16
3.2.2
Weather Initialization
18
3.2.3
Temperature
Prediction
20
3.2.4
Calibration
224.0
Results
:28
4.1
SSC Module
Descriptions
28
4.1.1 Weather-Manipulation
Modules
29
4.1.1.1
Read
Weather
30
4.1
.1.2Write Weather
30
4.1
.1.3Build Weather
31
4.1.1.4
Edit Weather
314. 1
.2Scene-Manipulation
Modules
324.1.2.1
Read
Scene
33
4.1
.2.2Write
Scene
33
4.1.2.3
Select Tile
344.1.2.4
Compose
Tile
34
4.1
.2.5Produce
Scene
35
4.1.3 Calibration Manipulation
Modules
36
4.1.3.1
Calibrate
36
4.1.3.2
Load Image
37
4.1
.3.3Read
Translation
38
4.1.3.4
Show Final
38
4.1.3.5
Write
Final
39
4.
1
.3.6Write
Translation40
4.2
SSC
Analysis
ofPerformance
41
4.2.1 Analysis Methods
47
5.0
Conclusions
and Recommendations 678.0
References
70
7.0 Appendices
72
A.
Database File
Formats
72Table
of
Figures
Fig. 2.1
Example layout
of anSSC
session 1 1Fig. 3.1
.1Many
factors
that contributeto the sensed radiancefrom
an
infrared
scene12
Fig.
3.2.1An
example symbolic scenefrom
the scene creationsub-system
17
Fig. 3.2.2
Frame-by-frame
weather parameterediting
session 19
Fig. 3.2.3 A
typicalsurface-leaving
radiance todigital
countcalibration curve
26
Fig.
4.1
.1A
representation ofthefinal
SSC
System Network
using
AVS[1990]
as a software platform29
Fig. 4.1
.2Read Weather
Module
r30
Fig. 4.1.3
Write
Weather Module
30
Fig. 4.1.4 Build Weather Module
31Fig. 4.1
.5Edit
Weather Module
31
Fig. 4.1
.6Steps
depicting
atypicalEdit Weather
session 32Fig. 4.1.7 Read
Scene
Module
33
Fig. 4.1.8
Write
Scene Module
33
Fig. 4.1.9
Select
Tile Module
34
Fig. 4.1.10
Compose
Tile Module
34
Fig.
4.1.11
Produce
Scene
Module
35
Fig. 4. 1
.12
Calibrate
Module
36
Fig. 4.1.13 Load
Image
Module
37Fig.
4.1.14Read
TranslationModule
38
Fig. 4.1.15 Show Final Module
38
Fig. 4.1.16
Write
Final Module
39
Fig.
4.1.17
Write Translation Module
40
Fig. 4.1.18 A
representation ofthefinal
SSC
System Network
using
AVS[1990]
as a software platform40
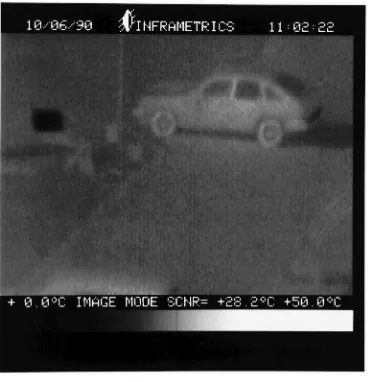
Fig.
4.2.1
Actual
infrared image
of a nighttimeparking lot
42
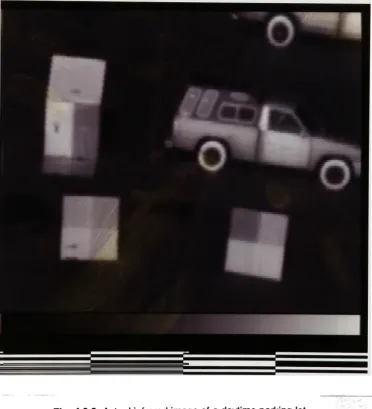
Fig. 4.2.2 Actual infrared image
of adaytime
parking
lot
43
Fig.
4.2.3 Actual infrared image
of a nighttime airport 44Fig. 4.2.4
Symbolic
scene usedin
nighttimeparking lot
'
comparison
45
Fig.
4.2.5 Symbolic
scene usedin
daytime
parking
lot
comparison
45
Fig. 4.2.6
Symbolic
scene usedin
nighttime airport comparison46
Fig.
4.2.7Initial
symbolicimage
usedin
nighttimeparking lot
comparison 52
Fig.
4.2.8 Final
symbolicimage
usedin
nighttimeparking lot
comparison
55
Fig. 4.2.9
Initial
symbolicimage
usedin daytime parking
lot
Fig. 4.2.10
Final
symbolicimage
usedin daytime parking lot
comparison
59
Fig.
4.2.1 1
Initial
symbolicimage
usedin
nighttime airportcomparison
63
Fig. 4.2.12
Final
symbolicimage
usedin
nighttime airportTable
of
Tables
Table
4.2.1
Symbolic
scene materials usedin
nighttimeparking
lot
comparison46
Table
4.2.2
Symbolic
scene materials usedin
daytime parking lot
comparison
47
Table
4.2.3
Symbolic
scene materials usedin
nighttime airportcomparison
47
Table
4.2.4
Example data
for
Spearman's
rank order correlationcoefficient calculation
50
Table
4.2.5
Example
data
for Spearman's
rank order correlationcoefficient calculation
50
Table
4.2.6 Initial
rank order correlation coefficientdata for
nighttime
parking lot
52Table
4.2.7
Rank
order correlation coefficientdata for
nighttimeparking lot
53
Table
4.2.8 Final
rank order correlation coefficientdata for
nighttime
parking lot
54Table 4.2.9 Initial
RMS
temperaturedifference
calculationdata for
nighttime
parking lot
55
Table
4.2.10
RMS
temperaturedifference
calculationdata for
nighttime
parking lot
56
Table
4.2.11Final RMS
temperaturedifference
calculationdata for
nighttime
parking lot
57
Table
4.2.12
Initial
rank correlation coefficient calculationdata for
daytime
parking lot
58
Table 4.2.13
Final
symbolic scene materials usedin daytime
parking
lot
comparison60
Table
4.2.14 Final
rank correlation coefficient calculationdata
for
daytime parking lot
60
Table
4.2.15 Initial RMS
temperaturedifference data for
daytime
parking
lot
61Table
4.2.16 Final RMS
temperaturedifference data for daytime
parking lot
62Table
4.2.17 Initial
rank correlation coefficient calculationdata
for
nighttime airport
63
Table
4.2.18 Final
symbolic scene materials usedin
nighttimeairportcomparison 64
Table
4.2.19 Final
rank correlation coefficient calculationdata for
nighttime airport
65
Table
4.2.20 Initial RMS
temperaturedifference data
for
nighttimeairport
65
Table
4.2.21Final RMS
temperaturedifference
data
for
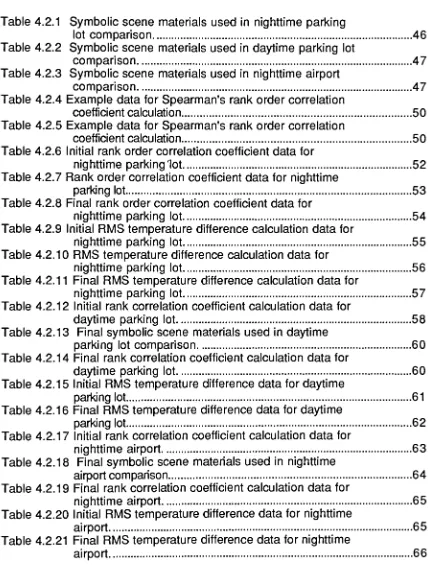
nighttime [image:11.534.55.483.76.642.2]Abstract
Infrared image
analysishas become
avery
popular subject of study.Situations
as recent as theGulf
War
have
provedthe advantages, and thereforethe need, of
having
notonly
the properimaging
equipmentbut
thetraining
andexpertise to use that equipment.
To
date,
there arefew
tools that analysts canuse to educate
themselves
and the operators of the state-of-the-artimaging
equipment.
There
are evenfewer
tools that provide theflexibility
to controlnearly every
aspect ofinfrared
imaging
phenomena.Several pre-existing
anda
few
new remotesensing
sub-systemshave been
combined to create anextremely user-friendly
infrared
imaging
analysis package that canbe
used toeducate people about
infrared
imaging
phenomena or as adirect
analysis toolto assist analysts
in
distinguishing
between
infrared
phenomenain
actual1.0
Introduction
Since
thefirst
photographicimages
were created, peoplehave
tried todetermine just
whatit is
that
they
areseeing
in
the photographs.Everyone has
experienced
this
at one time or another.For
example, at cousinJimmy's
birthday
party
Auntie Em
snapped aPolaroid
and, asit
develops,
the entirefamily
unanimously decides
thatit
is Jimmy's
ownfinger
that canbe
seenstealing
theicing
from
Grandma
Smith's
latest pastry
creation.This
simple scenariodescribes
aform
ofimage
analysis, although perhaps the most primitiveform.
While
thefamily
looked
at the photographthey
used their experience andintuition
to give theminsight
asto what wasgoing
onduring
the split secondthat the photograph wastaken.Within
thelast
few decades
the science ofimage
analysishas
evolvedfrom
identifying
theicing
thief atJimmy's
birthday
party
todetermining
thenumber of parts per
billion
of toxic wastebeing
dumped
into
thelocal
river systemby
the villagefactory.
The
tools thathave
been implemented
by
image
analysts
have
also evolved;from
cameras and simple magnificationloupes
to spacebased,
hyper
spectral, electro-opticalscanning
systems with sophisticated computerized analysis algorithms thatdetect
radiation thathumans
or simple cameras cannot.This
brings
us to the topic of the thermalinfrared Symbolic Scene
Comparator
(SSC)
system.Over
the years sincethefirst
visibleimage
capture systems(photography
in
particular)
were putinto
use,image
analystshave
gained extensiveimages.
The
major reasonwhy
analysts are able to understand visibleimaging
phenomena sothoroughly
is
thefact
that thereis
such a vastlibrary
of visibleimages from
which tolearn.
In
other words, analystshave been
able to gaininvaluable
experience andintuition
because
they
have
been
able to witnessnearly
every
imaging
phenomena possible.Also,
if
an analyst canimagine
asituation that
has
notbeen
previously
imaged,
it is
arelatively
simple andinexpensive
task to setup
thedesired
situation,image
it,
and make observations aboutits
characteristics and then alter that scenein
order to observeany
effects ofthe scene alterations on theimages.
Until
now,infrared image
analystshave
notbeen
able tolearn
from
extensivelibraries
ofimages.
Since infrared
image
capture anddisplay
is
nottrivial and can
be
fairly
expensive, these taskshave been
performedmainly
by
government agencies,proprietary
companies, or other groups with abudget
sufficiently
large
enough to afford the required tasks.Therefore,
the set of2.0
Background
Literature
Review
Infrared image
analysis and scene simulationhave become
a popularresearch topic
in
the
last
few
years.Recent
papersin
theliterature
involve
theuse, analysis, and generation of
infrared
images.
Several
current articlesdeal
with subjectsthat are similarto the
SSC
system as a whole ortoindividual
SSC
system sub-models.
However,
thereis
one majordifference
between
theSSC
system and the other simulation projects that
have been
reported.Other
simulation projects are aimed at the
creating
testbeds for
imaging
hardware
and guidance systems while the
SSC
systemis
directed
athelping
theinfrared
image
analyst perform theirduties
moreefficiently
and more accurately.The
following
sectiondescribes
several articles that are representative ofcurrent work
being
done in
the area ofinfrared
image
analysis and scenesimulation.
In
addition to thedescription
andsummary
of the methodspresented
in
each article, similarities anddifferences from
the proposedSSC
system will
be
addressed.One
project thatis very closely
related to theSSC
systemis
theinfrared
synthetic scene generator reported
by
Keller [1991].
The
generatoris
used toproduce actual
infrared images
that can thenbe
scannedby
a sensor tocharacterize the entire
sensing
systeminstead
ofjust
one portion thereof.Keller
madeimprovements
that allow the simulatedimage
tobe injected into
the
processing
software of animaging
system.This
allows theimage
processing
software and electronics tobe
tested withoutinfluence from
theThe
title suggeststhat
Keller's
simulatoris
a real-timeimage
production system,but
in
this case,the
image
is
displayed
so that theimaging
system, undertest,
can scan theimage instead
ofreading
thedata from
a computerfile
or some other storage system.The SSC
system, onthe otherhand,
willbe
real timein
the true sense of the phrase.The
user willbe
able tointeractively
edit scene, weather, or calibration characteristics andimmediately
witness changesin
the calculated symbolicimage.
Although
notexplicitly
statedin
the paperby
Keller,
the user must make anentirely different
symbolic scene to make asimple change
in
the scenemake-up
of the simulatedimage.
This
makes theKeller image
generator avery
accurate system,but
also slow anddifficult
to use.and second moments ofthesynthetic
images very closely
resemble those oftheactual
images.
Cadzow's
system alsohas its
drawbacks.
An
accurate,intricate
background
may be
usefulfor
some applications,but is
notnecessary
for
anapplication such as the
SSC
system.The
user needsonly
to match thegrey
level
ofthebackground
materialin
the symbolicimage
with the averagedigital
count over a small window
in
thebackground
ofthe actualinfrared
image.
It
is
not
necessary
to match the textures of the twoimages.
Cadzow's
background
simulation
may
have limited
usefor
an analysistool such astheSSC
system.Hall,
et. al.,[1991]
also created avery
reasonableinfrared
image
simulation algorithm.
The
basic
premise was to simulate the variousimages
thatwould
be
acquiredby
a missile asit flies
a pre-determined pathfrom launch
to target.
The
algorithm usesafixed
coordinate system tospecify
afixed launch
position and target position as well as the synthetic scene geometries.
The
steps ofthe algorithm arerelatively
straightforward.As
the missiletravels
the
pre-determinedflight
path, the onboardimaging
sensor"captures"
images
of the terrain andany
land-based
objects(which
have
alsobeen
predetermined).
The
image sensing
sub-system thatis
used applies somebasic
radiance propagation techniques that
include
an atmospheric attenuationstep
that
is
providedby
Lowtran7 [1988].The
Hall image
acquisition algorithmis
quite similarto theSSC
system.For
example,both
utilize the wellknown
radiance propagation equations toalso utilize
Lowtran7
toapply
an atmospheric attenuation term to thepropagating
radiances.Lastly, they
areboth
capable ofconverting
sensedradiances
into
grey-scaleimages
that are view ableby
the user.Dissimilarities
also existbetween
theHall
project and theSSC
system.One
ofthe most prevalentis
thefact
that theformer
offersthe userno methodfor
comparison.
Instead
ofbeing
able to make comparisonsbetween
an actualinfrared image
and the syntheticinfrared
image,
the user must assume that thesynthetic
infrared image
is faithful.
Since
the algorithmis
assumed tohave
been
testedthoroughly,
thismay be
valid.However,
from
an analyst's point ofview, this
idea is nearly
useless.The
ability
to compare the predictedimage
toan actual
image
is
one of theinherent
qualities that sets theSSC
system apartfrom
other simulation algorithms.The
other majordifference between Hall's
project and the proposedSSC
system
is
theability
to altercharacteristicsin
theSSC
systeminteractively.
The
user
is
able to edit or alter weather, scene, or material characteristics orparameters at will and see the results of the alterations
immediately.
To
accomplish these sorts of tasks with
Hall's
system, the user wouldhave
torestartthe synthetic scene
design,
rerun theflight
path specification, etc.In
theSSC
system, the user canrandomly
pick the particular characteristic tobe
altered and
input
the particular valuedesired
withoutchanging any
otherparameterand without
restarting
theSSC
session.The
precursorand the logical extension to theSSC
systemis
a softwarepackage that was
designed
tobe
a completeinfrared
syntheticimage
synthesisThe
basic
premisebehind
this work was a simulation of a pinhole camerathat
is
sensitive to
infrared
wavelengths.A
pinhole camerais
camera that uses a smallhole
asits lens.
Rays
oflight
from
theimage
scene pass through the pinholelens
and are thenimaged
at theimaging
plane of the camera.A
ray
traced simulationis
used to simulate theimages
that are producedusing
a pinhole camera.The basic
algorithminvolves
following
a ray, or vector,from
animage
plane position, through the pinholelens
of the camera, andinto
the scenebeing
imaged
todetermine
what shouldbe imaged
at the ray'ssource
image
plane position.The
majordifference between
theray
tracing
algorithm and the pin-hole cameratheory
is
that the rays oflight
are cast outfrom
theimage
planein
theray
tracing
algorithm, which wouldbe
within the pinhole
camera,instead
offirst
interacting
with the scene and thenbeing
incident
onthe
image
plane.There is
also a majordifference
between
theDIRSIG
ray
tracing
algorithm and atypical
ray
tracing
algorithm.This difference is demonstrated
by
thevery
noticeable effects ofbackground
objects on theprimary
target objectsof a synthetic scene.
For
example, avery
hot
background
object can make aforeground
target object appear tobe
the warmer of the two objectsif
thegeometry
of the sceneis
such that a reflection of the second object wouldbe
seenin
thefirst if
thefirst
object's surface were replaced with a mirror.Because
of theirdramatic
influence,
theinfrared
ray
tracer accounts thebackground
objects as well astheforeground
objects.The
infrared
ray tracer,
like
theSSC
system,has
theability
tovary any
ofbe extremely flexible
and to allowfor
nearly any
scene configuration, evensomethat
do
not occur naturally.Although accuracy
andcomplexity may be very
desirable,
sometimesthey
mustbe
compromised to allowfor
speed andflexibility.
The infrared ray
tracercan
be
thought of as astarting
pointfor
theSSC
system.The
precision ofthe
infrared ray
tracer requiresmany
calculations to compute a particular scene.If
the resultsdiffer from
predicted, the user must either redesign the syntheticscene or redesign the
initial
imaging
parametersfor
theray-tracing
algorithms.The accuracy
of theinfrared
ray-traceris very
useful to analysts,but
theamount of time required to produce usable results
is
adrawback. This
is
particularly
true when some trial-and-error methods are used to predictparticular
imaging
phenomena.This
was the major premisefor
developing
theSSC
system.A
system wasdesired
that woulddo
the samepredicting
as theinfrared
ray tracer,
but
in
a much simpler manner, more quickly, andinteractively.
The
user could then run theray
tracer on a similar sceneif
moreaccuracy
ordetail is
desired.
The
SSC
systemhas
the advantage ofallowing
the user to makeinteractive
changesin
parameters and tobe
presented withresults almost
instantaneously.
The
ray tracer,
with allits
complexity,has
to gothrough quite a
bit
of refinement and optimizationbefore it
would approach realtime
performance.The SSC
systemis
able to present theinfrared
image
analyst with auser to alterthem to suit specific needs without
spending
large
amounts oftime andmoney
to set up, acquire, and view actualinfrared images.
While it is
truethat the level
ofcomplexity
of the radiometric calculations usedfor
theSSC
system are quite a
bit
lower
thanthey
couldbe,
thesimplicity
of the operations allowsfor
quick processing.This
allows the user to make a change andbe
presented with results
nearly immediately.
There is
one moreliterary
source that needs tobe
studied.This
materialis
not presentedbecause it
relates to theSSC
system orany
ofits
components.It
is
presentedbecause
it is
afairly
good example of the use ofSpearman's
rank order correlation coefficient.
This
correlation coefficientis
fairly
helpful
in
quantifying
thesimilarity between
twoitems
or methodsbeing
compared.In
the evaluation portion of this project,Spearman's
rank order correlation coefficientis
used to evaluate the amount ofsimilarity
between
an actualinfrared
image
and a symbolic
(or artificial)
infrared image.
The details
of that evaluation are presentedin
greatdetail later.
However,
thefollowing
articleis
presented as an example ofhow
theSpearman
rank order correlation coefficientis generally
used.Nagurney [1992]
automated a methodfor
prioritizing
triage patients.Using
a set of triageEMS
patients, apriority
ranking
technique was testedagainstthe composite opinion of
four
physicians.Using
the opinions of thefour
physicians,
a rank wasdetermined for
each of the patients.The
experimentalranking
techniquewas also used to rank theseverity
of the test cases.technique and
those
ofthe
physicians.The
actual results, althoughrelatively
good
(r
=0.935),
areirrelevant
to theSSC
system orany
ofits
components.What is
relevantis
the
use ofSpearman's
rank order correlation coefficient torelate
how
wellthe newtechnique
matches the current techniques.One
interesting
step
that
was usedby
the author wastohave
another setof
four
physicians re-rankthe conditions ofthe set of patients.This
proved tobe
a
very convincing
argumentfor
the new technique.Spearman's
rank ordercorrelation coefficient
for
therelationship
between
the newtechnique
and thefirst
set of physicians was almostidentical
to the coefficientfor
therelationship
between
thetwo
sets of physicians.In
other words, theability
of the newtechnique
to rank theseverity
ofinjuries
is
neitherbetter,
nor worse, than theability
of a physicianto perform the same task.The
SSC is
able to compare twoimages:
an actualinfrared
image
and asymbolic
(or predicted) infrared
image.
Then,
if
the twoimage's
digital
countsdo
not matchfor
particular objects within the actualimage,
theSSC
allows theuser
to
manipulate ahost
of variables upon which the predictedimage is
dependent.
This
allows the user to alter the prediction scene andits
environment until a match
between
the actualinfrared image
and the symbolicimage is
made.This
sort ofcomparisonis depicted in Fig. 2.1.
The
top
image
represents the material
map
image
thatis
used to manipulate the scene makeup,
the
centerimage
represents the predictedimage,
called the symbolicimage,
and thebottom
image
represents the actualinfrared
image
thatis
usedSymbolic Scene Material
Map
Calibrated
Symbolic ImageActual Infrared Image
[image:23.534.159.375.49.399.2]3.0
Approach
The
SSC
systemhas been
designed
tobe very
robust and to allowalterations or additions with
only
minor adjustments.This
section willdescribe
the scientific
theory
behind
theSSC
system,layout
each of the modulesneeded
for
theSSC
system, anddescribe
the calibration algorithm tobe
used [image:24.534.59.477.247.508.2]by
theSSC
system.Fig. 3.1.1
Many
factorsthatcontributeto the sensed radiancefromaninfrared scene3.1 Scientific
Theory
The
Symbolic
Scene
Comparator
uses the radiance propagationequation to model the radiance
leaving
the surface of each materialin
a scene.same atmosphere propagation effects as those that were experienced
in
theacquisition of
the
actualIR image.
As is illustrated
by
Fig.
3.1.1,
many factors
contribute to the signalreceived
by
a passive sensor.The
radiance representedby
the output signal ofan
imaging
systemis described
by:
L
=8TLT
+(1-8)T[T1Escos(0)(1/n)
+Lb
+L(J+
Lu
(3.^-,)
where:
L
=Radiance
received at sensorLb
=Radiance due
tobackground
objectsLd
=Down
welled radiance to materialLu
=Upwelled
radiance to sensorLT
=Radiance due
to material temperature=
Material
surface-normalemissivity
li
=Atmospheric
transmissionfrom
space toEarth
T
=Target-to-sensor
transmissionEs
=Exo
atmosphericirradiance
0
=Solar declination
angleFor
the symbolic scene comparator, the equation canbe
simplifiedfurther. This is due
to thefact
that a calibrationstep (which
willbe described
in
detail
later)
willbe
utilized to add atmospheric attenuation effectsto thesurface-leaving
radiancefor
the various materials that are placedin
the symbolic scene.Also,
since the symbolic sceneis
assumed tobe
twodimensional,
the radiancedue
to
background
objectsis
eliminated,i.e.
there are nobackground
objectinteractions
tobe
considered.Lastly,
assuming
that most of the objects tobe
used
in any
of the symbolic sceneshave
alow
(roughly
0.1)
reflectivity,
thesurface-leaving
radiance and canbe
omitted.The
equation used to calculate thesurface-leaving
radiancefor
each materialin
the symbolic sceneis:
L
=LT
+(1
-8)T, Es
cos(0)
(1 /
n)
(3.
1
.2)where:
L
=Surface-leaving
radiance=
Material
surface normalemissivity
LT
=Radiance due
to material temperatureTi
=Atmospheric
transmissionfrom
spaceto theEarth
Es
=Exo
atmosphericIrradiance
0
=Solar declination
angleThe
emissivity
is
characteristic of the material thathas
been
measuredand stored
in
the materialdata lists.
It
actually
depends
on theviewing
angle of the sensor,but it is
assumed that allviewing
angles are normal to the materialsurfaces.
The
self-emitted radiance termis
often thelargest contributing factor
andis
calculatedby
computing
the temperature of the material andits
associatedradiance over the particular passband that
has
been designated
by
the user.The
temperature calculationis
performedby
a temperature prediction modelcalled
THERM,
developed
by
DCS Corporation
[DCS.1989].
THERM
computesthe
predicted temperaturefor
that materialfrom
material and weatherparameters.
The
radiancedue
to the temperature ofthe materialis interpolated
from
curves.
One
covers the3-to-5
micron region while the other coversthe 8-to-14micron region, of the spectrum.
The
radiance values associated with each ofthe
curves was obtainedby
applying
aninverse Planckian
radiator algorithmfor
a
fairly
wide range oftemperatures
atincrements
of5 Kelvins.
A
linear
interpolation
routine was used to calculate the radiance associated with theparticulartemperature thatwas predicted
by
theTHERM
routines.The
source-target transmission(T^
termin
the equationis actually
anatmospheric transmission.
It is
calculatedby
supplying
the season of year,latitude,
passband, and time ofday
to alinear interpolation
routine.The
four-dimensional
data
table contains values that were calculatedby
an atmosphericcharacterization model, called
Lowtran7
[1988]
which wasdesigned
by
theU.S.
Air
Force.
The
season variablehas
only
two possibilities, summer or winter.The
passband variable alsohas only
two possibilities,3-to-5
microns or8-to-14microns.
The
latitude
value can rangefrom
negative90
degrees
to positive 90degrees.
The
time ofday
canvary between
8:00am and 6:00pm(i.e.
only
daylight
hours;
thereis
no need to calculate the transmission termif the
specified time
is
afterdark
orbefore
sunrise).The
data
tables canbe
expandedto
include
a larger rangefor any
of the variablesby
applying
theLowtran7
software to obtain the newT-,
data
values andthenadding
these valuesinto
thehard-coded
interpolation routine thathandles
the transmission valuecalculations.
It
shouldbe
noted at this time that the 8-14 micron range ofdata
is
not
totally
necessary.Since
theresulting
transmission valueis
multipliedby
the exo-atmosphericterm,
whose valueis
close to0.0 in
that passband, thereis
noneed to calculate the transmission term
in
the 8-14 micron region.This
shouldThe
exo-atmosphericirradiance is
calculatedby
a subroutine of theLowtran7
software, as well.The
routinetakes
theday
of year, passband, andtime of
day
and calculates theirradiance
incident
on theEarth's
atmosphereby
interpolating
from
apre-existing hard-coded data
table.The
solardeclination
angleis
calculatedby
a portion of theLowtran7
software.
It is
then used under the assumption that all objects within thesymbolic scene are planar and
flat
against the surface of theEarth.
In
otherwords,
theincident
sun raysmay
be
at an angle with the surface ofthe objectsin
the symbolic scene,but
those objects are nottilted with respectto theEarth's
surface.
3.2
Sub-system
Descriptions
The SSC
systemis
somewhat analogous to ahuman
body
in
that thesurface-leaving
radiance calculationis
the skeleton thatholds everything
else together.Each
ofthe sub-systems canbe
thought of as appendages thathelp
to make the
SSC
system anentity
different from
any
other.Each
of thecontributing
sub-systems couldbe
thought of as a separate part thatdepends
on each of the other sub-systems to perform
its
job
toits fullest
extent.The
following
is
adescription
of each of the sub-systems and their respectivefunctions.
3.2.1
Symbolic
Scene
Creation
A
symbolic sceneis necessary for
any
sort ofmodeling
or prediction.needed to calculated
the
surface-leaving
radiance values and subsequentdigital
countsfor
each ofthe objectsin
the scene.The
creation of such a sceneis done inside
the
SSC
systemitself
instead
ofbeing
createdby
anotherprogram
before
being
imported
into
theSSC
system.This
helps
make theSSC
system more
flexible
than other simulation algorithms, such asDIRSIG,
in
thatchanges
to
the symbolic scene canbe
madeeasily
andquickly
withoutexiting
the current
SSC
session.In
fact,
changes to the symbolic scene areencouraged to allow the user to observe the effects of
altering
sceneparameters
has
on thedigital
counts ofthe symbolicimage.
The
created symbolic scene willnormally
be
composed of severalobjects, each of which
is
placed on abackground
material and eachmay
be
composed of several materials.
Each
of these materialsis
assignedfactors
thatdescribe
thethermodynamics,
radiation absorption, and emission of thatmaterial
(a
completelist
of characteristicsis
presentedin Appendix A).
Values
for
each of the characteristics willbe
usedby
the comparatorin
somefashion,
whether
by dictating
adesired
value orsimply accepting
thedefault
valuespresented
by
the
SSC
system as typicalfor
a given material type.An
exampleof a simple symbolic scene
is
shownin fig.
3.2.1.Ml
????>
One
of the properties of the symbolic scene comparator software willbe
theability
to alterany individual
orgroup
of the material characteristicsassociated with a given object
in
the symbolic scene.This
would allowthe user to createdifferent
imaging
situations and tobe
able to simulatedifferent
imaging
phenomenasimply
by
editing
afew
material or weather characteristics.The ability
toeasily
alter the symbolic scene to createdifferent
imaging
situations
is
the majordifference
that sets theSSC
system apartfrom
all otherinfrared image
generators or simulators.The
altering
ofdata
willtake placein
anediting
session that will allowtheuser to select and change
any
parameter.Each
value willhave
a valid rangeso that
physically impossible
characteristics willbe
avoided as much aspossible.
However,
there willbe
no checks on combinations of characteristicvalues to prevent
physically
impossible
materialsfrom
being
specified.The
altered symbolic scene material characteristics will then
be
used asinputs
tothe rest of the
SSC
system to produce a symbolicimage.
In
this manner, thesymbolic scene can
be
interactively
changed to provide the user with theflexibility
needed to producenearly
real-time results.3.2.2
Weather
InitializationPrior
to the prediction ofany
materialtemperatures,
the symbolic sceneweather
data
is
usedby
the
temperature-prediction routines ofTHERM
andis
important
to theaccuracy
ofany
prediction thatis
madeby
that routine.s 3
A)
Time
B)
C)
<D k_
c5 CD Q.
E
<D
Q.
E
Time
Time
3.2.2 Frame-by-frame weather parametereditingsession
The
weatherdata
canbe
made available to the comparator systemin
either of
two
ways.First,
the weatherdata
cansimply
be
placedinto
afile
thatcan
be
readby
the weatherinput
routines(the list
ofnecessary
parameters andthe
file format is
included in Appendix A).
Secondly,
the user canlet
thesoftware predict the weather
for
a givenday by
supplying
a minimal amount ofdata
to the weather predictor about the time ofimage
acquisition such aslatitude,
longitude, date,
and peak airtemperature(Appendix A).
Once
the weatherdata is
accessibleby
the comparatorsoftware the userbasis.
The
editing
routine will allow the user to changeany
weathercharacteristic
for
any
or all times prior to theimage
acquisition time anddate.
This
allows the user tohave
precise control over the scene comparison thatis
desired.
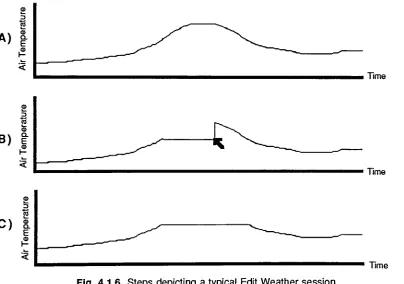
Fig. 3.2.2
presents the reader with aframe-by-frame demonstration
ofediting
of a weather parameter,using
airtemperatures an example.The
editing
process
is
described
by
thefollowing
(the
letters
referto theframes
asdepicted
in Fig.
3.2.2):A)
After
selectionfrom
a completelist
of weather parameters, a plotis
displayed
ofthe particular characteristic tobe
edited as afunction
of time where the
beginning
time represents 24hours
before
thedesired
image
acquisition time and theending
timeis
thedesire
image
acquisition time.B)
The
routine will thenlet
the user edit thedisplayed
curveby
drawing
in
a new curve of values with the mouse.This
canbe
done
atonly
onetime ofday
orfor
severalby drawing
a newcurve while the mousebutton
is
depressed.
C)
When
theediting
sessionis
exitedfor
the parameterbeing
edited,the new values are accepted and then used
by
the remainder ofthe
SSC
system.These
three steps canbe
used to editany
or all of the weathercharacteristicsfor
a particularday
to give the user complete control of the weatherthat willbe
used to representthe environmental conditions
during
the actualinfrared
image
acquisition.
3.2.3
Temperature PredictionOne
of the most important tools tobe
utilizedby
the symbolic sceneand
implemented
by
DCS
and tested atR.I.T.,
this routine uses material andweather characteristics to predict a temperature
for
the material and weather that was supplied.In
previous simulation algorithms, such as thoseby
Shor
[1990],
thesurface
temperature
usedin
the simulation wasinput
by
hand.
If
an parametersuch as
input
temperature
was tobe
changed, the symbolic scenehad
tobe
rebuilt.
Often,
the temperature
assigned to the materials within a symbolicscene were quite
different
from
the temperatures observedin
actual scenes withthe prescribed environmental conditions.
In
1990,
DCS
Corporation
published a temperature simulation modelcalled
THERM,
whichis
used to calculate thehistory
of object surfacetemperature.
THERM
usesfirst-principle
models todescribe
the rate ofheat
transfer
between
the object andits surrounding
environment.Temperatures
arecalculated
for
each material of an object, thusit
is
assumed that each materialis
thermally
independent.
As
input,
THERM
requiresinformation
todescribe
eachof
the
materials of the objectin
question and ahistory
of the environmentalweather conditions. THERM
is
considered tobe
a good predictor oftemperatures when compared to real-world object temperatures.
The
THERM
package was chosen to compute objecttemperatures for
several reasons.
If
given the proper material and weather characteristics, thetemperature-prediction routine
is
fairly
accurate.Rankin
[1992]
has
demonstrated
that the temperature predictions are within4K
of actual valuesunder the
best
weather and scene conditions.Even
under worst casecharacteristics, the temperature
predictions are still within7k.
Secondly,
theroutine
is
quitefast. The
apparentlimiting
factoris
theseemingly
continuousfile
reading
and writing.When
extractedfrom
the userinterface
usedby
THERM,
thetemperature
prediction portion ofTHERM
performs nofile
manipulationwhatsoever, thus
speeding up
the process.Probably
the mostimportant
reasonfor
choosing
theTHERM
temperature-predictor
is its
widevariety
of variables(a
completelist is found
in
Appendix A).
Virtually
every
conceivable weather and material parametermay
be
changedto
create new sets of variables.This
is extremely important
for
useas a
teaching
tool.If
several variables aresimultaneously
changed, then thecause of a particular
imaging
phenomenonis
difficult
todetermine.
However,
since
THERM
is
robust, the cause of a particularimaging
phenomenon canbe
pinpointed
accurately
andquickly
by
incrementally
altering
individual
variables.3.2.4
Calibration
If
theSSC
systemis
thought of as ahuman
body
with thesurface-leaving
radiance calculation
being
the skeleton, then the calibration sub-systemis
thedistinguishing
feature
that sets theSSC
system apartfrom
otherinfrared
imaging
simulation algorithms.The
conceptsbehind
the calibration sub-systemmay be
simple,but
the sub-systemis
quite effective.To
better
compare the actualIR
image
to the predicted symbolicimage,
changed.
Therefore,
a calibration procedureis
used that applies a gain andoffset
to
the symbolic scene withoutaltering
truedata.
Once
asurface-leaving
radiancehas been
calculatedfor
each materialwithin the symbolic scene, a
digital
count mustbe
assigned to that material.That
digital
count mustbe
calibrated to allow comparison to thedigital
count ofa similar material within the actual
infrared
scene.The
calibrationfrom
radiance to
digital
countis
representedby
thefollowing
equation:DC
=L*m
+b
(3.2.4.1)
where:
DC
=displayed digital
countL
=surface-leaving
radiancem = calibration curve slope
b
= calibration curveintercept
pointThis
calibration equation wasderived in
a straight-forward manner:L
=TLT
+(1-)T[T1Escos(0)(1/n)
+Lb
+Ld]+Lu
(3.1.1)
L
=TLS
+(1
-)T
Lb
+(1
-)T
Ld+
Lu
(3.2.4.2)
Utilizing
the two assumption about the symbolic scene allowfor
somesimplification of the equation.
First,
the assumptionhas been
made that allobjects contained
in
the synthetic scene are planar with, and adjacentto,
theEarth's
surface,i.e.
there are nobackground
objects toinfluence
the amount ofwelled radiance
term,
due
tovery low
surface reflectances,has
been
assumed.The
above equationis
reduced to:L
=Lsm-|
+bi
(3.2.4.3)
where:
Ls
mi
bi
eLj
+o-ej^EsCostGjo
/n)
gain term associated with the atmospheric
attenuation effects on the radiance as
it
travelsfrom
the materialto the sensoroffset term associated with the atmospheric
attenuation effects on the radiance as
it
travelsfrom
the materialto the sensorSignals
from
the sensors are assumed tobe linear
with theincident
radiation:
DC
=L
*m2
+b2
(3.2.4.4)
where:
L
1TI2
Lsm-|
+b-|
gain term associated with the sensor
attenuation effects onthe radiance as
it is
processed and propagated through the
various sensor electronics
offsetterm associated with the sensor
attenuation effects on the radiance as
it is
processed and propagated through the
various sensor electronics
by
substituting
3.2.4.3into
3.2.4.4:DC
=Ls
*mi *
m2
+ b-|*m2+
b2
(3.2.4.4)
m
b
then: mim2
bi* m2+b2
DC
=L
*where:
L
=surface-leaving
radiancefrom
a given material within the symbolic scenem = gainterm that combinesthe attenuation effects
associated with
both
the sensor and thelength
of atmosphere that the radiance wouldhave
to travel throughin
orderto reach the sensorb
= offsetterm that combinestheattenuationeffects associated with
both
the sensor andthe
length
of atmosphere that the radiancewould
have
to travel throughin
orderto reachthe sensor
The
slope andintercept
neededfor
thelinear
calibration curve aredetermined statistically
from
several pairs of user-definedsurface-leaving
radiances and
digital
counts.This
is done
by
using
the averagedigital
countfor
several windows that
have been
selectedfrom
within the actualinfrared image
and that
describe
areas where the actual scene materialis
wellknown
oreasily
predictable.
Such
materialsinclude background
areas such as concrete, water,or asphalt.
Then
a set of material parametersis
assigned to each of theselected windows.
From
this material assignment, asurface-leaving
radianceis
calculated.
This
gives thedigital
count and radiance pairs needed to constructthe calibration equation.
The
method used to calculate the slope andintercept
for
the calibration equationis
representedby
thefollowing
equations:where:
m =
Sxy
/
Sx
(3.2.4.5)
b=
)
(3.2.4.6)
SXy
-(xj-xT(yi-y)
Sx
=(xi-x)2
X average of all x values
(radiances)
The data
pointx-y
pairs used to calculated the calibration curve aredefined
by
selecting
areasin
the actualimage
that are assumed tobe
of aparticular
background.
The
averagegrey
level
of the chosen areais
computedand then used
in
the regression routine,described
above,along
with thecalculated
surface-leaving
radiancefor
thecorresponding background
in
thesymbolic scene.
By
using
several suchdata
points, thelinear
calibration curveis
calculated(Fig.
3.2.3),
to produce again, m, and an offset,b,
tobe
applied to the symbolic scene'ssurface-leaving
radiance values of the symbolic scene toresult
in displayable
digital
counts.0.000253 Surfac eLeavin
g Radiance 0.0012
3.2.3 Atypicalsurface-leavingradianceto digitalcountcalibrationcurve
This
calibration algorithm willeffectively
add atmospheric and sensoreffects to the
surface-leaving
radiances that are similar to those of the actualinfrared image.
In
other words, the symbolicimage
will appear tohave been
acquired under the same atmospheric and sensor response conditions as the
actual
infrared image.
Since
thebackground
material typesfor
a particular scene are eitherA
more complicated algorithm wouldbe
slower and more cumbersome, while asimpler one might not make the comparison
between
the actualimage
and thesymbolic
image any
easierthanhaving
no calibration at all.With
thesurface-leaving
radiance equationin
mind and thedisplay
ofcalibrated
digital
counts as afinal
goal, theindividual
sub-systems thathave
been
described
above,
mustbe
combined to create a smooth, robust systemthat
is
quite manageable evenfor
novice users.By
using
auser-friendly
image
manipulation system called
AVS
[1990]
as a platform, each of the sub-systemswas
first
constructed as anindividual
module and connectedusing
theAVS
network
editing
features.
The
SSC
System in
theAVS
networkis
illustrated in
Fig. 3.2.4.1.
This
environment allows the usertointeractively
edit the weather,4.0
Results
The
results of this project aredivided into
two parts.The first
being
theSSC
systemitself
-a network of computer softw-are routines, called modules,
that
interact
with each other and the user.As
a network, the routines produce asymbolic
image
that
is
compared with an actualinfrared image
to give the usera
better
understanding
of theimaging
phenomena at work within the actualinfrared image. The
second part of the results of this project arein
theform
of astatistical evaluation of the
ability
of theSSC
system to performits designated
tasks
under various conditions.4.1
SSC Module Descriptions
The
Final
SSC
system networkis actually
agroup
of modules that aredesigned
tointeract
with one another to perform thedesired
tasks.One
couldthink of the
SSC
system as the sum thatis
greater than the addition ofits
individual
parts.The
SSC
system modules use theAVS
software package asan
interface
that allows each module to get and giveinformation
to andfrom
theother modules
in
the network and also allows the user tointeract
with themodules.
Each
of the modules that makeup
theSSC
system network aredescribed
in
detail,
including
theirinputs
and outputs and their specific tasks.The
moduleshave been
grouped,depending
on their particulartasks, into
weather manipulation, scene manipulation, and calibration manipulation
sections.
They
have
been
groupedin
thisfashion
in
the actualAVS
networksoftware as well.
The
entireSSC
network, asit
appearsin
theAVS
C
Read Weather)
I
(^
BuildWeather
)
Q
Read Scene)
(
Select Tile)
1
C
EditWeatherL
")
TD
(^
Write Weather)
f^Read
Translation])
I
J
f
Compose TileJ
7^
(^
Produce SceneJ
,
(^
Write Scenei
,
jX
I
^
Load ImageJ
__J
(
Calibrate)
_J
L-L
[image:41.534.72.460.75.316.2]t^Write
Translation)
Q
Show FinalJ
Q
Write FinalJ
Fig. 4.1.1 Arepresentation ofthe final SSC System Network using
AVS[1990]
as a softwareplatform.4.1.1
Weather-Manipulation
Modules
The
weather-manipulation modules provide the user with theability
toread
in,
write out, create, and edit the weatherdata
thatis
neededby
the rest ofthe
SSC
network modules to produce an accurate symbolicimage
representation of the actual
infrared image.
The
weather manipulation modulesessentially
provide the user with complete control over the environmentalconditions
during
and prior to the time of acquisition of the actualinfrared
4.1.1.1
Read Weather
(
ReadWeather)
Fig. 4.1.2 Read Weather Module
The first
modulein
theSSC
network thatis
encounteredis
Read
Weather,
depicted
in Fig. 4.1.2.
The
figure
shows that there are noinputs
toRead Weather
from
any
otherSSC
modules andonly
one output to the rest ofthe
SSC
network.Read
Weather
asks the userfor
the name of thefile
thatcontains the weather
information
that shouldbe
usedfor
the currentSSC
session.
When
thefile
nameis
given,Read
Weather
then reads thedata
contained
in
thatfile (assumed
tobe
in
theformat
thatis
representedin
Appendix
A)
and then passesit
on to the rest oftheSSC
network.4.1
.1.2Write Weather
(
WriteWeaJtheX)
Fig. 4.1.3 Write Weather Module
Write
Weather,
shownin Fig.
4.1.3,
is
self-explanatory.This
modulesimply
takesin
the weatherdata
thathas been
usedin
the currentSSC
sessionand asks the user
for
afile
nameinto
which thatdata
willbe
storedfor
alater
SSC
session, thenWrite Weather
stores the weatherdata in
thatfile
in
thesame
format
thatis
recognizedby
theRead Weather
module thathas
already
been
discussed.There
are no outputsfrom
Write Weather
to the rest of the4.1.1.3
Build
Weather(
Build Weather)
T
Fig. 4.1.4 Build Weather Module
The
next modulein
theSSC
network thatis
encounteredis
Build
Weather. The figure
shows that there are noinputs
toBuild Weather
from
othermodule within the
SSC
network andonly
one output to the rest of theSSC
network.
Build
Weather
is generally
used when thereis
no priorknowledge
of adetailed
or actual weatherhistory.
Build Weather
asks the userfor
severalvariable values such as scene
latitude,
longitude,
airtemperature,
and rate ofprecipitation
(a
completelist
ofinputs
is
presentedin
appendixB)
tobe
used asinitial
weatherinformation
that shouldbe
used to predict the weatherhistory
for
the current
SSC
session.When
these variableshave
allbeen
filled,
Build
Weather
then creates a predicted weatherhistory
and then passesit
on to therest ofthe
SSC
network.4.1.1.4
Edit
Weather(
EditWeather)
Fig. 4.1.5 Edit Weather Module
The
Edit
Weathermodule allows the user to alterthe weatherdata
thatwill
be
usedby
theSSC
systemin
the current session.Inputs
toEdit Weather
are received
from
theRead
Weather module andfrom
theBuild
Weather
module.
Edit
Weather allows the user to choose the source of theincoming
weather
data
- either readin from
afile
or predictedby
theSSC
software.The
weather
data
can thenbe
edited.The
edited weather parameters are then sentFor example, if
the userhas
selected to read the weatherinformation in
from
afile
and wishes to edit the airtemperature,
he
wouldfirst
select the airtemperature
as the parametertobe
edited.Then he
would use the mouse todraw
the
desired
curve shape(Fig.
4.1.6).
The
user exits when satisfied withthe edits.
This
action supplies the updatedinformation
to the rest of theSSC
network.
The
user can then choose to edit another weather parameter orcontinue to the next
SSC
network module.Time
Time
C)
CLE
[image:44.534.57.461.256.540.2]Time
Fig. 4.1.6 Steps
depicting
atypical Edit Weathersession4.1.2
Scene-ManipulationModules
The
scene-manipulation modules providethe user with theability
to readmodules.
The
scene-manipulation modulesessentially
provide the user withcomplete control over object materials and properties
during
the time ofacquisition of
the
actualinfrared
image.
4.1.2.1
Read
Scene
Q
Read Scene)
Fig. 4.1.7 Read Scene Module
The Read Scene
moduleisused
when a symbolic scenefrom
a previousSSC
sessionis
usedin
the currentSSC
system.This
module requests thename ofthe
file
that contains thepreviously
saved sceneinformation.
After
thescene
information has been
readinto
theSSC
system all theinformation is
thenpassed to the rest of the
SSC
systemby
way
of the two output paths that areshown
in Fig. 4.1.7.
4.1.2.2
Write Scene
1
C
Write SceneJ
Fig. 4.1.8 Write Scene Module
Similar
to theWrite Weather
module, theWrite
Scene
module(4.1.8)
takes
in
the symbolic sceneinformation
(i.e.
theicons
in
the scene, thematerials that
have been
assigned, and all of theirmaterialproperty values)
andwrites
the information
to thefile
thatis
specifiedby
the user.The format
ofthe
data
in
thefile is
the same as that recognizedby
theRead
Scene
module that4.1.2.3
Select
TileC
Select Tile")
Fig. 4.1.9 SelectTile Module
The
Select Tile
module allows the user to select theicon,
oricons,
thatappear
in
the symbolic scene to represent the various objects presentin
theactual
infrared image
tobe
compared.There
are noinputs from
otherSSC
network modules.


![Fig. 4.1.1A representation of the final SSC System Network using AVS[1990] as asoftware platform.](https://thumb-us.123doks.com/thumbv2/123dok_us/114688.10973/41.534.72.460.75.316/fig-representation-final-ssc-network-using-asoftware-platform.webp)
![Fig. 4.1.18A representation of the final SSC System Network using AVS[1990] as asoftware platform.](https://thumb-us.123doks.com/thumbv2/123dok_us/114688.10973/52.534.76.456.431.666/fig-representation-final-ssc-network-using-asoftware-platform.webp)