Adler et al. Bioforsk Rapport vol. 9 nr. 82 2014 1
Bioforsk Rapport
Bioforsk Report
Vol. 9 Nr. 82 2014
Utilisation of co-streams
in the Norwegian food
processing industry
A multiple case study
Steffen Adler, Kaisu Honkapää, Maria Saarela, Rasa Slizyte, Hallgeir Sterten, Minna Vikman and Anne-Kristin Løes
Head Office
Frederik A. Dahls vei 20 N-1430 Ås
Tel.: (+47) 40 60 41 00 [email protected]
Bioforsk - Organic Food and Farming Division
Gunnars veg 6 6630 Tingvoll, Norway Tel.: (+47) 40 60 41 00 [email protected]
Title:
Utilisation of co-streams in the Norwegian food processing industry – A multiple case study
Authors:
Steffen Adler1, Kaisu Honkapää2, Maria Saarela2, Rasa Slizyte3, Hallgeir Sterten4, Minna Vikman2 and Anne-Kristin Løes1
1 Bioforsk-Norwegian Institute for Agricultural and Environmental Research, Organic Food and Farming Division, Gunnars veg 6, 6630 Tingvoll, Norway
2 VTT Technical Research Centre of Finland, P.O. Box 1000, 02044 Finland
3 SINTEF Fisheries and Aquaculture, P.O. Box 4762 Sluppen, 7465 Trondheim, Norway
4 Felleskjøpet Fôrutvikling AS, Nedre Ila 20, 7018 Trondheim, Norway
Front page photos:
Bioforsk A.-K. Løes and S. Adler
Date: Availability: Project No.: Archive No.:
21st May 2014 Open 20245 12/784
Report No.: ISBN-No: Number of pages: Number of appendices:
No. 82, 2014 ISBN 978-82-17-01283-2 58 None
Employer:
The Research Council of Norway
Contact person:
Steffen Adler, [email protected]
Keywords: Field of work:
Food industry, Norway, co-stream, feed ingredient, fertiliser, bioenergy, vegetable, potato, white fish, pelagic fish, poultry, regulation
Food and agriculture
Sammendrag:
energiproduksjon. Viktige forskrifter i EU og Norge vedrørende behandling og utnyttelse av relevante biprodukter presenteres, og alternativ utnyttelse blir diskutert. Foredlingsanleggene hadde tilsammen betydelige markedsandeler innenfor ferske poteter (38%), salat (17%),
fjørfekjøtt (24%) og hvitfisk og pelagisk fisk, der en stor andel går til eksport. Generelt ble en stor andel av råvarene utnyttet i mat og fôrprodukter. I gjennomsnitt for alle foredlingsanleggene ble 75% av råmaterialet benyttet i matvarer, 21% i fôrprodukter, 1% i gjødsel- og energiproduksjon og 3% ble deponert. Foredlingsanleggene brukte i gjennomsnitt 8,6 tonn prosessvann per tonn leveringsklare matvarer, men mengden varierte mye mellom anleggene. Mulige forbedringer i råvareutnyttelsen inkluderer generelt høyere utnyttelsesgrad i matvarer og utvikling av nye eller forbedrede fôrkomponenter fra biprodukter. Potensialet for gjødsel- og energiproduksjon er sannsynligvis begrenset til visse risikomaterialer på grunn av den allerede høye graden av utnyttelse i mat- og fôrprodukter, som har en betydelig høyere salgsverdi. Utsorterte poteter og grønnsaker og fjær, bein, blod, innvoller og skinn fra fisk og fjærfe har et stort potensiale for bedre utnyttelse til mat eller fôr. Aktuelle prosesseringsmetoder er fraksjonering, hydrolyse, fermentering og tørking.
Summary:
Food losses occur throughout the entire food chain, from primary production via postharvest handling and storage, to food processing, distribution, retailing and consumption. Globally, food losses account for about one third of the total food produced for human consumption. The aim of this report was to map the production and utilisation of co-streams in the food processing industry in Norway and to discuss possibilities for alternative utilisation based on qualitative aspects of the co-streams, and current legislation. This report is produced by work package 3 in the CYCLE project (2013-2016), “Total utilisation of raw materials in the supply chain for food with a bio-economical perspective”. The CYCLE project aims to improve resource utilisation in the
Adler et al. Bioforsk Rapport vol. 9 nr. 82 2014 1
Content
1. Preface ... 2
2. Introduction ... 3
2.1 Terms and clarifications ... 3
2.2 Risks related to the use of co-streams ... 5
2.3 Multiple case study ... 7
3. The flow of organic materials in three food chains ... 9
3.1 Vegetables and potatoes ... 9
3.1.1 Production and consumption in Norway ... 9
3.1.2 Case presentations ... 9
3.1.3 Raw materials, food commodities and co-streams ... 10
3.2 White and pelagic fish ... 23
3.2.1 Catch and consumption in Norway ... 23
3.2.2 Case presentation: Nergård Senja AS, Senjahopen ... 24
3.2.3 Raw materials, food commodities and co-streams ... 25
3.3 Poultry ... 29
3.3.1 Production and consumption in Norway ... 29
3.3.2 Case presentation: Nortura Rakkestad ... 30
3.3.3 Raw materials, food commodities and co-streams ... 30
3.4 Raw material utilisation efficiency... 33
3.5 Chemical composition of selected co-streams ... 34
4. Feed production from co-streams ... 37
4.1 Feed requirements for different groups of animals ... 37
4.2 Regulations governing the utilisation of co-streams in feed ... 40
4.2.1 Vegetable co-streams ... 41
4.2.2 Animal co-streams ... 41
5. Production of fertilisers and bioenergy from co-streams ... 46
5.1 Relevant fertiliser products ... 46
5.2 Regulations in Norway and EU ... 46
6. Potential and challenges for the utilisation of co-streams ... 48
6.1 Vegetables and potatoes ... 48
6.2 White and pelagic fish ... 49
6.3 Poultry ... 49
7. Conclusions ... 51
8. References ... 52
Acronyms
ABP Animal by-products
DM Dry matter
PAP Processed animal protein
Adler et al. Bioforsk Rapport vol. 9 nr. 82 2014 2
1.
Preface
This report is an early deliverable from the CYCLE project (2013-2016), “Total utilization of raw materials in the supply chain for food with a bio-economical perspective”. The CYCLE project was initiated by SINTEF Fisheries and Aquaculture in 2012. The main objective is to improve resource utilization in the food chain in Norway by developing sustainable eco-friendly bio-processes and novel technology, with research and innovation at its core. The project is based on three central food chains in Norway: Vegetables and potatoes; white and pelagic fish; and poultry.
In May 2012, the Research Council of Norway called for large research projects in the program Bionær (Sustainable innovation in food and bio-based industries). Bioforsk was invited by SINTEF Fisheries and Aquaculture as a research partner, together with VTT Technical Research Centre of Finland and many more. In CYCLE, Bioforsk leads the work to utilise food co-streams for animal feed and fertilisers (work package 3), in close
cooperation with VTT who leads the work to utilise co-streams not currently used for edible products for innovative food products (work package 2). Enzymatic and chemical hydrolysation are among the methods that will be utilised in work packages 2 and 3.
During a study tour in June 2013, scientists from all CYCLE work packages visited seven industry partners processing raw materials in the three food chains. The gathered
information provided a starting point for this report, which will function as a reference for the selection of food co-streams for more detailed studies, aiming at a development of feed products, feed ingredients, fertilisers and biofuel production. In CYCLE we are aiming at developing technologies to use co-streams for products of the highest possible value. The CYCLE project aims at decreased food losses and wastes, and increased raw material utilisation in the food chains of vegetables and potatoes, white and pelagic fish, and poultry. Hence, co-stream utilisation is the central topic, and we need to know what kinds of compounds these co-stream materials comprise of in the food processing cases.
We are grateful to the industry partners for inviting the CYCLE scientists into their plants and sharing valuable information, and for allowing us to publish this report.
Tingvoll, April 2014
Adler et al. Bioforsk Rapport vol. 9 nr. 82 2014 3
2.
Introduction
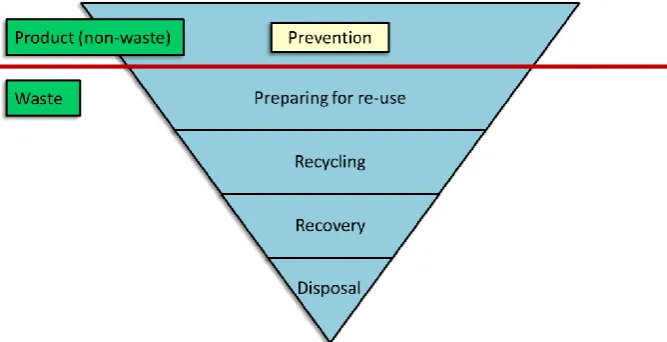
Efficient utilisation of raw materials in the food sector generally implies that a high proportion of the raw material is processed to food or pharmaceutical applications. According to the waste management hierarchy of the EU (Figure 1), avoiding to produce waste should always be the main strategy in any sector, followed by re-use, recycling, recovery and disposal of waste. Waste is defined as any substance or object which the holder discards, or intends to discard, or is required to discard (EC, 2008). For the food processing industry, utilisation of co-streams for feed or technical applications often gives a lower rate of return than for food applications, but should still be more profitable than to treat the co-stream as waste. Due to the high energy prices and economic support for renewable energy, biofuel and other bioenergy production1 from food industry co-streams
may be profitable enough to allow for a payment to the industry. In Norway, energy prices are generally low due to access to hydroelectric power. The industry has to pay a fee for waste disposed of as landfill or incinerated for destruction by methods, which do not provide bioenergy production. For waste incinerated for energy production, there is no end-treatment fee since 1st October 2010 (MD, 2013), but local incineration plants may still
be paid for disposal of high-risk animal co-streams where it may be cheaper for the industry to pay a plant for sanitizing the material than to sanitise it themselves. The Norwegian waste classification system comprises the categories recycling, biological treatment (i.e. composting, anaerobic digestion), filling and covering compounds (e.g. for road construction), incineration for energy production, incineration without energy
[image:9.595.75.409.428.599.2]production (i.e. destruction), and landfill.
Figure 1. The waste management hierarchy of the EU (EC, 2008)
2.1
Terms and clarifications
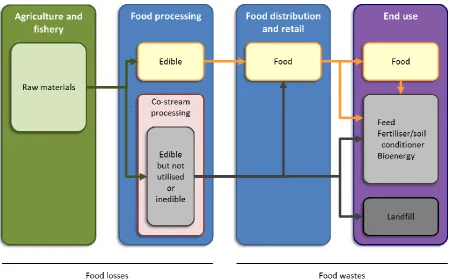
Food losses occur throughout the entire food chain, from primary production via postharvest handling and storage, to food processing, distribution, retailing and
consumption (Figure 2). Globally, annual food losses are estimated to account for about 1,300 million tonnes, about one third of the total food produced for human consumption
Adler et al. Bioforsk Rapport vol. 9 nr. 82 2014 4
(Gustavsson et al., 2011). In the Nordic countries, food losses are largest in households and in primary production, but also losses from the food-processing segment are significant (Hanssen and Schakenda, 2011). According to a Finnish study, 335 to 460 thousand tonnes of food, 62 to 86 kg per capita, is lost annually in Finland by consumers, retailers, food services and food industry (Silvennoinen et al., 2012).
The understanding of food losses and food wastes is complicated, and different authors have defined food losses and food wastes differently. The definition of Parfitt et al. (2010) was utilised in a recent FAO-report on food losses and wastes (Gustavsson et al. 2011). There, food losses is used to describe a decrease in edible food mass within part of a food supply chain that leads to edible food for human consumption. Hence, food losses take place at production, postharvest and processing stages. When food is utilised for non-food purposes, we may distinguish between planned and unplanned non-food use. Utilisation for feed, fertiliser or bioenergy production may be a planned non-food use, whereas ploughing down a non-harvested crop may be an unplanned non-food use (Gustavsson et al., 2011). Still, both non-food utilisations are included in the food losses. In the same report food wastes is used to describe food losses occurring at the end of the food chain, where the losses are related to retailers’ and consumers’ behaviour. The terms food losses and food wastes only refer to products that are directed to human consumption, and are not used to describe a decrease in the amounts of materials integrated in the raw
materials, such as fish skin or potato peel. Raw materials are defined at each processing stage as materials in the state they are delivered from the preceding stage; e.g. living poultry, slaughtered fish, unpeeled vegetables from the primary producer, or feathers, blood, viscera and poultry carcasses from the slaughterhouse. Mogensen et al. (2013) emphasise edibility in their study of food waste in the Danish food supply chain. They distinguish between food that could readily have been eaten by humans (i.e. real food waste), and food that could have been eaten by humans if the material in question had been treated in an optimal way from primary production until retail (i.e. hidden food waste). The term “waste” does not necessarily refer to the inherent qualities of a co-stream, but is rather a subjective term, as a material may be waste for one user and a resource for another. Therefore, we do not use the term waste in this report. Instead, the term used here to describe the utilisation of all food processing by-products, including materials that are or may be utilised for food commodities and by-products that cannot be utilised for food, is co-streams. Economically efficient co-stream utilisation implies that materials are used for products of highest possible economic value at lowest possible environmental costs. Generally, the production of feed and feed components will have higher priority than the production of fertilisers or bioenergy, and the lowest priority goes to deposition as landfill. In EU regulations, the term animal by-products (ABP) is used for co-streams of animal origin and therefore we use ABP in Chapter 4.2 (Regulations).
Food losses will decrease if co-streams that are currently not used for food can be utilised in novel food processing methods. This presupposes agreement with prevailing legislation and consumer acceptance. However, what is edible depends strongly on tradition, access to food and economic wealth, and developments in food technology may change the status of a material from inedible to edible. Will consumers be willing to eat e.g. more viscera and other animal organs currently being utilised for animal feed? Should science persuade people to do so, or should we leave people’s diets to be a personal choice?
Adler et al. Bioforsk Rapport vol. 9 nr. 82 2014 5
Figure 2. Flows of raw materials, food and co-streams from agricultural production and fishery via food processing industry, food distribution and retail to food consumption, and utilisation of co-streams for feed, bioenergy etc.
Novel processing techniques for food and feed applications have the potential to improve raw material utilisation. Such methods include e.g. fermentation, enzymatic and chemical hydrolysis. We define partial raw material utilisation efficiencies as the total mass of produced food, feed or organic materials utilised in fertiliser and bioenergy production divided by the total input of raw materials at a processing plant. We also calculated the consumption of process water per tonne of food products.
2.2
Risks related to the use of co-streams
Food processing includes cleaning and gutting steps, which accumulate co-streams that may pose a risk for infecting the environment, soil, water, crops, natural plants, wild and domestic animals2, and humans with disease or pests. For co-streams of animal origin,
detailed regulations have been developed (e.g. DEFRA, 2014), whereas vegetable and potato co-streams are regulated by laws governing general feed hygiene and disposal of organic waste.
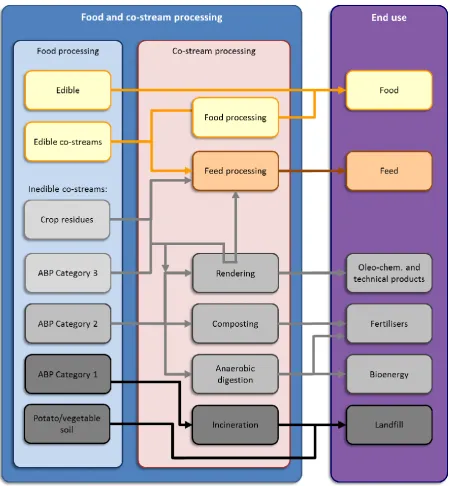
Certain animal co-streams pose a risk of infecting humans and animals with transmissible spongiform encephalopathies (TSE), also known as prion diseases. Thus, animal co-streams are divided into three risk categories (Regulation (EC) 1069/2009; Figure 3). Category 1
materials comprise the highest risk, consisting of material that may be an agent for a prion disease. Examples of this group of materials are bovine brain and spinal cord. Category 1 materials must be disposed of by incineration. Category 2 materials also comprise risks of infectious disease, and include e.g. fallen stock and digestive tract content. After
pressure sterilisation (Chapter 4.2), Category 2 materials may be utilised as a substrate
Adler et al. Bioforsk Rapport vol. 9 nr. 82 2014 6
[image:12.595.74.525.208.695.2]for anaerobic digestion, composting or rendering. Rendering converts animal fatty tissue into purified fats like lard or tallow (oleo-chemical products). Category 3 materials comprise low-risk materials, including parts of animals that are not intended for human consumption, but technologically possess a hygienic quality that could allow for human consumption. Examples of Category 3 materials are bones, skin and feathers. Besides rendering, anaerobic digestion and incineration for bioenergy production, Category 3 materials may be processed by appropriate methods (e.g. hydrolysis) and used as feed, technical products or fertiliser. Appropriate processing methods and relevant processed materials of Category 3 origin are described in Chapter 4.2.2.
Adler et al. Bioforsk Rapport vol. 9 nr. 82 2014 7
Co-streams from processing of imported vegetables and potatoes may pose a risk for infecting soil or the environment with pest organisms not yet identified in Norway, e.g. Colorado beetles (Leptinotarsa decemlineata) and plant pathogenic bacteria such as
Clavibacter michiganensis subsp. sepedonicusa and Ralstonia solanacearum. This is discussed further in Chapter 5.
Even domestic vegetable co-streams may be risk materials, because raw materials and soil are brought together from many different primary producers that may have soils infected by soil borne pathogens. Potato soil is considered a high-risk-material due to the risk of spreading pests such as potato cyst nematodes (Globodera pallida, G. rostochiensis), which have been found in a significant proportion of Norwegian agricultural land, hampering the use of such land for potatoes and other crops with intensive soil tillage for decades. Currently, soil and sludge from potato processing plants is disposed of as landfill, but the content of organic matter is often higher than is allowed in landfills according to waste regulations (maximum 10% total organic carbon or 20% ignition loss; SFT, 2008). Wet potato peel and waste products constitute a “hot spot” for microbial growth, and co-streams intended for use as food or feed have to be treated and stored appropriately.
2.3
Multiple case study
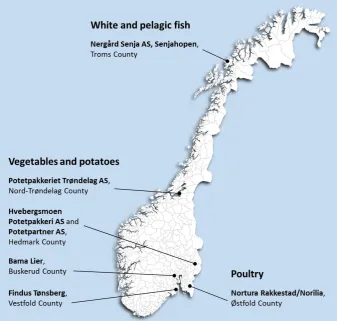
The present report is based on a multiple case study of food-processing plants in three food chains in Norway; five plants processing vegetables and potatoes, one plant
processing white and pelagic fish, and one plant processing poultry. Produsentpakkeriet Trøndelag AS, Hvebergsmoen Potetpakkeri AS, Potetpartner AS, BAMA Lier and Findus Tønsberg represent vegetable and potato processing; Nergård Senja AS, Senjahopen represents white and pelagic fish processing; and Nortura Rakkestad/Norilia represents poultry processing (Figure 4). The information described here was gathered during a visit by several scientists participating in CYCLE in June 2013 and subsequent contact with company representatives. The data included input and output of organic materials, including raw materials, food and feed products, materials used for fertiliser and bioenergy production, and materials disposed of as landfill in 2012. Additionally,
processing methods, qualitative description and temporal availability of co-streams, and consumption of process water were recorded. As a background for the empirical data, statistical information was collected regarding the total production and human
consumption of relevant food products in Norway.
Adler et al. Bioforsk Rapport vol. 9 nr. 82 2014 8
[image:14.595.73.411.416.737.2]Science meets industry; Randi Seljåsen from Bioforsk discussing with general manager Elling Ødegaard at Hvebergsmoen Potetpakkeri AS, June 2013. (Photo: Bioforsk S. Adler)
Adler et al. Bioforsk Rapport vol. 9 nr. 82 2014 9
3.
The flow of organic materials in three
food chains
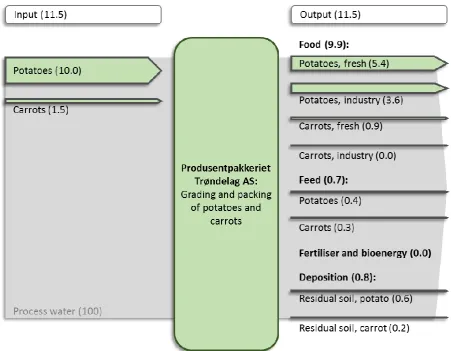
Below, the flow of raw materials, food products and co-streams is described for each case. The flow is illustrated by arrows where the arrow width is proportional to the flow in tonnes per year. The market share for each produce has been calculated, by dividing the reported food commodity production in each case by the total volumes on national level (wholesale). In addition to the flows of organic materials, we focus on the availability, qualities and properties of co-streams that may be used in production of feed, feed components, fertilisers and bioenergy.
3.1
Vegetables and potatoes
3.1.1
Production and consumption in Norway
In 2012, Norwegian farmers harvested 333,200 tonnes of potatoes; 45,677 tonnes of carrots and turnips; 36,860 tonnes of brassicas (cabbages, cauliflower, broccoli and others);
20,192 tonnes of leeks and onions; 14,896 tonnes of lettuce and chicory; 14,841 tonnes of cucumbers and 12,159 tonnes of tomatoes (FAOSTAT, 2014).
Carrot was the vegetable consumed in highest quanta per capita in Norway in 2012 (8.0 kg fresh weight), followed by tomato (7.0 kg), onion (5.3 kg) and cucumber (4.8 kg). The total amount of vegetables consumed per capita was 49.8 kg, amounting to 250,635 tonnes fresh weight in total, including 22,263 tonnes of lettuce (NFVMB, 2013). Consumption of fresh potatoes was 19.2 kg per capita (96.9 tonnes in total). The percentage of consumed
products that were domestically produced were 78% for carrot, 78% for fresh potatoes, 65% for cucumber, 59% for onion, 50% for lettuce, 34% for tomato and 51% for vegetables and potatoes in total (NFVMB, 2013).
The volumes of produce handled at wholesale level in 2012 were 40,269 tonnes of carrots, 96,867 tonnes of fresh potatoes and 9,234 tonnes of sous-vide potatoes (vacuum packed before heat treatment). In total, 200,910 tonnes of domestic and 490,192 tonnes of imported vegetables, potatoes, fruits and berries were delivered to wholesalers in Norway in 2012. The profits from sales totalled 14,500 million NOK (NFVMB, 2013).
3.1.2
Case presentations
We visited five vegetable and potato processing plants:
Produsentpakkeriet Trøndelag AS is a sorting and packing facility for vegetables and
potatoes in South Trøndelag and North Trøndelag Counties, established at Frosta in 2007. Produsentpakkeriet is a private limited company with about 140 shareholders, mainly potato and vegetable producers and receives 10,000 tonnes of potatoes, 1,500 tonnes of carrots and smaller quantities of other vegetables yearly. We estimated
Produsentpakkeriet’s market share in Norway as 6% for fresh potatoes and 2% for carrots.
Hvebergsmoen Potetpakkeri AS is a sorting and packing facility for potatoes owned by
Adler et al. Bioforsk Rapport vol. 9 nr. 82 2014 10
was the first in Scandinavia to import bananas. This explains the name of the company – BAMA (“Banan-Matthiessen”). The estimated market share in Norway for fresh potatoes packed at Hvebergsmoen in Grinder (Hedmark County) is about 30%.
Potetpartner AS is owned by BAMA Industry and Columbus Eiendom and located at
Hvebergsmoen in Grinder. Besides Potetpartner, at BAMA Industry potatoes are also processed in Moss (Østfold County) and Lier (Buskerud County). Potetpartner produces about 1/3 of the processed potatoes at BAMA (calculated by product value). Potetpartner produces sous-vide potato products from potatoes purchased from Hvebergsmoen
Potetpakkeri and imported from BAMA Trading (Denmark). The estimated market share of Potetpartner for sous-vide potatoes in Norway is 22% (for BAMA Industry in total about 60%).
BAMA Lier is owned by BAMA (92.1%) and Gartnerhallen SA (7.9%). Gartnerhallen SA is the
largest horticultural producer cooperative in Norway, with an annual turnover of 1,700 million NOK. BAMA has its headquarters and central packaging plant in Lier. In this plant, lettuce, vegetables, fruit and potatoes are processed and packed for retail stores and commercial kitchens. BAMA Lier produces for distribution to retailers (43%), caterers and institutional kitchens (57%). They have a rapid turnover system, which ensures a product ordered before 10:00 am will be in the grocery shops the day after. The estimated market share in Norway is 17% for lettuce, 1% for vegetables and 2% for fresh potatoes.
Findus Norge AS has processing plants in Larvik (Vestfold County), Tønsberg (Vestfold
County), Lier and Ullensvang (Hordaland County). In Tønsberg, Findus processes potatoes (potato chips; Norwegian pommes frites) and frozen mixed vegetables. The estimated market share for both potato chips and frozen vegetables in Norway is 75%.
3.1.3
Raw materials, food commodities and co-streams
3.1.3.1
Produsentpakkeriet Trøndelag AS
Produsentpakkeriet sorts and packs potatoes and carrots almost the whole year round, from 20th June to 20th May for potatoes and 20th July to 1st June for carrots (Figure 5). Raw
Adler et al. Bioforsk Rapport vol. 9 nr. 82 2014 11
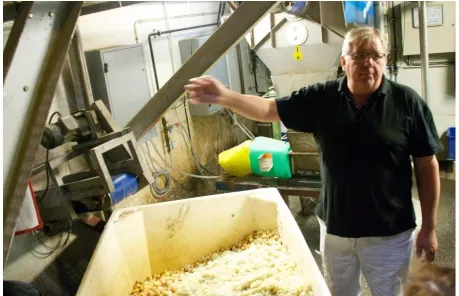
Manager Thor-Eirik Albrektsen presents the activities at Produsentpakkeriet Trøndelag AS for the scientists from the CYCLE project, June 2013. (Photo: Bioforsk S. Adler)
Adler et al. Bioforsk Rapport vol. 9 nr. 82 2014 12
Potatoes and carrots with inadequate size or mechanical damage give a poor return under the current utilisation, and ideas for utilising them as products that could generate more revenue was a topic that was much discussed during our visit. Rotten vegetables are treated as organic matter and sorted out for disposal with the soil residues. Potato soil is partly treated as dry soil in containers, and partly as sediment in outdoor tanks for sedimentation of washing water. Dry soil contains soil, stones and plant material (small potatoes), whereas the sediment contains soil, organic matter (e.g. carrot peel) and water. Due to the risk of spreading potato cyst nematodes, all residual soil and sediments from the plant are disposed of as landfill for 30 years in an area with restricted access. Since the current landfill will soon be filled up and deposition costs are high,
[image:18.595.72.524.247.598.2]Potetpakkeriet is working hard to find a more sustainable utilisation of the residual soil. About 100,000 tonnes of process water were consumed in 2012.
Adler et al. Bioforsk Rapport vol. 9 nr. 82 2014 13
Machinery for carrot washing at Produsentpakkeriet Trøndelag AS, June 2013. (Photo: Bioforsk S. Adler)
Adler et al. Bioforsk Rapport vol. 9 nr. 82 2014 14
Deposition of potato residual soil at Frosta municipality, June 2013. (Photos: SINTEF E. Bar and Bioforsk S. Adler)
3.1.3.2
Hvebergsmoen Potetpakkeri AS
Hvebergsmoen Potetpakkeri AS received about 40,000 tonnes of potatoes in 2012 (Figure 6). The main product is fresh potatoes for wholesale distribution and commercial kitchens (28,000 tonnes/year). Optical sensors (Newtec A/S, Odense, Denmark) are used to detect surface defects in the peel and decay or cracks on the tubers. Faultless potatoes of 42 to 65 mm are sold as food potatoes whereof about 90% are washed before packing. Food size potatoes with visual quality issues (3,700 tonnes) are sold to Potetpartner for further processing (next section). Potatoes smaller than 42 mm or bigger than 65 mm are sold to the food processing industry (starch, alcohol etc.) or as feed. About 1,900 tonnes of dry soil residues and 100 tonnes of sediments are disposed of as landfill, as described for Produsentpakkeriet. The use of process water was about halved after 2012, when a water cleaning plant, separating organic matter and soil, was put into operation. In 2012, about 23,000 tonnes of process water were used.
Adler et al. Bioforsk Rapport vol. 9 nr. 82 2014 15
Adler et al. Bioforsk Rapport vol. 9 nr. 82 2014 16
Optical sensors are used to detect surface defects in potatoes. Potatoes of a size within 42 to 65 mm and acceptable visual quality are sold as fresh food potatoes. Potatoes of other sizes are sold to the food processing industry. Hvebergsmoen Potetpakkeri AS, June 2013. (Photo: Bioforsk S. Adler, SINTEF E. Bar)
Adler et al. Bioforsk Rapport vol. 9 nr. 82 2014 17
3.1.3.3
Potetpartner AS
Potetpartner AS is a potato processing company located in the same site as Hvebergsmoen Potetpakkeri AS. In 2012 they processed approximately 3,000 tonnes of potatoes with visual quality issues in the peel (e.g. common scab; Norwegian: skurv). This defect does not reduce the product quality after peeling, but restricts the use as fresh potatoes. Potetpartner AS buys most of their raw material from Hvebergsmoen Potetpakkeri AS, but in 2012 they also imported approximately 400 tonnes from BAMA Trading Denmark (Figure 7). The potatoes are first peeled by a carborundum peeler, then washed and subsequently peeled two times with knife peelers. Peeled potatoes are sorted optically into three categories: 1) potatoes ready for further processing, 2) potatoes to be peeled once more and 3) feed potatoes (including potatoes with green colour). Potatoes ready for processing are graded into four categories, packed and sous-vide cooked; possibly with other recipe ingredients such as cream and seasoning. In addition, small amounts of other potato-based commodities are produced. Potato washing water contains starch, which is separated by centrifugation and mixed with discarded potatoes and given away as feed. The annual amount of dry starch produced is 200 to 300 tonnes. Annually, about 22,000 tonnes of process water is used.
Adler et al. Bioforsk Rapport vol. 9 nr. 82 2014 18
Figure 7. Flows of raw materials, food commodities and co-streams (1,000 tonnes/year, arrow width corresponds to the annual flow) at Potetpartner AS in 2012.
Adler et al. Bioforsk Rapport vol. 9 nr. 82 2014 19
3.1.3.4
BAMA Lier
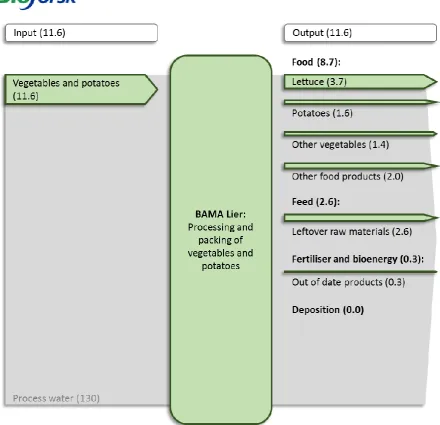
BAMA Lier has grading and packing lines for lettuce, baby leaf, other leafy vegetables, root vegetables, potatoes and fruits (Figure 8). The plant purchases over 70 different raw materials adding up to 11,600 tonnes per year. The production processes are mostly automated including receiving raw materials, removing stems etc., shredding, cutting, repeated washing procedures, drying and packing. They have equipment for modified atmosphere packaging, by replacing O2 with N2, in order to improve the shelf life.
At BAMA Lier, left-over raw materials are transported free of charge to a dairy farmer who uses raw vegetables as feed. A small share of products has to be thrown away (not
separated into organic and packing material) due to restricted shelf life if sales are lower than expected. The washing process is performed in two steps, in the first step recycled water is used and in the second step fresh water is used. About 130,000 tonnes of process water were consumed in 2012.
Adler et al. Bioforsk Rapport vol. 9 nr. 82 2014 20
Figure 8. Flows of raw materials, food commodities and co-streams (1,000 tonnes/year, arrow width corresponds to the annual flow) at BAMA Lier in 2012.
3.1.3.5
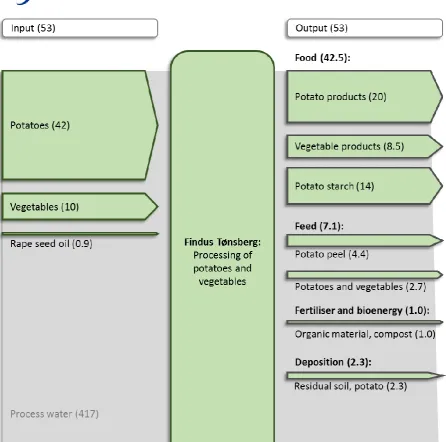
Findus Tønsberg
Adler et al. Bioforsk Rapport vol. 9 nr. 82 2014 21
Adler et al. Bioforsk Rapport vol. 9 nr. 82 2014 22
Adler et al. Bioforsk Rapport vol. 9 nr. 82 2014 23
Product fractions that are sorted out to be sold as feed. Findus Tønsberg, June 2013. (Photos: SINTEF E. Bar)
3.2
White and pelagic fish
White fish refers to sea fish living mainly on or near the seabed in contrast to pelagic fish living in the water column away from the sea floor. White fish also refers to fish with white and dry meat; white fish store oils in the liver rather than in their gut, and therefore white fish can be gutted on board of the ship. In contrast, pelagic fish store oils in their tissues and in the belly cavity around the gut. Important white fish species caught in the North Atlantic Ocean are cod (Gadus morhua, Norwegian: torsk), haddock (Melanogrammus aeglefinus, hyse), saithe (Pollachius virens, sei), Atlantic pollock (Pollachius pollachius, lyr), common ling (Molva molva, lange), silver hake (Merluccius bilinearis, hvitting), tusk (Brosme brosme, brosme), Greenland halibut (Reinhardtius hippoglossoides, blåkveite), and angler (Lophius piscatorius, breiflabb). Important pelagic fish species are Atlantic herring (Clupea harengus, sild), Atlantic mackerel (Scomber scombrus, makrell), capelin (Mallotus villosus, lodde), European sprat (Sprattus sprattus, brisling) and blue whiting (Micromesistius poutassou, kolmule).
3.2.1
Catch and consumption in Norway
Adler et al. Bioforsk Rapport vol. 9 nr. 82 2014 24
haddock (8%) and blue whiting (6%) (SSB, 2014). In 2012, Norway exported 2.4 million tonnes of fish, shrimps, shellfish and shells, including 1.1 million tonnes of farmed salmon and trout (SSB, 2014). The largest importer was Russia (13%); 64% of the caught Atlantic herring and 47% of the cod was exported (SSB, 2014).
In Norway, the consumption per capita was 22.2 kg for white fish and 4.3 kg for pelagic fish 2009 (FAOSTAT, 2014). In Finland, the per capita consumption of sea fish was lower than in Norway and with opposite proportions: white fish (2.7 kg) and pelagic fish (16.4 kg) (FAOSTAT, 2014). The per capita consumption of freshwater fish was 15.3 kg in Norway and 13.7 kg in Finland (FAOSTAT, 2014).
In 2012, available streams of white fish processing accounted to 325.000 tonnes and co-streams of pelagic fish processing accounted to 239.000 tonnes (Olafsen et al., 2013). The relatively low amount of co-streams from pelagic fish is because a large proportion is sold round, whereas a large proportion of white fish is filleted. About 98% of co-streams from pelagic fish were utilised, but only 38% from white fish. Co-streams from cod such as liver, roe, stomach, head, swim bladder, skin, milt, cheeks and tongue (Nybø, 2004; NSEC, 2011) are used for human consumption or other production of value-added products such as ingredients for health products, "functional food", pharmaceuticals or cosmetics (Olsen, 2001). According to Nybø (2004), markets for cod heads are found in the Republic of Korea, China, Hong Kong, Singapore, Taiwan and Nigeria when cleaned from blood and with gills removed. These additional operations are costly and reduce export possibilities. Swim bladder is a product of interest in Portugal and Asian countries. Roe is a popular product in the Norwegian market. Liver can be sold frozen or canned, or it can be used for production of liver oil (Olsen, 2001). Stomach, roe and milt have markets in Asian countries. However, these products must also comply with special requirements: co-streams must be obtained from large fish, separated from other visceral parts, washed, dried or prepared and packed in certain ways. All these requirements complicate selling. The backbones, which make up to 15% of fish (Gildberg et al., 2002), are currently not a product of interest for producers or sellers (Nybø, 2004). However, muscle removed from bones after splitting of cod can be salted and sold (Olsen, 2001). Bones, after solubilisation of remaining muscle proteins, can be used as starting material for recovery of gelatine and calcium (Gildberg et al., 2002). Enzymatically hydrolysed co-streams like viscera, bones and cut-off are used in the
production of fish feed, fish silage (feed) and sauces for human consumption (Olsen, 2001). White fish heads (36% of co-stream mass) and bones (19%) comprise large volumes that are poorly utilised today, and have therefor potential for development of processing
techniques.
3.2.2
Case presentation: Nergård Senja AS, Senjahopen
The business activities of the fishery group Nergård includes catching, processing and sales. Nergård has five fishing vessels and is the second-largest sea fish company in
Adler et al. Bioforsk Rapport vol. 9 nr. 82 2014 25
Representatives of Nergård Senja AS guide scientists from the CYCLE project at the processing plant at Senjahopen, June 2013. (Photo: SINTEF E. Bar)
3.2.3
Raw materials, food commodities and co-streams
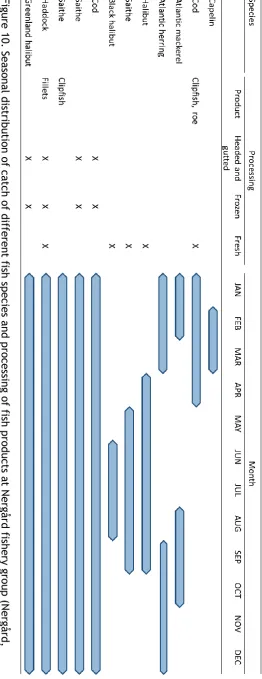
Atlantic herring was the dominant raw material at Nergård’s processing plants in 2012, accounting to almost 100,000 tonnes, whereas other fish species amounted to 61,000 tonnes (Nergård, 2012). The season for catching Atlantic herring is September to March and it is sold round, as filets or flaps (Figure 10). The season for catching capelin is February to March and it is sold round, graded or ungraded. Atlantic mackerel has two catching
seasons, August to October and January to February, and it is sold round. At Nergård, pelagic fish amounted to 78% of the total catch in 2012. In contrast to pelagic fish, white fish is headed and gutted on the vessels and the catching season for cod, saithe and haddock is all year round. However, cod for the fresh fish market is mainly caught in January to April, and saithe in May to September. Salt fish and dried salted fish (clipfish) are produced from cod and saithe. Stockfish is dried outdoors and mainly produced from cod, saithe and haddock. Frozen fillets are produced from haddock, while Greenland halibut is eviscerated and frozen round. In addition, sugar salted or frozen roe is produced from cod. Owing to the fact that about 70% of the caught sea fish is exported we have not estimated the market share for sales in Norway. Cod is economically one of the most important species and Nergård processed over 20,000 tonnes in 2012.
In 2012, Nergård’s factory at Senjahopen received about 26,700 tonnes of Atlantic herring, 7,300 tonnes of capelin, 6,800 tonnes cod and about 2,000 tonnes of other fish (Figure 11). Most of the cod heads are dried and sold to Africa. Remaining heads are cut, mixed with other co-streams, block frozen and sent to Finland as feed for fur-bearing animals. Roe and milt are separated from other viscera. Viscera are preserved with acetic acid in
Adler et al. Bioforsk Rapport vol. 9 nr. 82 2014 26
For production of silage co-streams including by-catch, backbones, skin, viscera and heads are preserved with formic acid. Annually, about 200,000 tonnes of process water, both seawater and fresh water, are used.
Adler et al. Bioforsk Rapport vol. 9 nr. 82 2014 27
Fig
ure
10
.
Se
aso
na
l di
st
ribu
tio
n
of
c
at
ch o
f diffe
ren
t fis
h sp
ec
ie
s an
d pro
ces
si
ng
o
f fish
pro
du
ct
s a
t N
ergå
rd
fis
he
ry grou
p (
N
ergå
rd,
20
12
).
[image:33.595.98.361.80.761.2]Adler et al. Bioforsk Rapport vol. 9 nr. 82 2014 28
Adler et al. Bioforsk Rapport vol. 9 nr. 82 2014 29
Heads of Greenland halibut (Reinhardtius hippoglossoides; Norwegian: blåkveite), June 2013. (Photo: Bioforsk S. Adler)
Clipfish and left-overs from clipfish production, June 2013. (Photo: Bioforsk S. Adler)
3.3
Poultry
3.3.1
Production and consumption in Norway
Adler et al. Bioforsk Rapport vol. 9 nr. 82 2014 30
meat including wild animals and reindeer (2%). The productions of poultry meat and pork have increased significantly during the last decades, whereas the production of meat from other animals has been more or less stable (SSB, 2014). Thus, the amounts of co-streams from the poultry processing industry have increased correspondingly. In 2012, the
consumption of poultry meat was higher than the consumption of bovine meat (SSB, 2014). Total meat production (slaughtered carcass) was 324,155 tonnes in Norway in 2012; pork 131,559 tonnes, poultry meat 91,156 tonnes, bovine meat 77,982 tonnes, sheep meat 22,777 tonnes and other meat 681 tonnes (SSB, 2014). Furthermore, 62,535 tonnes of eggs were produced in Norway in 2012. In 2009, per capita consumption of eggs was 11.0 kg in Norway (FAOSTAT, 2014).
3.3.2
Case presentation: Nortura Rakkestad
Nortura SA is a cooperative owned by more than 18,000 farmers and holds a market share of about 65% of poultry meat in Norway. We visited Nortura Rakkestad and Nortura
Hærland, both in Østfold County. The poultry slaughterhouse in Rakkestad will close down during 2014, and their activities will be moved to the processing plant in Hærland. Norilia is a company 100% owned by Nortura SA, to manufacture and process co-streams from Nortura slaughterhouses. Poultry is slaughtered in Rakkestad and meat is processed as a variety of products. Fresh and frozen products are sold to grocery stores and commercial kitchens. About 40% of the poultry meat produced by Nortura is slaughtered and processed in Rakkestad/Hærland, and the remaining part in Elverum (Hedmark County) and Hå (Rogaland County). Nortura Rakkestad has an estimated market share in Norway of 24% in poultry meat and 19% in fresh eggs.
3.3.3
Raw materials, food commodities and co-streams
Nortura Rakkestad slaughters and processes 25,600 tonnes of chicken and 8,600 tonnes of turkey (Figure 12). Food commodities include a variety of raw, roasted and frozen fillets, pickled fillets, meat for salads, chicken drumsticks and other products.
Mechanical deboning of meat increases the raw material utilisation at Nortura Rakkestad. Mechanically deboned meat is used in a variety of meat products such as sausages. Co-streams from this technological process include bones, tendons, cartilages and muscles. Norilia is responsible for utilisation of co-streams from Nortura and sells amongst other thingss feedstuffs for fur-bearing animals and pets. Proteins as well as lipids could be separated by hydrolysis, but this is not performed today. For bones and cartilages new products need to be developed. Annually, almost 2,000 tonnes of feathers and 1,000 tonnes of poultry blood are produced at Rakkestad (Figure 13). Today, feathers are mixed with blood and viscera, frozen and sold as feed for fur-bearing animals.
Heads, necks and feet amount to ca 3,500 tonnes and about 500 tonnes of skin may be collected from neck and feet per year. The total amount of skin is higher, because a small share of the products sold include skin. Annually, 4,100 tonnes of viscera may be
collected, intestines constitute about half of that amount and other organs such as
Adler et al. Bioforsk Rapport vol. 9 nr. 82 2014 31
Chicken viscera and chicken hearts are collected in containers at Nortura Rakkestad, June 2013. (Photos VTT M. Vikman)
A representative of Nortura Hærland presents equipment for mechanical deboning of meat, June 2013. (Photos Bioforsk A.-K. Løes)
Adler et al. Bioforsk Rapport vol. 9 nr. 82 2014 32
Adler et al. Bioforsk Rapport vol. 9 nr. 82 2014 33
Figure 13. Estimated amounts of poultry co-streams after slaughtering at Nortura Rakkestad.
3.4
Raw material utilisation efficiency
We calculated utilisation efficiencies for different materials for each case. The utilisation efficiencies were calculated for organic material outputs utilised as food, feed, and
material for fertiliser and bioenergy production. Furthermore, we calculated the efficiency of process water utilisation per output of total food products (Table 1).
On average for the seven cases of food processing plants, 75% of the organic material input is utilised for food commodities and 21% for feed products, whereas only small amounts were utilised for fertiliser and bioenergy production. The proportion of materials disposed of as landfill or lost during processing were also small. The utilisation efficiencies differed between food chains and between cases in the vegetables and potatoes chain. These differences are most likely due to the nature of the different raw materials used, but used processing methods and available equipment are also important factors, however, these factors could not be analysed in this study. Another aspect not investigated in this study is the fact that food commodity outputs contain varying proportions of inedible compounds, such as potato peel, potato residual soil, fish bones and chicken bones. These compounds may be separated by the consumer and utilised as pet food or collected for municipal utilisation such as composting or bioenergy production. The low utilisation efficiency for food commodities at Potetpartner AS may be explained by the quality of the raw material, as they receive potatoes with visual quality issues and thus a large proportion is utilised as feed. Produsentpakkeriet Trøndelag AS and Hvebergsmoen Potetpakkeri AS utilised only small amounts in feed products. Possible reasons are that a high share of the raw materials can be utilised as food products and that potato residual soil has to be deposited.
On average, process water utilisation efficiency was 8.6 tonnes per tonne of produced food commodities. The efficiency was similar for the three food chains, but the variation within the vegetables and potato food chain was huge. The process water utilisation efficiency
0
500
1000
1500
2000
2500
Leg skin
Hearts
Gizzard
Neck skin
Other viscera
Liver
Neck
Heads
Blood
Feet without skin
Feathers
Intestines
Adler et al. Bioforsk Rapport vol. 9 nr. 82 2014 34
depends on type of raw material and type of food products. Cleaning and recycling of process water decreases water consumption and environmental load. At the sea fish processing plant Nergård Senja AS, Senjahopen a share of the process water is sea water.
Based on the raw material utilisation in the studied cases we suggest to focus on
[image:40.595.67.528.212.510.2]developing feed products with higher value for more efficient utilisation of nutrients and to increase the economic value of the products.
Table 1. Raw material and process water utilisation efficiency at seven food processing plants in Norway 2012
Food chain/case Utilisation efficiency
Food mass/ raw material
Feed mass/ raw material
Material for fertiliser and
bioenergy production/ raw material
Deposition and losses/ raw material
Process water/ food mass, tonne/tonne
Vegetables and potatoes Produsentpakkeriet
Trøndelag AS 86% 6% 0% 7% 10.1
Hvebergsmoen
Potetpakkeri AS 92% 2% 0% 5% 0.6
Potetpartner AS 54% 46% 0% 0% 10.8
BAMA Lier 75% 22% 3% 0% 14.9
Findus Tønsberg 80% 13% 2% 4% 9.8
Average 77% 18% 1% 3% 9.2
White and pelagic fish Nergård Senja AS,
Senjahopen 72% 25% 0% 2% 6.4
Poultry
Nortura Rakkestad 65% 32% 3% 0% 7.6
Average 75% 21% 1% 3% 8.6
3.5
Chemical composition of selected co-streams
Adler et al. Bioforsk Rapport vol. 9 nr. 82 2014 35
Table 2. Chemical composition of selected co-streams in the food industry processing vegetables and potatoes, white and pelagic fish and poultry
Item Water,
g/kg
Energy, MJ/kg DM
Chemical composition, g/kg DM if not otherwise stated1
Other
information Reference Protein Fat
Carbo-hydrates Fibre Ash SFA2 MUFA3 PUFA4 P Ca K Mg Se, mg/kg DM
Vegetables and potatoes
Carrot 895 14.5 67 19 629 229 57 10 0 10 2.2 2.5 20.0 0.8 0.0 1 Potato5 793 15.4 82 5 762 109 45 0 0 0 2.0 0.2 18.6 1.1 0.0 1
Potato starch 160 16.6 12 0 960 17 12 0 0 0 0.1 0.2 0.2 0.1 0.0 1 Potato peel, industrial 838 - 79 - 701 153 68 - - - 2 Lettuce6 950 12.0 280 40 220 240 220 0 0 20 6.4 13.0 72.0 2.6 0.1 1
White and pelagic fish, and salmon
Alaska pollock, meat 824 16.8 1000 28 - - 51 6 6 11 8.6 1.4 12.7 1.5 1.1 1 Cod, meat 810 17.3 958 26 - - 58 5 5 11 11.4 0.6 21.2 1.4 1.4 1 Haddock, meat 798 16.6 911 30 - - 59 5 5 15 10.9 1.8 15.1 1.2 1.0 1 Saithe, meat 793 16.6 923 24 - - 68 5 5 10 11.6 0.6 20.3 1.5 1.3 1 Atlantic halibut, meat 751 19.9 751 193 - - 56 40 72 60 8.4 0.5 16.1 0.9 1.6 1 Atlantic herring, meat 712 21.4 580 313 - - 63 69 128 80 9.6 1.9 11.6 1.3 0.9 1 European plaice, meat 771 16.7 921 26 - - 52 4 4 9 8.1 0.5 18.0 1.0 1.3 1 Mackerel, meat 620 23.7 529 397 - - 74 108 134 105 6.3 0.2 12.2 0.8 1.0 1 Whiting, meat 799 16.6 910 30 - - 60 5 10 10 9.1 2.5 18.4 1.2 1.2 1 Salmon, farmed, meat 638 24.9 528 431 - - 44 83 160 133 5.8 0.1 11.2 0.7 0.5 1 Backbones, cod cleaned 78 - 388 25 - - 570 3 4 4 113 190 0.005 3 3 Backbones, mackerel cleaned 44 - 273 533 - - 222 109 192 115 86 143 0.007 3 3 Backbones, Baltic cod - - 760 - - - 280 - - - -
Collagen 240 g/kg DM
4
Liver, cod 320 21.6 68 810 - - 53 - - - 5
Milt, cod 820 3.0 806 61 - - 100 - - - 5
Adler et al. Bioforsk Rapport vol. 9 nr. 82 2014 36
Table 2. (continued)
Item Water, g/kg
Energy, MJ/kg DM1
Chemical composition, g/kg DM if not otherwise stated1 Other information Reference
Protein Fat Carbo-hydrates
Fibre Ash SFA2 MUFA3 PUFA4 P Ca K Mg Se, mg/kg
DM
Poultry
Chicken, meat
with skin 701 23.8 602 368 0 0 30 117 177 54 6.0 0.3 8.1 0.7 0.3 1 Turkey, with skin 735 19.9 792 174 0 0 34 57 45 53 7.2 0.3 10.8 0.8 0.2 1 Chicken stomach 768 20.0 784 181 0 0 34 52 47 52 5.8 0.3 8.1 0.6 0.4 1 Chicken liver 748 19.1 770 151 28 0 52 48 28 40 13.2 0.3 10.1 0.8 1.8 1 Chicken heart 740 23.6 600 358 12 0 31 96 88 100 6.8 0.5 6.8 0.7 0.4 1 Chicken bones,
femur - - 405 18 - - 525 - - - 92 200 - 2 - Hydroxyapatite, collagen 6 Chicken leg skin 388 - 156 836 - - 8 - - - 7 Chicken blood 808 - 828 14 - - 48 - - - Histidine, lysine,
methionine 8 Feathers, wet 724 - 893 31 - - 13 - - - -
Low digestibility; lack of histidine, lysine, methionine
8; 9 Chicken soft
viscera 668 - 387 475 - - 43 - - - Endogenous enzymes 8 Chicken heads
and feet 665 - 480 213 - - 157 - - - 8
Chicken various
viscera 628 - 369 455 - - 104 - - - 8
References: 1) NFA (2014), values are converted to dry matter basis; 2) VTT Technical Research Centre of Finland, unpublished data; 3) Toppe et al. (2007); 4) Skierka et al. (2007); 5) Murray and Burt (2001); 6) Suchy et al. (2009); 7) Badr (2005); 8) Okanović et al. (2009); 9) Grazziotin et al. (2006).
1 Dry matter.
[image:42.842.70.775.83.378.2]Adler et al. Bioforsk Rapport vol. 9 nr. 82 2014 37
4.
Feed production from co-streams
4.1
Feed requirements for different groups of animals
The nutrient requirements of animals depend on many factors such as species,
physiological state and environment. An animal’s feed intake is determined by its diet and is mediated by the animals’ metabolism.
The most important functions of nutrients are maintenance of bodily functions, tissue growth and production. Therefore, the synthesis of proteins in the animal is central to animal nutrition. The main groups of nutrients are proteins, carbohydrates and lipids, which are building blocks and sources for various forms of energy. Other important
components of feed are water, vitamins and minerals. For example, Ca and P are the main constituents needed in maintenance of the skeleton, and trace elements like selenium are important components of enzymes essential to maintain general health.
Energy deriving from feed is used for muscle work, tissue synthesis and heat production. The total amount of energy supplied by a single feed is called gross energy, however, only a share of it is available for the animal. Apparent digestible energy is the gross energy of the feed consumed minus the gross energy of the faeces. Apparent metabolisable energy is the gross energy of the feed consumed minus the gross energy contained in the faeces, urine, and gaseous products of digestion. Net energy is metabolisable energy minus the energy lost as the heat increment. Net energy may include the energy used for
maintenance only, or for maintenance and production.
Animals have evolutionarily adapted to very different environments by developing
strategies to cover specific nutritional requirements (Table 3). Aquatic predators like the Atlantic salmon feed at the sea on crustaceans (Crustacea) and small fishes. Farmed salmon has high protein (40 to 45%) and fat (20 to 24%) requirements, but compared to land animals salmon is very efficient in converting feed to edible protein, which is mainly because fish are poikilotherm organisms. The carbohydrate intake is limited to 12% in salmon (FAO, 2014b). Even domestic3 cats and dogs require high percentages of protein
(for maintenance, adult animals: cats 26%, dogs 18%) in the diet (AAFCO, 1993). Fur-bearing animals have similar feed requirements to carnivorous pets. Carbohydrates are not required, but small amounts of cooked carbohydrates may be included in the diet.
Carbohydrates are the principal energy source for poultry and pigs. The protein
requirement of broilers decreases from 23% (week 0 to 3) to 18% (week 6 to 8) (NRC, 1994) and the protein requirement of growing pigs decreases from 18% (body weight 10 to 20 kg) to 12% (80 to 120 kg) (NRC, 2012). However, for poultry and pigs the intake of essential amino acids is more important than the actual intake of total protein. In contrast, in ruminants microbial microorganisms digest plant fibres and are able to synthesise essential amino acids (and other nutrients), which become available to the animal when the
microorganisms are digested. Typical dry matter (DM) proportions of feed component sources are presented in Figure 14.
Some co-streams from the food industry are important supplements to the diet of
livestock4 and pets. Most likely more co-streams may be utilised as alternative feedstuffs.
We evaluated the possibilities to produce feed components for different groups of animals based on availability, chemical composition and regulations for processing and utilisation of co-streams (Table 4). Co-streams may be directly used as feed or processing may be
3 Domestication refers to artificial selection by humans.
Adler et al. Bioforsk Rapport vol. 9 nr. 82 2014 38
Table 3. Feeding behaviour and nutritional requirements of livestock and pets
Animal Atlantic salmon
(Salmo salar)
Domestic cat
(Felis silvestris catus)
Domestic dog
(Canis lupus familiaris)
American mink
(Neovison vison)
Chicken
(Gallus gallus
domesticus)
Pig
(Sus scrofa
domesticus)
Cattle
(Bos primigenius
taurus)
Ancestor Atlantic salmon African wildcat (Felis silvestris lybica)
Grey wolf (Canis lupus) American mink Red junglefowl (Gallus
gallus)
Wild boar (Sus scrofa) Aurochs (Bos
primigenius)
Feeding behaviour and feed source of wild ancestors
Carnivore (aquatic predator): aquatic invertebrates, fish; young animals are omnivore
Carnivore (predator): small mammals, birds, reptiles, insects etc.
Carnivore or omnivore and scavenger (apex predator): large herbivores such as moose and small prey such as hare
Carnivore: rodents, fish, crustaceans, frogs, birds Omnivore: insects, seeds, fruits Omnivore scavenger: including grass, roots, nuts, berries, carrion, birds, insects etc.
Herbivore: grasses, branches of woody plants, acorn
Production type for requirement
Marine grower Adult, maintenance Adult, active Fur development week 13-30, maintenance, male
Meat type, week 6-8, male,
Growing pigs Growing and finishing cattle (Angus), average weight gain 1.0 kg/d BW1 basis for
requirement
2.5 → 4.0 kg2 4.5 kg 15 kg 1.5 → 2.4 kg 2.1 → 3.1 kg 80 → 120 kg 400 kg
Daily feed intake
23 → 36 g DM/d3 72 g DM/d 55-145 g DM/d 100 → 63 g DM/d4 147 → 185 g DM/d5 2.8 kg DM/d 8-10 kg DM/d
9 g DM/kg BW 16 g DM/kg BW 11-29 g DM/kg BW 67 → 26 g DM/kg BW 70 → 59 g DM/kg BW 28 g DM/kg BW 20-25 g of DM/kg BW Requirements
Energy6 0.5 → 0.8 MJ DE/d
(minimum)
1.2 MJ GE/d 3.9 MJ GE/d 1.9 → 1.2 MJ ME/d 2.2 → 2.7 MJ/d 42 MJ ME/d 44 MJ NEm+g/d
0.20 MJ DE/kg BW 0.26 MJ GE/kg BW 0.26 MJ GE/kg BW 0.59 MJ ME/kg BW 1.05 → 0.87 ME/kg BW
0.42 MJ ME/kg BW 0.11 MJ NEm+g/kg BW
Crude protein 40-45% (minimum) 26% (minimum) 18% (performance dogs: 25%)
22-26% 18% 12% 6.8% MP7
Most limiting AA8
Arginine: 1.6% of dietary protein, lysine 1.8%, methionine 1.0%, threonine 0.8%
Methionine + cystine: 1.1% of DM
Methionine+cystine: 0.43% of DM
Methionine and cystine:
supplementation required in dry feed
Methionine + cysteine: 0.54% of DM
Lysine: 0.55% (Standard ileal digestible),
methionine + cysteine: 0.34%
Methionine: 3% of MP intake, lysine: 8.0%, (250 kg BW, gaining 0.5 kg/d) Other required AA Histidine, isoleucine, leucine, phenylalanine, tryptophan, valine Arginine, histidine, isoleucine, leucine, lysine, phenylalanine, threonine, tryptophan, valine, taurine Arginine, histidine, isoleucine, leucine, lysine, methionine, phenylalanine, threonine, tryptophan, valine
-9 Arginine, glycine,
Adler et al. Bioforsk Rapport vol. 9 nr. 82 2014 39
Table 3. (continued)
Animal Atlantic salmon
(Salmo salar)
Domestic cat
(Felis silvestris catus)
Domestic dog
(Canis lupus familiaris)
American mink
(Neovison vison)
Chicken
(Gallus gallus
domesticus)
Pig
(Sus scrofa
domesticus)
Cattle
(Bos primigenius
taurus)
Carbohydrate s
Not required, cooked, 12% maximum
Cooked only Cooked only Not required, cooked only, 10-30%
Major source of energy
Yes Major source of energy Crude lipids 20-24% No true requirement,
Minimum 9% of DM, 5.5 g/d
20% recommended 40-47% - - -
Fatty acids C20:5 n-3: 0.5% of DM, C22:6 n-3: 0.5-1.0%
C18:2 n-6: 0.5% of DM, C20:4 n-6: 0.02%
C18:2 n-6: 1.3 g/d - C18:2 n-6: 1% of DM C18:2 n-6: 0.1% of DM - Selected
minerals
Mg: -, P: 0.6% of DM, K: 0.7%, Ca: -, Se: 0.3 ppm
Mg: 0.04% of DM, P: 0.5%,
K: 0.6, Ca: 0.6%, Se: 0.3 ppm
Mg: 0.07% of DM, P: 0.4%,
K: 0.5%, Ca: 0.5%, Se: 0.3 ppm
Mg: -, P: 0.3% of DM, K: -,
Ca: 0.3%, Se: -
Mg: 0.05% of DM, P (non-phytate): 0.3%, K: 0.3%,
Ca: 0.7%, Se: 0.15 ppm
Mg: 0.04% of DM, P (available): 0.14%, K: 0.16%,
Ca: 0.4%, Se: 0.14 ppm
Mg: 0.10%, P: 0.20%, K: 0.60%, Ca: 0.34%, Se: 0.10 ppm Selected
fat-soluble vitamins
A: 2,250 IU/kg of DM, D: 1,800 IU/kg, E: 90 g/kg
A: 3,330 IU/kg of DM, D: 250 IU/kg, E: 38 mg/kg
A: 6,060 IU/kg of DM, D: 550 IU/kg of DM, E: 36 IU/kg of DM
Demonstrated, but not quantified
A: 1,350 IU/kg of DM, D3: 180 ICU,
E: 9 IU
A: 1,170 IU/kg of DM, D: 135 IU/kg, E: 10 IU/kg
A: 2,200 IU/kg DM, D: 275 IU/kg DM, E: 50-100 IU/d (added in the feed)
References 1; 2 3; 4 3; 5; 6 7 8; 9 10; 11 12; 13
References: 1) FAO (2014a); 2) FAO (2014b); 3) NRC (2006); 4) FEDIAF (2013); 5) NRC (2006); 6) Sallander (2001); 7) NRC (1982); 8) Arshad et al. (2000); 9) NRC (1994); 10) NRC (1998); 11) Chiba (2009); 12) NRC (2000); 13) Wilkerson et al. (1993).
1 Body weight.
2 Arrows indicate changes according to growth. 3 Dry matter.
4 15.0 MJ ME/kg DM.
5 Ad libitum, 12.1 MJ ME/kg DM.
6 DE digestible energy, GE gross energy, ME metabolisable energy, NE
m+g net energy for maintenance and growth. 7 Metabolisable protein.
[image:45.842.71.778.90.312.2]Adler et al. Bioforsk Rapport vol. 9 nr. 82 2014 40
Figure 14. Typical dry matter proportions of feed component sources in the diet of different animals.
Table 4. Evaluation of the possibilities to utilise co-streams from different food processing industries as feed for different groups of animals (― = not permitted, 0 = not prohibited but unlikely, U = currently utilised, P = potential for better utilisation)
Co-streams source Group of animals
Ruminants Pigs Poultry Farmed
salmon
Carnivorous pets
Fur-bearing animals
Vegetables U1 U1 P 0 P 0
Potatoes U1 U1 P 0 P 0
White fish ―2 U U U U U
Pelagic fish ―2 U U U U U
Poultry ―2 ―3 ― P4 U U, P
1 Nutritional feed, but low monetary value. 2 Allowed if hydrolysed.
3 Eggs and egg products are permitted.
4 Practiced in Chile and Canada, not practiced in Europe but legal (Commission Regulation (EC) 56/2013).
required. The aims of processing can be conservation of the material by e.g. refrigeration/freezing, drying, heat and pressure treatment or acidification, and improvement of its feed value by e.g. mechanic treatment, hydrolysis, fermentation or fractionation.
4.2
Regulations governing the utilisation of co-streams in feed
The EU Regulation (EC) 183/2005 (Feed Hygiene Regulation) lays down requirements for the hygienic quality of raw materials and animal feed in general and is the basis for the Norwegian regulation on feed hygiene; “Forskrift om fôrhygiene” (Lovdata, 2010). The responsibility for the safety of using vegetable co-streams in feed lies with the user and is not directly controlled by EU regulations. In contrast, the use of animal co-streams is heavily regulated.
0 % 10 % 20 % 30 % 40 % 50 % 60 % 70 % 80 % 90 % 100 %
[image:46.595.74.525.362.480.2]Adler et al. Bioforsk Rapport vol. 9 nr. 82 2014 41
4.2.1
Vegetable co-streams
Vegetable co-streams may be used as feed if registered in the catalogue of feed materials (Commission Regulation (EU) 68/2013); however, their presence in the feed catalogue is not proof that the material can be used as feed. The user has to show that a feed material is safe, and in which amounts it can be added into feed and for which animals. The user is also responsible to choose relevant analyses to document that the quality requirements are fulfilled. However, very detailed regulations define which nutrient levels are safe for various production animals. For example, steamed carrot peelings are listed with number 4.3.2 in the catalogue of feed materials (Commission Regulation (EU) 68/2013). This material is rich in starch, crude fibre and beta-carotene. Thus, regulations regarding these compounds must be checked. A maximum content of 80 mg/kg total carotenoids in
complete feeding stuff for poultry is allowed in the update (situation as 30 April 2004) of the list of the authorised additives in feeding stuffspublished in application of Article 9t (b) of Council Directive 70/524/EEC concerning additives in feeding stuffs. The European Food Safety Authority Panel on Additives and Products or Substances used in Animal Feed considers beta-carotene safe for the target animals and setting a maximum content in feed legislation is not considered necessary (EFSA, 2012). Following this suggestion, the
maximum content of beta-carotene in poultry feed may be removed in future.
4.2.2
Animal co-streams
The use of products of animal or marine origin in animal feed is regulated mainly by two EU regulations, the Regulation (EC) 1069/2009 (Animal By-products Regulation) and the Regulation (EC) 999/2001 (Transmissible Spongiform Encephalopathies (TSE)
Regulation). The use of products of animal or marine origin in animal feed in Norway is regulated by national regulations derived from EU regulations, as agreed in the EEA-agreement in 1994. The Norwegian regulations are “Endr. i forskrift om animalske biprodukter” (Amendment on the regulation of ABP) (Lovdata, 2011) and “Forskrift om TSE” (TSE Regulation) (Lovdata, 2004). The processing requirements for ABP are covered by the Commission Regulation (EU) 142/2011 (Chapter II “Hygiene and processing
requirements” and Chapter III “Standard processing methods”) (Implementing Regulation regarding ABP). In general, all animal and marine products intended for utilisation as feed have to come under Category 3 material.
Animals are defined as invertebrate or vertebrate animals (Regulation (EC) 1069/2009). Farm animals include animals kept, fattened or bred by humans and used for the
production of food, wool, fur, feathers, hides and skins or any other product obtained from animals or for other farming purposes, and horses. In contrast, wild animals means any animal not kept by humans. Fur-bearing animals means animals kept or reared for the production of fur and not used for human consumption (Commission Regulation (EU) 142/2011). Pet animals means any animal belonging to species normally nourished and kept but not consumed, by humans for purposes other than farming. Aquatic animals means fish belonging to the superclass Agnatha and to the classes Chondrichthyes and
Osteichthyes; mollusc belonging to the Phylum Mollusca and crustacean belonging to the Subphylum Crustacea (Council Directive 2006/88/EC, Article 3(1)(e)), Council Directive regarding Aquatic Animals).
Animal by-products are defined as “entire bodies or parts of animals, products of animal origin, or other products obtained from animals that are not intended for human
consumption” (Regulation (EC) 1069/2009). Derived products means products obtained from one or more treatments, transformations or steps of processing of ABP. The