The ecology and conservation of
green turtles (Chelonia mydas) in New Zealand
A thesis submitted in partial fulfilment of the requirements
for the degree of
Doctor of Philosophy in Marine Ecology
at Massey University, Albany, New Zealand
Daniel A. Godoy
II Frontispiece
III Abstract
Historically, little consideration has been given to the occurrence, ecology or conservation of the green turtle (Chelonia mydas) in temperate New Zealand. Located geographically at the southern boundary of the distributional range of green turtles in the southwestern Pacific, reports of this species in New Zealand are often overlooked as occasional visitors or stragglers incidentally carried by ocean currents. This convention may be reasonable when considering the temperature constrained distribution of this poikilothermic marine reptile. Despite this, green turtles have been reported in New Zealand waters for more than 100 years, yet no study has undertaken any in depth investigation as to their occurrence in this region. Therefore, this thesis investigated the presence of green turtles in New Zealand waters to test the hypothesis that their occurrence is ephemeral and incidental.
IV
of feeding in New Zealand substantially extends the southern foraging limit for green turtles in the Pacific Ocean.
Genetic analyses of ~770 base pair sequences of mitochondrial (mt) DNA was conducted on 42 stranded green turtles to characterize the genetic structure of this aggregation. Results identified 15 haplotypes including one orphan haplotype from widely dispersed green turtle stocks across the western, central, and eastern Pacific Ocean. When compared to other regional nesting rookeries and foraging grounds, the New Zealand aggregation exemplified its unique composition, predominantly due to the large proportion of haplotypes from the endemic eastern Pacific clade. These results provide a genetic link to east Pacific stocks in the southwestern Pacific; identifying previously undefined regional connectivity and trans-oceanic dispersal for eastern Pacific green turtles.
In order to assess potential human impacts, gross necropsies were conducted on green turtles found stranded in northern New Zealand between 2007 and 2013. Anthropogenic effects predominantly associated with the ingestion of plastic marine debris were identified as the likely cause for the majority of strandings in the North Island. Propeller strike and incidental capture in recreational fisheries were further shown to impact green turtles, particularly for turtles inhabiting neritic habitats adjacent to densely populated urban centres of northeastern New Zealand.
Overall, data presented here supports the hypothesis that New Zealand northern neritic habitats provide a transitional developmental habitat for immature green turtles at the edge of their range in the southwestern Pacific Ocean. Genetic analysis reveals this aggregation is unique when compared to other regional foraging grounds, exhibiting links to discrete genetic stocks from across the Pacific Ocean. In addition, the cause of the exponential increase in records observed over time remains unclear, therefore warrants further research and monitoring of this endangered marine reptile; particularly in light of climate-mediated environmental change presently experienced in the region.
V Acknowledgements
“If you change, the world changes.”
It’s hard to know when my journey began, maybe it was when I was young when I watched the undersea adventures of Jacque Cousteau or David Attenborough’s
‘The Living Planet’; maybe it evolved later, during the long night watches aboard
the R Tucker Thompson as we sailed to protest French nuclear testing in Moruroa. Whatever the catalyst, it has led me to this point, a culmination of many years work and stubborn determination to make a difference. Getting this far was no small feat, and certainly would not have been achievable without the support, inspiration and belief of many people along the way. At its inception, the research would have never got off the ground were it not for Craig Thorburn and Mike Bhana who dusted off my satellite tracking proposal and made it part of ‘Ocean Zoo’. Like me, you both saw its research and awareness potential; and let’s face it we all love a good adventure. Thanks also to Andrew Baker and Andrew Christie (AJ) for the support and laughs along the way. A big thanks to Kelly Tarlton’s and its staff for all the support (and laughs) and rehabilitation of marine turtles over the years – how things have changed for the better! As the project gained momentum, thanks to Steve Cook (Cookie) and Steve O’Shea from Auckland University of Technology (AUT) for pushing me to take on the PhD; looking back now I can thank you although a few years ago I wasn’t so sure.
VI
particularly staff from the Marine Conservation Unit, permitting, Auckland Conservancy/ field office and the Kaitaia field office. A special thanks to Clinton Duffy for the official and unofficial support over the years – now I’ll hopefully have time to dedicate to the Bigfish project. A sincere thanks to all the Iwi across the country for their ongoing support for the research and conservation of marine turtles in New Zealand, particularly to the tangata whenua of Te Tai Tokerau (Northland): Ngāti Kuri, Te Aupōuri, Ngai Takoto, Te Rarawa, Te Roroa, Te Uri-o-Hau, Ngāti Wai; and Tamaki Makaurau: Ngāti Whatua, Ngāti Manuhiri.
My thanks also extend to the wider community of the North Island who have been pivotal in the success of the project through their ongoing support, interest and actively reporting sightings of marine turtles and rescuing stranded animals. Such support would not have gained such traction if it were not for the TVNZ, Wild Film, TV and print media journalists and filmmakers who provided a platform to raise awareness and highlight the plight of marine turtles and the ocean. I also thank the many school kids around the country that I have been lucky enough to share stories with and inspire, because in turn, they have been a major source of inspiration to me, their honesty and appreciation is humbling. A massive thanks also go to those who fighting the good fight, the likes of Hayden and Ben from Sea Cleaners; Sam and Camden from Sustainable Coastlines, Samara and Kim from Experiencing Marine Reserves (EMR)/ Whitebait Connection; Schannel, Sue and Olive from Conservation International, and the huge number of teachers who inspire their students.
VII
friendship, particularly to Krista Hupman (yes you beat me to it but I’m still the Don
-), Sarah Dwyer, Sonja Clemens, Manue Martinez, Emma Betty, Cheryl Cross, Anna Meissner, Gabriel Machosvsky Capuska, Jochen Zaeschmar. To my collaborators, thanks for your contributions your help was invaluable and indeed beneficial to the quality and depth of the research. Adam and Mat, many thanks for the statistical analyses despite your own commitments. Ken Mackay, thanks for your interest in all things turtle down under. To Wendy Nelson (NIWA), Richard Willan Rick Webber (Te Papa Museum), Colin Mclay (Te Papa Museum), Clinton Duffy (DOC), Emma Betty (C-MRG) for identifying diet items and Brian Gill (ex-Auckland Museum) for sharing his historical data. Thanks to Michael Jensen (NOAA) for all the help with green turtle genetics and reference sequences. A very special thanks to my collaborators and mentors Dr. Colin Limpus and Dr. Nancy FitzSimmons, your continued support was invaluable. My deepest gratitude also goes to a friend and fellow scientist, Dr. David Feary who gave his time to review my drafts and provide great advice. Mate, you have made me a better scientist and pulled me out of so many writing holes! Those who volunteered endless hours with necropsies also deserve sincere thanks including Ale Bielli, Cat Lea, Blair Outhwaite, Zoe Lyle, and Joanna Crawford. I am also very grateful to the Institute of Natural and Marine Sciences for awarding me a Fee Scholarship, logistical support, and satellite tracking costs; AUT for initial research funding; Kelly
Tarlton’s for funding and supporting the satellite tracking programme; DOC for
logistical support and permit waivers; for travel support to present at the PEW symposium; EMR and Dargaville Intermediate; travel grants from ISTS, the Zoological Society of Auckland, and Karen Baird (New Zealand Forest and Bird).
VIII Table of contents
Frontispiece ... II
Abstract ... III
Acknowledgements ... V
Table of contents ... VIII
List of figures ... XII
List of tables ... XIV
Chapter 1 General introduction... 1
1.1 Taxonomy ... 3
1.2 Morphology and identification... 4
1.3 Growth and sexual maturity ... 6
1.4 Nesting ... 7
1.5 Range, dispersal and distribution ... 9
1.6 Phylogeography ... 13
1.7 Diet and foraging behaviour ... 15
1.8 Anthropogenic Impacts ... 17
1.8.1 Fisheries interactions ... 18
1.8.2 Pollution ... 19
1.9 Conservation status ... 20
1.10 Thesis outline ... 21
IX
Chapter 2 The spatio-temporal distribution and population structure of green
turtles (Chelonia mydas) in New Zealand... 25
2.1 Abstract ... 25
2.2 Introduction ... 26
2.3 Methods ... 28
2.3.1 Sighting, stranding and incidental capture data ... 28
2.3.2 Size-class, sex ratio and maturity ... 30
2.4 Results ... 31
2.4.1 Green turtle spatial distribution in New Zealand ... 31
2.4.2 Size-class, sex ratio and maturity ... 33
2.4.3 Seasonal patterns ... 34
2.4.4 Sea surface temperature ... 37
2.4.5 Annual trends ... 37
2.5 Discussion ... 39
2.5.1 Distribution ... 39
2.5.2 Size-class, sex ratio and maturity ... 39
2.5.3 Seasonality ... 41
2.5.4 Annual trends ... 42
X
Chapter 3 Connectivity across the Pacific: origins of green turtles (Chelonia
mydas) foraging in New Zealand waters ... 45
3.1 Abstract ... 45
3.2 Introduction ... 46
3.3 Methods ... 49
3.3.1 Sample collection ... 49
3.3.2 DNA extraction and amplification ... 50
3.3.3 Data analysis ... 50
3.4 Results ... 53
3.5 Discussion ... 59
3.5.1 Genetic structure ... 59
3.5.2 Oceanic dispersal and migratory pathways ... 59
3.5.3 Conservation management ... 62
Chapter 4 The diet of green turtles (Chelonia mydas) at a temperate foraging ground of the southwestern Pacific ... 63
4.1 Abstract ... 63
4.2 Introduction ... 64
4.3 Methods ... 67
4.3.1 Data analysis ... 71
4.4 Results ... 72
4.4.1 Diet component analysis ... 74
XI
4.5 Discussion ... 80
Chapter 5 Anthropogenic impacts on green turtles (Chelonia mydas) in New Zealand ... 85
5.1 Abstract ... 85
5.2 Introduction ... 86
5.3 Methods ... 89
5.4 Results ... 92
5.5 Discussion ... 97
5.5.1 Synthetic debris ingestion ... 98
5.5.2 Vessel collision and fisheries interactions... 100
5.5.3 Causes of mortality ... 101
5.5.4 Conclusion ... 102
Chapter 6 General discussion ... 104
6.1 Summary of research findings... 104
6.2 Future directions ... 110
Literature cited ... 113
Appendices ... 152
Appendix 1: Table S1. Chelonia mydas mtDNA control region haplotype frequencies across Pacific breeding stocks and regional foraging grounds ... 152
Appendix 2: Handling, recovery, and emergency first-response for marine turtles ………158
XII List of figures
Chapter 1
Figure 1. External structures of a Cheloniid marine turtle………...5 Figure 2. Generalised diagram of the South Pacific subtropical gyre system……...11 Figure 3. Location of New Zealand in Polynesia………13
Chapter 2
Figure 1. Distribution of green turtle records from New Zealand……….32 Figure 2. Size class frequency distribution of green turtles in New Zealand……...33 Figure 3. Predicted means from a Poisson generalised linear model of the number of sightings and strandings per quarter for 2014……….36
Figure 4. Predictionsfrom a Poisson generalised linear model of the mean of the quarterly counts of turtle records between 1983 and 2013………38
Chapter 3
Figure 1. Location of green turtle rookeries in the southwest Pacific……….52 Figure 2. Minimum spanning haplotype network showing the relationship of Pacific Ocean green turtle rookeries and the New Zealand foraging aggregation………...54
Figure 3. Immature green turtles typically encountered in New Zealand waters…..55 Figure 4. Mean curved carapace length of green turtles from the New Zealand aggregation with West/Central Pacific haplotypes and East Pacific haplotypes…...56
Chapter 4
Figure 1. Distribution of stranded and incidentally captured green turtles collected for diet component analysis from New Zealand………73
XIII Chapter 5
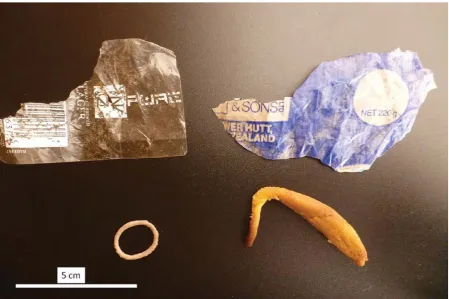
Figure 1. Ingested synthetic debris by two stranded turtles in New Zealand……….95 Figure 2. Single use plastic food packaging of New Zealand branded products found in the digestive tract of a stranded green turtle in Auckland………..96
Figure 3. Two stranded green turtles exhibiting catastrophic propeller strike
injuries……….96
XIV List of tables
Chapter 2
Table 1. Analysis of deviancetable for a Poisson generalised linear model………..35 Table 2. One-way ANOVA comparing Curved Carapace Length (CCL) of stranded turtles and the seasons in which they were recorded……….35
Chapter 3
Table 1.Chelonia mydas mtDNA control region sequence diversity across Pacific breeding stocks and regional foraging grounds………...57
Table 2. Pairwise FST values (based on conventional haplotype frequencies) and pairwise exact test p-values between New Zealand foraging ground and Pacific breeding stocks and regional foraging grounds………...58
Chapter 4
Table 1. Percentage frequency of occurrence (FOd) and mean percentage volume
(μd) of diet components from green turtles in New Zealand………..76
Table 2. Linear model (logit transform) ANCOVA results comparing the covariates: curved carapace length (CCL) and Season to response variables Vt c and Vt c…...79
Table 3. Linear model (logit transform) ANCOVA comparing the covariates: curved carapace length (CCL) and season to response variable Vd c……….79
Chapter 5
Table 1. Frequency of occurrence (%FO) and relative percentage abundance (%R) of synthetic marine debris observed in stranded green turtles in New Zealand…….94
Table 2. Frequency of occurrence (%FO) and relative percentage abundance (%R) of synthetic marine debris colours recorded in stranded green turtles in New
1 Chapter 1 General introduction
Successful conservation of threatened species requires an understanding of their biology, their relationship with the environment, as well as identifying and mitigating threats to their survival (Crowder and Norse 2005, Cooke 2008, Block et al. 2011). A fundamental aspect, therefore, is quantifying baseline information about the species’ population structure, spatio-temporal distribution and habitat use. These key objectives toward ecological knowledge are critically important for long-lived and highly migratory marine species, and particularly for those species that are also under threat by anthropogenic impacts. In this context, also determining the genetic structure and bio-geographic connectivity of a population is an important facet of their conservation (Reece et al. 2005). Only once an adequate understanding of the fundamentals of a species’ ecology is established, can conservation managers adequately investigate and identify human induced threats and develop appropriate mitigation policy. Therefore, without empirical baseline data, threatened species cannot be effectively managed to halt their decline.
2
International Union for the Conservation of Nature’s Red List of Threatened Species (Seminoff 2004).
The green turtle has a circum-global distribution, ranging throughout tropical and subtropical seas between latitudes 40qN and 35qS (Màrquez 1990, Hirth 1997).
Nesting occurs across a narrower range between 30qS and 30qN. Although considerable research has been undertaken on this species, most of our current knowledge relates to breeding adults at nesting grounds, and within its core preferred habitat of equatorial tropic and sub-tropical regions. Comparatively, very little is known of the distribution and migratory behaviour, foraging and habitat use of post-hatchlings through to sub-adult age classes. Indeed, empirical data are particularly limited for this species outside what is considered their preferred core habitat i.e. at latitudes 30qN and 25qS (Màrquez 1990).
3 1.1 Taxonomy
The green turtle was first described by Linnaeus (1758) as Testudo mydas. The generic name Chelonia was assigned later by Brongniart (1800). From a taxonomic-nomenclatural perspective, green turtles belong to the family Cheloniidae within the order Testudines. Of the seven extant species of marine turtle, all except one species (i.e. Dermochelys coriacea) fall into this clade. At a specific level, C. mydas has been the focus of considerable interest and research investigating the biogeographic, morphological, and biochemical divergence of this species (Carr 1975, Hirth 1997, Bowen and Karl 2007, Limpus 2008a). As such, several specific and subspecific names have been proposed. Within the Pacific and Indian Ocean basins, Carr (1975) proposed the separation of the green turtle into the eastern Pacific form C. agassizi (encompassing a region from Baja California to the Galapagos Islands and Peru, and westward to the Hawaiian Archipelago); and C. japonica (for the Indian Ocean and the western tropical Pacific). This bilinear designation followed on from Bocourt (1868), who first described C. agassizii as a distinct species. For the Atlantic Basin, Carr (1975) also proposed that C. mydas mydas be used for the Ascension Island population (south-equatorial mid-Atlantic); and that C. mydas viridis be used for the Tortuguero colony (Caribbean coast of Costa Rica).
More recently, the phylogeny of the green turtle has continued to be a matter of considerable interest and study. Proponents of the divergence of Chelonia into one or more distinct species or sub-species include Pritchard and Trebbau (1984) who recognised the East Pacific green turtle C. agassizi as a distinct species, yet acknowledged some degree of occasional sympatry with C. mydas in Pacific Mexico, the Galapagos and Papua New Guinea. Màrquez (1990) also recognised
4
1984, Màrquez 1990). The use of such characteristics alone has been shown to be problematic; particularly in regard to using colour as a single diagnostic tool. For example, Frazier (1971) found substantial colour variation in his study of a single population in Aldabra Atoll in the Indian Ocean. Karl and Bowen (1999) states “although the black turtle is morphologically identifiable at a low level, much of its distinction is based on size and color differences that are highly variable throughout the range of C. mydas”. Parham and Zug (1996) further recommended that the name C. mydas be used, with no formal subspecific recognition for green turtles throughout the world. Hirth (1997) supports this view, describing C. mydas
as a “circumglobal morpho-species [...] made up of several distinct populations
and metapopulations”. Bowen and Karl (2007) expand on this, postulating the
divergence between the Atlantic and Indo-Pacific green turtle populations occurred several million years ago, hence warrant the recognition of “subspecific evolutionary entities”, yet these divergences “are not sufficient [enough] to
generate reproductive isolation and speciation”. Today, C. mydas is formally
recognised as a monotypic species with a worldwide distribution across tropical and sub-tropical seas (Hirth, 1997).
1.2 Morphology and identification
5
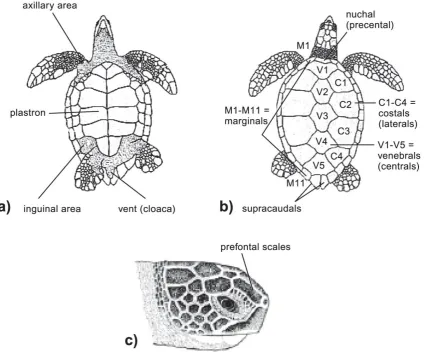
[image:20.595.90.515.302.657.2]The carapace of the green turtle is smooth, streamlined and high domed. The carapacial scutes are heavily keratinized, juxtaposed and do not overlap i.e. non-imbricate (Solomon et al. 1986, Hirth 1997, Limpus 2008a). Carapace scute arrangement consists of five vertebral scutes, four pairs of costal scutes, and twelve pairs of marginal scutes – including the supracaudals (Figure 1b). The scutes of the plastron are also heavily keratinized (Solomon et al. 1986) and comprise intergular, gulars, humerals, pectorals, abdominals, femorals, and anals (Hirth, 1997). The four enlarged inframarginal scutes lack pores. The skull has a single pair of prefrontal scales and usually four pairs of postocular scales (Figure 1c).
6
The morphology of green turtles originating from east Pacific rookeries differs slightly from green turtles from other Pacific stocks. Overall, the east Pacific green turtle is smaller in size and darker in colour – hence sometimes referred to the black turtle. The posterior edge of the carapace (over the hind flippers) concaves inward, the carapace is higher domed anteriorly, and the plastron is blotched with dark spots (Màrquez 1990, Pritchard and Mortimer 1999).
Marine turtles do not exhibit external reproductive structures, and secondary sexual characteristics only develop in mature adults (Wyneken 2001, Phelan and Eckert 2006), thus, sexual dimorphism is only detectable in large sub-adults and adults. In a study of 12 populations, Godley et al. (2002) found a consistent pattern of sexual dimorphism where adult males were smaller than adult females. Smaller adult male size has been shown in other populations in the Pacific (e.g. Australia; Limpus and Chaloupka 1997) and the Atlantic basins (e.g. Brazil; Grossman et al. 2007). Other morphometric differences that can help determine sex in mature adults are carapace morphology, elongation and curvature of the claws on the fore-flippers of males, and the most conclusive characteristic being tail length in mature males (Pritchard and Mortimer 1999, Godley et al. 2002). To date, no investigation has been undertaken into the morphological characteristics of green turtles in New Zealand.
1.3 Growth and sexual maturity
7
Growth rates for wild populations vary, yet are thought to be a function of size/maturity, the geographic location of the feeding ground, and the nutritional quality of the forage therein (Bjorndal et al. 2000, Limpus 2008a). Studies have shown that juveniles grow at higher rates than older age classes with growth in adults slowing when maturity is reached (Hirth, 1997). For example, immature turtles (small juveniles 20-30 cm straight carapace length; SCL) have exhibited growth rates of 3.6-9.0 cm/yr while in contrast, sub-adult turtles (80-90 cm SCL) have shown growth rates of 0.1-1.1 cm/yr. For the eastern Australian stocks, adult turtle (>95 cm CCL) growth is very slow and in some cases ceases all together (Limpus, 2008).
The age of sexual maturity varies considerably between populations, with estimates ranging between 26 and 40 years (Balazs et al. 1987, Limpus and Chaloupka 1997, Seminoff et al. 2002a, Koch et al. 2007, Senko et al. 2010). In Australia, sexual maturity has been estimated at between 30 to 40 years (Limpus and Walter 1980, Limpus 2008a). The mean reproductive age for nesting females for Heron Island, Australia may be about two decades (Limpus 2008a). Life expectancy for this species has been poorly quantified, however overall generation length has been estimated at ca. 35-50 years (Seminoff 2004).
In New Zealand, no study has investigated the age structure of the aggregation. However, Gill (1997) did determine the mean CCL of a small sample of stranded green turtles from New Zealand was 56.1 cm (n = 20), with a range of 41.5 cm – 90 cm.
1.4 Nesting
8
southern hemisphere, this occurs primarily between October to March with a peak in nesting activity between December and January. Nesting at locations closer to the equator can occur all year round (Obermeier 2002, Yasuda et al. 2008). In the southwestern Pacific, large nesting aggregations occur on Australia’s eastern seaboard, islands of the outer Great Barrier Reef, and islands further offshore in the Coral Sea (Limpus 2008a). Limpus (2008) suggests Raine Island in northeast Australia is the largest remaining green turtle nesting population in the world. Nesting also occurs in New Caledonia, Papua New Guinea, Solomon Islands and to lesser extent, eastward throughout Polynesia, where nesting is scattered across Tonga, Western and American Samoa, Tokelau and French Polynesia (Hirth 1971, 1997, Balazs 1983, Guinea 1993, Tuato’o-Bartley et al. 1993, Allen 2007). No nesting has been recorded in New Zealand. In the eastern Pacific, the main nesting rookeries are located on the Pacific coast of Mexico, Costa Rica and the Galapagos Islands (Ecuador) (Màrquez 1990).
9 1.5 Range, dispersal and distribution
The green turtle has a circum-global distribution, ranging throughout tropical and subtropical seas between the latitudes 40q N and 35q S (Màrquez 1990, Hirth 1997). Given the complex life history of this species, exemplified by distinct ontogenetic habitat shifts throughout their life time, green turtles occupy a range of geographical and temporal habitats. In addition, ocean currents play an important role in the dispersal and aggregation of marine turtles, thus introducing a degree of stochasticity to their distribution (Carr 1980, Bolten 2003, Luschi et al. 2003, Bass et al. 2006, Dethmers et al. 2010). The differential distribution of green turtles begins in neonate hatchlings; the life stage encapsulated from when neonate green turtles emerge from the nest until the turtle begins to actively forage for food (Musick and Limpus 1997, Boyle and Limpus 2008). This is usually only a period of days while the hatchling does not feed but survives on the yolk sac which is retained within the body cavity (Limpus 2008a). Once hatchlings emerge from the nest, they orient themselves toward the low level light horizon of the sea (Limpus 1971, Lohmann and Lohmann 1996). When they enter the water they begin what is commonly referred to as a ‘frenzied swim’ phase, keeping a constant compass course that takes them away from the coast by swimming perpendicular to wave fronts (Lohmann and Lohmann 1996, 2010). This frenzied swim episode continues for more than 24 hours and has been inferred as a strategy to quickly leave predator-abundant shallow areas near the coast to deeper waters (Gyuris 1994, Salmon et al. 2009). Following this period of frenzied swimming, the degree to which post-hatchlings undertake self-directed migrations is poorly understood. The likelihood is that this age class disperses passively (rather than actively migrates) into offshore oceanic gyre systems completing a period of development in epi-pelagic habitats as surface dwelling planktivores (Lohmann 1992, Salmon and Wyneken 1994, Boyle 2006, Limpus 2008a). Originally known as the ‘lost year’, this period is more appropriately termed ‘lost years’.
10
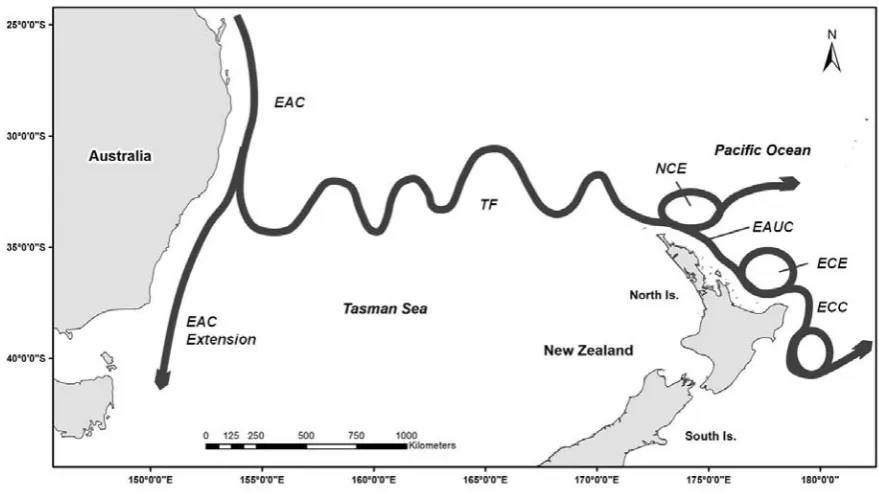
with the anti-cyclonic South Pacific Subtropical Gyre (SPSG) (Limpus et al. 1994, Boyle and Limpus 2008, Boyle et al. 2009, Pendoley and Christian 2012). For example, tag and data logger recoveries (e.g. passive integrated transponder (PIT) tags, flipper tags, and satellite tags) from juvenile and breeding adults reveal a generalised westward migration/dispersal pattern which is consistent with the direction of the South Equatorial Current (SEC) (Trevor 2010, Pendoley and Christian 2012). Marine turtles dispersing or migrating via the SEC may eventually enter the Coral Sea by zonal surface jets, then be carried southward down the East Australian Current (EAC), and potentially eastward into the Tasman Front (TF) (Figure 2). Pendoley & Christian (2012) for example, found a juvenile green turtle that had been tagged and released in Tahiti, on 1 October 1993, was eventually found at Norfolk Island, 17 months later on 4 March 1995.
Furthermore, hatchlings emerging from eastern Australian nesting rookeries are also considered to passively disperse via these same sea surface currents by way of the EAC into the western boundary of the South Pacific Subtropical Gyre (Boyle and Limpus 2008). It is in this anti-cyclonic gyre system and associated eddies, where it is believed they may reside for several years in the epi-pelagic zone. Stranding records for eastern Australia indicate post-hatchling green turtles are swept southward from southern Great Barrier Reef (sGBR) waters by the EAC, marginally past New South Wales and then out into the Pacific Ocean via the Tasman Front (Limpus et al. 1994, Walker 1994).
11
Figure 2. Generalised diagram of the main sea surface currents and associated eddies of the southwestern boundary of the South Pacific subtropical gyre system on the east coast of Australia and northeastern New Zealand: East Australian Current (EAC), Tasman Front (TF), North Cape Eddy (NCE), East Auckland Current (EAUC), East Cape Eddy (ECE), and East Cape Current (ECC) (modified from Tilburg et al. 2001).
12
1993, Lohmann et al. 2008), hence are able to return to the same geographical area to breed many decades later.
Given that New Zealand lies at the southwestern extremity of the Polynesian triangle (Figure 3), its landmass dissects the same area of the western boundary of the South Pacific subtropical gyre described previously. Its territorial waters span a considerable latitudinal range, encompassing the sub-tropical regions of the Kermadec Islands to the north (~30qS) down to the sub-Antarctic Islands at
13
Figure 3. New Zealand lies at the southwestern extremity of the Polynesian triangle, and encompasses the sub-tropical regions of the Kermadec Islands to the north down to the sub-Antarctic Islands in the south (from Pendoley and Christian 2012).
1.6 Phylogeography
14
In a study of four Atlantic Ocean and Caribbean Sea nesting colonies, Meylan et al (1990) reported sufficient genetic distinctiveness between rookeries to suggest low levels of female-mediated gene flow. In turn, their study supported Carr’s (1975) natal homing hypothesis where mature female green turtles return to their natal nesting area to breed (Meylan et al. 1990). Expanding this, Bowen et al (1992) also used mtDNA restriction sites to investigate the global population structure of the green turtle in terms of matriarchal phylogeny. They found a clear phylogenetic split between the Atlantic and Pacific Ocean Basins, low mtDNA variability overall and low mtDNA evolutionary rate compared to other vertebrates. The global phylogeographic divergence observed was posited as a result of geography (land-mass barriers of southern Africa and South America) and natal homing behaviour.
As molecular techniques progressed researchers were able to identify and isolate population specific genomic sequences at the control region of mtDNA using species targeted primers (Avise and Bowen 1994, Norman et al. 1994). Initially, these primers isolated a ~380-480 bp sequence amplified from the 5' end of the control region. Because the control region evolves faster and contains significantly more characteristic variation than other regions of the genome (Moritz et al. 1987), analyses of these segments yield higher genotypic resolution than can be obtained from analyzing nucleic restriction fragment length polymorphisms (RFLP). Norman et al (1994) demonstrated this, whereby they were able to discover a higher degree of genotypic structuring of Indo-Pacific green turtle stocks than previously identified using RFLP analysis. The discovery of genetically discrete breeding stocks occupying the same regions revealed the demographically independent nature of marine turtle populations despite their proximity; hence, illustrating the need to manage them as discrete biogeographical management units (Bowen et al. 1992, Norman et al. 1994).
15
amplification of longer sequences (~800 bp) which provide suitable resolution between stocks at foraging and developmental grounds (Abreu-Grobois et al. 2006). Understanding this aspect of their biogeographical distribution is important for wildlife managers in order to delimit specific management units that encompass the entire range and all life stages of the threatened population so that targeted conservation measures can be employed (Encalada et al. 1996, Wallace et al. 2010). Identifying and monitoring populations at foraging grounds of mixed origin stock has become an prominently critical facet of conservation management of these species at a regional level (Encalada et al. 1996, Abreu-Grobois et al. 2006).
In New Zealand, no study has investigated the genetic origin of the green turtle population and therefore the biogeographic connectivity to regional breeding stocks. For the purpose of this study, I follow Bowen and Karl (2007) and Moritz (1994), in recognizing C. mydas as a monotypic species found worldwide.
1.7 Diet and foraging behaviour
16
It is considered that at this post-settlement stage they become primarily herbivorous for the remainder of their lives (Limpus 2008a), feeding primarily on seagrass, and a wide range of algae and mangrove fruits (Lanyon et al. 1989, Read 1991, Forbes 1996, Read et al. 1996, Limpus 2008a). To facilitate this dietary transition from omnivory to herbivory, a physiological shift in digestive function of the gut occurs (Bjorndal 1980). This process leads to a change in the composition and specificity of gut microflora which allows for hindgut fermentation of seagrass and macroalgae to produce volatile fatty acids (VFA) for energy (Bjorndal 1979, 1980). In order to maximise digestive efficiency, this ontogenetic shift is posited to occur abruptly and irreversibly (e.g. Bjorndal 1979, 1980, Reich et al. 2007).
17
Zealand. As yet, no investigation has been undertaken to determine if green turtles found in New Zealand are foraging and if so, what the components of the diet are.
1.8 Anthropogenic Impacts
Human activities have had a dramatic effect on taxa worldwide which has led to a significant decline in biodiversity globally (Pereira et al. 2012). In the marine environment, key threats to species include overexploitation and harvesting, bycatch, habitat loss and degradation, and pollution (Lewison et al. 2004, Shillinger et al. 2008, Block et al. 2011, Gilman 2011). In recent decades, climate change and plastic pollution have emerged as significant drivers of environmental change and biodiversity loss at a global scale (Derraik 2002, Burrows et al. 2011). In relation to marine taxa, long-lived migratory species such as sharks, marine mammals, seabirds and marine turtles are particularly affected by human effects because they are often concurrently exposed to many cumulative impacts throughout their lives (Block et al. 2011). In addition, their life history traits lead to slow population recovery following decline (Lewison et al. 2004). In order to understand and mitigate for anthropogenic impacts, conservation managers need to initially identify species and population levels threats before appropriate strategies can be developed (Block et al. 2011).
18
and Baxter 2016, Schuyler et al. 2016). Despite the breadth of research internationally, in New Zealand, no study has investigated the potential effects of human activities upon green turtles in the region.
1.8.1 Fisheries interactions
In recent decades, the industrialisation of the commercial fishing sector has led to significant declines in non-target and protected taxa globally (Lewison et al. 2004, Block et al. 2011). Correspondingly, mortalities at sea through incidental catch from commercial fishing practices have been demonstrated to have a significant impact on marine turtle populations worldwide (Wallace et al. 2013, Lewison et al. 2014). Commercial fishery methods implicated in green turtle bycatch include trawl, seine, set net, and demersal and surface longline activities (Màrquez 1990, Hillestad et al. 1982). Although marine turtle bycatch is often underreported and inherently difficult to estimate accurately, in the southwest Pacific for example, trawl fisheries have been identified as a significant cause of decline in the eastern Australian marine turtle stocks (Limpus 2008a). In response, Turtle Excluder Devices (TED) have been used with a degree of success in Australian fisheries. Boat strikes (although not isolated to the fishing industry) have also been shown to pose to a risk to marine turtles (Gardner et al. 2003, 2006, Orós et al. 2005, Work et al. 2010, Labrada-Martagón et al. 2011, Parra et al. 2011, Denkinger et al. 2013).
19
and Griggs 2009, Godoy 2016). All incidental captures were from north-eastern North Island. Two green turtles were caught in surface longline fishery (Harley and Kendrik 2006), while another green turtle was incidentally captured in the inshore demersal/bottom longline snapper (Pagrus auratus) fishery (CSP 2010). A third record was reported from the inshore trawl fishery targeting John Dory; Zeus faber
(Abraham and Thompson 2011). All four turtles were captured and reported to have been released alive. Given the low level of reported captures, it has not been possible to estimate statistically robust capture rates of green turtles in New Zealand (Harley and Kendrik 2006).
1.8.2 Pollution
Marine pollution has been defined as any substance or energy that has been directly or indirectly introduced into the marine environment by humans that causes deleterious effect to marine life (Islam and Tanaka 2004). Accordingly, it is a hazard or hindrance to human health or activities, and causes a reduction in the quality of the sea as an amenity. Therefore, there are a myriad of potentially harmful sources of marine pollution which pose a significant threat to the marine ecosystem and species worldwide (Engler 2012, Pereira et al. 2012). Marine debris, organic and inorganic pollutants, anthropogenic noise and light pollution are some of the key factors that have negatively affected species such as seabirds (Nevins et al. 2005, Finger et al. 2015), cetaceans (Boren et al. 2006, Unger et al. 2016), fishes (Carson 2013) and marine turtles (Nelms et al. 2016).
20
this is the entanglement of green turtles in lost or discarded nets and other associated material, as well as non non-fishing related items (Oravetz 1999).
Light pollution at nesting sites has also been shown to significantly deter adult females from nesting and disorientate hatchlings as they emerge from the nest (Witherington and Martin 2000). Being positively phototactic, hatchlings during this critical emergence period can become disoriented, moving toward brighter landward light sources, rather than the desired low level sea-sky light horizon. Consequently, hatchlings moving inland and away from the sea quickly become exhausted, prone to predation, and usually die in the process (Witherington and Martin 2000).
1.9 Conservation status
Globally, the green turtle is listed as ‘Endangered’ in the International Union for
the Conservation of Nature’s Red List of Threatened Species (Seminoff 2004).
This assessment is based on a global review at the species level, stating: “extensive subpopulation declines in all major ocean basins over the last three generations...at 32 Index Sites distributed globally” (Seminoff 2004). As such, this species has been subject of various international legislative agreements and conventions to promote and facilitate conservation measures to halt the observed decline and restore populations to sustainable levels. These include the Convention on International Trade in Endangered Species of Wild Fauna and Flora (CITES) and the Bonn Convention of Migratory Species (CMS), both of which New Zealand is signatory to.
21
populations should be managed as genetically discrete units, as recommended by Bowen et al. (1992), Bowen and Karl (2007), Moritz (1994), Norman (1994), and others. Currently, no study to date has investigated the genetic origin of green turtles in New Zealand or the regional connectivity of this wide ranging species.
Under the New Zealand Threat Classification System, the green turtle is listed as a Migrant (non-breeding) species (Hitchmough et al. 2010). In New Zealand, marine turtles are protected Under the New Zealand Wildlife Management Act (1953), and as such DOC is responsible for the conservation management of these species. However, without biological information underpinned by empirical data, developing informed and appropriate management plans or policies cannot be achieved. Nationally, current standard operating procedures for the management of marine turtles are limited and fragmented. In 2007, in recognition of the paucity of appropriate stranding response procedures for marine turtles in New Zealand, Northland’s DOC conservancy commissioned an advice report to provide field staff with suitable handling and recovery procedures for stranded marine turtles (Godoy 2007: Appendix 1). Although implemented across Northland with some success, these procedures were not adopted nationally, thus, recovery efforts remain fragmented and ad hoc in other parts of the country.
1.10 Thesis outline
22
where any one breeding stock may occupy a range of different habitats across international boundaries. Hence, this species often requires collaborative management policies between affected nations.
From a theoretical perspective, understanding the spatio-temporal distribution and habitat use of this species in habitats that are generally considered outside their natural range, would extend our knowledge of this species within the context of climate change and behavioural evolution. Ultimately, this research will advance our knowledge of the biology of green turtles in New Zealand waters, providing important biological data necessary for management of these IUCN Red Listed species and their habitat, eventually leading towards development of more appropriate international conservation strategies for this globally endangered marine reptile.
1.11 Thesis structure
The thesis comprises four research chapters (Chapters 2 to 5), with an introductory and concluding discussion chapter (Chapters 1 and 6). Each research chapter has been written in a publication format and represents a manuscript that is published (Chapter 2), submitted (Chapter 5) or in preparation for publication (Chapters 3 and 4). The publication status of each chapter is included herein. The aims of each chapter are outlined as follows:
Chapter One: Introduces the species with relevance to New Zealand, providing an overview of current knowledge and gaps in our understanding, as it relates to the distribution and habitat use of green turtles in the southwestern Pacific.
23
database) and B. Gill (Auckland Museum); while additional data (2002-2013) was collected by D. A. Godoy as part of this study. Spatio-temporal occurrence data was analysed by D. Godoy with Generalised Linear Model analyses (GLM) conducted in association with co-author A. N. H. Smith. Population structure data (biometrics, sex and maturity status) were collected during necropsy of stranded turtles and analysed by D. A. Godoy. The manuscript for this chapter was written by D. Godoy and improved by edits and suggestions by A. N. H. Smith, K. A. Stockin, C. J. Limpus, and D. A. Feary. This chapter is a reformatted version of a paper published as:
Godoy, D., Smith, A., Limpus, C. J., & Stockin, K.A (2016). The spatio-temporal distribution and population structure of green turtles (Chelonia mydas) in New Zealand. New Zealand Journal of Marine and Freshwater Research, 50(4), 549-565.
Chapter Three: Investigates the genetic origin and regional connectivity of the green turtle aggregation in New Zealand waters. Skin samples from live and dead green turtles in New Zealand were collected and catalogued under permit by D. Godoy between 2006 and 2014. Genetic samples were processed and mitochondrial DNA (~800 base pair fragment) was extracted by D. A. Godoy and co-author N. N. FitzSimmons (Griffith University, Australia). Nucleotide sequence analysis was conducted by D. A. Godoy and co-author N. N. FitzSimmons. Reference haplotype sequences were compared to published sequences and unpublished sequences provided by M. P. Jensen (US National Marine Fisheries Service - Southwest Fisheries Science Centre). The manuscript was jointly written by D. Godoy and N. N. FitzSimmons, and improved by edits and suggestions by K. A. Stockin. This chapter is currently in preparation for submission:
Godoy, D., and FitzSimmons, N. N. Connectivity across the Pacific: Origins of green turtles (Chelonia mydas) foraging in New Zealand waters.
24
samples were collected by D. Godoy during necropsy. Diet components were identified by D. Godoy with assistance of W. Nelson, R. Willan, B. Marshall, and R. Taylor. Analysis was conducted primarily by D. Godoy with assistance from M. D. M. Pawley. The manuscript for this chapter was written by D. Godoy and improved by edits and suggestions by K. A. Stockin and M. D. M. Pawley. This chapter is currently in preparation for submission:
Godoy, D., Pawley, M. D. M., & Stockin, K.A. The diet of green turtles (Chelonia mydas) at a temperate foraging ground of the southwestern Pacific.
Chapter Five: Investigates the anthropogenic impacts green turtles are exposed to in New Zealand waters. Data was collected by D. Godoy during necropsy of green turtles. Analyses were conducted by D. Godoy. The manuscript for this chapter was written by D. Godoy and improved by edits and suggestions by K. A. Stockin and D. A. Feary. This chapter is currently in preparation for submission:
Godoy, D. Anthropogenic impacts on green turtles (Chelonia mydas) in New Zealand.
25
Chapter 2 The spatio-temporal distribution and population structure of green
turtles (Chelonia mydas) in New Zealand
2.1 Abstract
26 2.2 Introduction
The green turtle (Chelonia mydas) has a circum-global distribution, ranging throughout tropical and subtropical seas (Hirth 1997). They exhibit complex life history patterns which are marked by distinct ontogenetic habitat shifts, coupled with long-distance breeding and foraging migrations (Bjorndal 1997; Bolten 2003).
Accordingly, a population’s total range can be extensive – dispersing widely to
encompass coastal nesting areas, neritic foraging grounds, oceanic habitats, and migratory pathways (Balazs 1976, Hirth 1997, Lohmann and Lohmann 1998, Bolten 2003, Luschi et al. 2003, Boyle and Limpus 2008). Upon entering the ocean for the first time, neonate hatchlings immediately disperse away from shallow predator-rich coastal waters into oceanic habitats where they forage as opportunistic omnivorous macro-planktivores in the epipelagic zone (Bjorndal 1997; Boyle and Limpus 2008). During this life stage, they will remain in the oceanic habitat for a period of 3 to 10 years, before settling into neritic foraging and developmental habitats at approximately 30–45 cm Curved Carapace Length (CCL) (Balazs 1985, Musick and Limpus 1997, Zug et al. 2002, Bolten 2003, Limpus et al. 2005, Arthur et al. 2008). Once juveniles recruit and take up residence in neritic habitats, they may remain geographically localised, possibly for decades until they reach maturity (Balazs et al. 1987, Limpus and Chaloupka 1997, Seminoff et al. 2002a, Koch et al. 2007, Senko et al. 2010). From the onset of maturity, adult green turtles undertake repeated breeding migrations to nesting rookeries, eventually returning to preferred foraging grounds in between breeding episodes (Hirth 1997).
27
extended periods, adverse effects can lead to pathological and potentially fatal conditions (Schwartz 1978, Witherington and Ehrhart 1989, Spotila et al. 1997, Sadove and Pisciotta 1998, Southwood et al. 2003). Rapid decreases in temperature to below 10qC can result in ‘cold stunning’ and potentially stranding, while the lethal temperature for chelonid marine turtles in experimental conditions is ca. 8 qC (Schwartz 1978, Ogren and McVea 1995).
Temperate New Zealand is one habitat that falls outside the preferred thermal envelope (at least seasonally) for this species; where the average sea surface temperature (SST) in northern New Zealand ranges between 20-23 °C to 14 °C austral summer and winter, respectively (Chiswell 1994, Duffy 2002). Early published reports considered green turtles found in New Zealand waters as ‘waifs or strays’ or occasional visitors (McCann 1966). The most recent review of green turtle occurrence in New Zealand waters (Gill 1997), reviewed sparse sighting and stranding data spanning 125 years and reported an absence of green turtles in austral winter (July) and a significant bi-modal seasonal peak in abundance (austral summer and spring). Although this review did acknowledge that a small sample size and seasonal observer bias limited the strength of the results, this work concluded that green turtles were ‘stragglers’ from Australia or further north (Gill 1997). Green turtles were mostly observed during warmer seasonal months within northern New Zealand waters (Northland), with their influx coinciding with El Niño Southern Oscillation (ENSO) La Niña periods when SSTs were higher than the average for this region of New Zealand.
In temperate regions where SST gradually decreases to around 15 qC during winter, populations can persist year round. For example, at Moreton Bay, Australia (an important warm temperate foraging ground), green turtles actively feed at 15 °C (Read et al. 1996), while further south in New South Wales, green turtles remain active in water as low as 12 °C (pers. obs., C. J. Limpus). These winter temperatures are similar to those experienced in northern New Zealand (Chiswell
28
recent reviews that have examined the distribution and occurrence of green turtles throughout New Zealand waters. The aim of this study, therefore, was to revisit the straggler or occasional visitor hypothesis, by compiling 118 years of sighting and stranding data to determine the spatio-temporal distribution and population structure of green turtles in New Zealand. More specifically, evidence was evaluated for (1) an increase in records of turtles over recent decades, (2) persistent, year-round presence of turtles, (3) variation in turtle records with seasons, coasts (west vs east coast of northern New Zealand), and anomalies in sea surface temperature.
2.3 Methods
2.3.1 Sighting, stranding and incidental capture data
Sighting, stranding and incidental capture data from New Zealand between 1895 and 2013 were compiled to form the New Zealand Marine Turtle Sightings and Stranding Database (NZMTSSD) for this study. Compiled data included date, location, record type (sighting, stranding, or incidental capture), and, biometric data (CCL). All records from Gill (1997) were combined with validated records of sightings or strandings collected between 1997 and 2013. Sources included published and unpublished (grey) literature, validated reports from individuals of the public, and records from government and non-government organisations. In this work, “New Zealand” refers to both North and South Islands, encompassing those outlying islands on the continental shelf within the 200 m isobath and the seas out to the 200 nautical mile Economic Exclusion Zone (EEZ). Records from New Zealand’s territorial Kermadec Islands (ca. 900 km northeast of New Zealand at ~30q S) were omitted from this study because this subtropical island group is biogeographically distinct from mainland New Zealand.
29
recreational or commercial fishery activities). For the present analysis, ‘Incidental’ captures were included with all ‘Sightings’ data, as both record ‘types’ were considered to represent live, free-ranging turtles at the time of capture.
To determine variation in the mean number of records through time (within each quarter (season)-year) R software (R Development Core Team 2014) was used to fit a generalised linear model (McCullagh and Nelder 1989), assuming a log-link function and a Poisson error distribution. Counts of records were modelled using the predictors T: Type (factor with two levels: Sighting/Incidental capture and Stranding), C: Coast (factor with two levels: East and West), Y: Year (continuous), Q: Quarter (factor with four levels: Jan-Mar, Apr-Jun, Jul-Sep, Oct-Dec), QTA: Quarterly Temperature Anomaly (continuous), and ENSO: El Niño Southern Oscillation Multivariate Index (continuous). The most complex model involved fitting three-way interactions between Type, Coast, and each of the other four predictors, i.e. Y×T×C, Q×T×C, ENSO×T×C, and QTA×T×C. A backwards stepwise procedure based on the AIC criterion was subsequently applied to remove extraneous predictors. Consequently, all terms involving ENSO were removed from the model. Many two-way interactions and two three-way interactions (namely C×T×Y and C×T×Q) were retained in the model. Eight records from prior to 1983 were removed from this analysis because they were too temporally sparse to be informative.
Some specific hypotheses regarding interaction terms were tested in post-hoc analyses using the phia package in R (De Rosario-Martinez 2015). Where Year interacted with other terms in the model, a significant effect of Year within and across the levels of the interacting term was tested. Specifically, a significant effect of Year was tested within each combination of Coast and Type, while a difference in the Year-slope between Coasts within each Type was also tested. Interactions between Quarter (season) and Type and Coast were also investigated.
30
of Auckland. Averages were calculated for each quarter in each year, and then the anomaly was taken by subtracting the respective mean for each quarter across all years, giving the deviation from the expected long-term average for that quarter. Although the Leigh coastal SST dataset was collected from a single location, the data are accordant with the range, amplitude, and variability described for northern New Zealand by Chiswell (1994) and Duffy (2002). Therefore the Leigh coastal SST dataset was chosen as a suitable broad-scale regional proxy for the average long-term inshore SST regime for both coasts of northern North Island.
To investigate seasonal variations in sighting and stranding patterns between the west and east coasts of New Zealand, a two-dimensional Pearson’s χ2 test was applied. A one-way analysis of variance (ANOVA) was used to compare season (Jan-Mar, Apr-Jun, Jul-Sep, Oct-Dec) and the size of stranded turtles (CCL) to investigate the influence of SST (season) upon the stranding of different size classes. Distribution maps were created using ESRI ArcMap version 10.1.
2.3.2 Size-class, sex ratio and maturity
Standard CCL measurements (±0.1 cm) were recorded for all turtles recovered during the course of this study (Limpus et al. 1994, Bolten 1999). Biometric data were then augmented with CCL data obtained from the New Zealand Department of Conservation Herpetofauna Database, marine turtle rehabilitation records from Kelly Tarlton’s Sea Life Aquarium (Auckland), and Gill (1997). To examine the green turtle population structure CCL measurements were grouped into 5 cm size class categories and the frequency distribution described (Limpus et al. 1994, Seminoff et al. 2002b, Arthur and Balazs 2008). In addition, ‘new’ and ‘recent’ recruits were identified following the descriptions of Limpus et al. (2005).
Where dead stranded turtles were recovered during the course of the study, gross examinations were undertaken, with sex and maturity status determined by in situ
31
immature or mature (Limpus et al. 2005, Meylan et al. 2011). Sex ratio was calculated as the proportion of identifiable females in the sample. To test the null hypothesis that there was no significant departure from a sex ratio of 2:1 within the samples (the demonstrated sex ratio for green turtles within eastern Australia (Limpus et al. 2005, Limpus 2008a), a χ2 test with Yates correction factor was applied.
2.4 Results
2.4.1 Green turtle spatial distribution in New Zealand
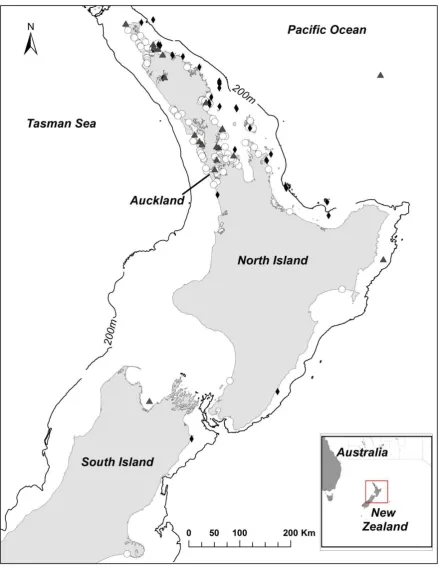
In total, 194 green turtle records were obtained, comprising 36 previously published records (Gill, 1997, encompassing records from 1985 to 1996), and 158 unpublished records (encompassing records from 1997 to 2013). Records were primarily from the North Island (north of ca. 41° S); only 3 records were reported from the South Island, with the most southerly record from Birdlings Flat, Canterbury (ca. 43.8° S). Ninety-two percent (n = 178) of all records were from Auckland northward (ca. 37° S) (Figure 1). Stranded turtles comprised 65% (n = 126) of records, while sightings and incidentally captured turtles comprised 25% (n
32
[image:47.595.100.540.114.682.2]plastron ridges, white ventral surface and sharp carapace edges characteristic of an oceanic phase individual.
33
2.4.2 Size-class, sex ratio and maturity
The size-class frequency distribution of all measured turtles (CCL) encompassed a range of 17.6–94.6 cm (μ = 51.9 cm, S.D. = 11.6, n = 86) (Figure 2). The smallest turtle recorded was considered an oceanic-phase turtle based on size (17.6 cm CCL) and morphological characteristics. The next smallest turtle had a CCL of 37.3 cm. No green turtles in the hatchling size range were observed. Of 64 turtles examined externally, 8% (n = 5) of turtles exhibited morphological
characteristics of ‘new’ recruits (μ = 40.8 cm CCL, S.D. = 3.3, range 37.3-44.8
[image:48.595.95.518.364.651.2]cm), while a further 39% (n = 25) turtles were defined as ‘recent’ recruits (μ = 45.6 cm CCL, S.D. = 2.5, range 41.9-52.5 cm); new and recent recruits comprised 47% (μ = 44.8 cm CCL, S.D. = 3.2, range 37.3-52.5 cm, n = 30) of all turtles examined externally. New or recent recruits were encountered every month of the year, suggesting no temporal pattern of settlement.
Figure 2. Size class frequency distribution of green turtles in New Zealand recorded from 1895 to 2013. Mean Curved Carapace Length (CCL) = 51.9 cm (S.D. ± 11.6 cm, n = 86).
0 5 10 15 20 25 30 35
Fr
eque
ncy
34
Of 41 green turtles examined, 15 were males, 25 were females, and one undetermined. All turtles examined were immature juveniles. In all males, the testes were undeveloped and inactive, while in all females, the ovaries were inactive, with unexpanded stroma with no sign of vitellogenesis. Expressed as a
F:M sex ratio (1.7:1), there was no significant difference from 2:1 (χ2 = 0.3, p =
0.58, df = 1 with Yates correction factor). A t-test revealed no significant difference in the size (CCL) between male and female turtles (t = 0.97, p = 0.34).
2.4.3 Seasonal patterns
The generalised linear model (GLM) selected by the AIC contained the predictors Type, Coast, Year, Quarter, QTA, and a number of interactions (Table 1). Quarter (season) effects were different among combinations of Type and Coast (Table 1). This three-way interaction was not significant at the 5% level, however, the AIC model selection process favoured retaining it in the model. Quarter had a
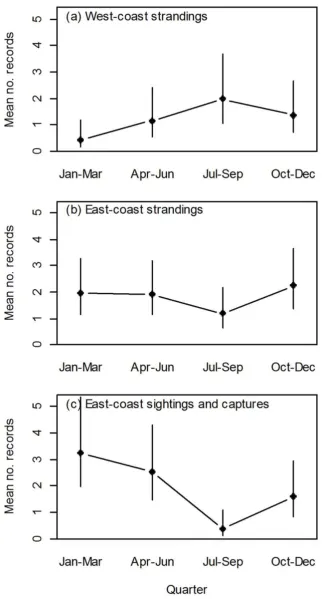
significant effect on east coast sightings (χ2 = 12.00, p = 0.0296; Figure 3c) with
July-September (winter) being significantly more likely to have low sightings. However, there was no significant effect of Quarter on strandings on the west
coast (χ2 = 8.58, p = 0.1064; Figure 3a) and east coast (χ2 = 3.32, p = 0.6899;
Figure 3b), and sightings on the west coast (χ2 = 0.90, p = 0.8255), though it is likely that these tests were low powered. Two-way interactions showed that, overall (across coasts), quarterly effects were not significant for either Sightings (χ2 = 5.78, p = 0.2457) or Strandings (χ2 = 5.25, p = 0.2457). However, Quarter
did show a strongly significant effect on the east coast overall (χ2 = 14.07, p =
0.0056), with records significantly less likely to occur during July-September (winter). This effect corresponds to the pattern of sightings described above.
Quarter did not significantly affect west coast records (χ2 = 2.03, p = 0.5654). The
35
Table 1. Analysis of deviance table for a Poisson generalised linear model of the number of green turtle records.
Predictor LR Chisq df* Pr(>Chisq)
QTA1 4.265 1 0.0389
Coast 46.221 1 0.0000
Type 16.418 1 0.0001
Year 106.986 1 0.0000
Qtr2 5.646 3 0.1302
QTA×Coast 5.852 1 0.0156
Coast×Type 7.079 1 0.0078
Coast×Year 0.01 1 0.9214
Type×Year 0.329 1 0.5665
Coast×Qtr 12.881 3 0.0049
1 QTA: Quarterly Temperature Anomaly
2 QTR: Quarter (season)
*: degrees of freedom
Table 2. One-way ANOVA comparing Curved Carapace Length (CCL) of stranded turtles and the seasons in which they were recorded (Jan-Mar, Apr-Jun, Jul-Sep, Oct-Dec; n = 76).
Source of
variation SS¥ df* MS♦ F
P-value F crit.
Between
Groups 465.708 3 155.236 1.141 0.3384 2.7318 Within Groups 9796.206 72 136.058
Total 10261.910 75
¥SS: sum of squares
♦MS: mean squares
36
37
2.4.4 Sea surface temperature
The coastal SST regime for northern North Island calculated from the Leigh dataset had a range average of 14 qC (August) to 20.6 qC (February), giving an
amplitude of 6.6 qC for the North Island’s northeast. The lowest recorded
temperature at Leigh was 12.3 qC and the highest was 23.9 qC, with an average
annual long-term mean of 17.2 qC. There was a significant negative effect of
Quarterly Temperature Anomaly (χ2 = 4.27, p = 0.0389, Table 1) on the number of
records overall, suggesting there were fewer records when it was unusually warm.
The QTA effect interacted with the predictor Coast (χ2 = 5.85, p = 0.0156) and,
when tested within Coasts, the result was significant for the west (χ2 = 9.42, p =
0.0043) but not the east coast (χ2 = 0.40, p = 0.5271). This suggests that there were more strandings on the west coast when there were unusually low temperatures recorded at Leigh. There was no evidence of more strandings on the east coast during unusually low sea surface temperatures; however, strandings were predicted to be more consistent throughout the year (Figure 3b). In addition, there was no evidence of a difference in the effect of QTA between strandings and sightings; therefore, the QTA:Type interaction was excluded by the model. There was also no detectable relationship between the El Niño Southern Oscillation (ENSO) Multivariate Index and records of turtles.
2.4.5 Annual trends
The number of green turtle reports has increased each decade since records began, with 98% of all records reported since 1983. From 1983, green turtles were reported every year, with the greatest number recorded during 2011 (18) and
2012 (25). Overall, there were more strandings than sightings (Likelihood ratio χ2
38
0.2223). However, the rates of increase in sightings over time were marginally
different between the east and west coasts (χ2 = 5.06, p = 0.0496).
39 2.5 Discussion
2.5.1 Distribution
Sighting, stranding and incidental capture data reveal a concentration of green turtle occurrence across northern New Zealand; a region of New Zealand’s landmass that dissects the western boundary of the South Pacific sub-tropical gyre system (SPSG). The SPSG and its associated currents in the southwest Pacific (Southern Equatorial Current (SEC), East Australian Current (EAC), and Tasman Front (TF)) have been described as the key transport mechanism for post-hatchling marine turtles dispersing from southwest Pacific rookeries (Boyle 2006, Boyle et al. 2009). Therefore, it seems likely that oceanic-phase juvenile green turtles passively entrained in the SPSG would eventually arrive in New Zealand via the TF and the sub-tropical East Auckland Current (EAUC) – a natural extension of the TF within the SPSG system.
The influence of the TF and EAUC upon the influx of marine reptiles was initially suggested by Gill (1997). Data presented herein support this, with 69% of the total records of green turtles originating from the northeast inshore region of the North Island. This northeast region of New Zealand is where the EAUC (and associated eddies) are the dominant oceanographic transport system (Roemmich and Sutton 1998, Stanton and Sutton 2003). The TF and EUAC have also been identified as the primary mechanism responsible for the influx of tropical fish species to New Zealand (Francis and Evans 1993, Francis et al. 1999).
2.5.2 Size-class, sex ratio and maturity
40
proportional sex ratio of 0.63 (F:M sex ratio of 1.7:1) within this study are similar to the expected sex ratio for eastern Australian foraging populations (Limpus and Walter 1980, Limpus and Reed 1985, Limpus et al. 1994). The identification of 5 new recruits in the range of 37.3-44.8 cm CCL indicates settlement occurs at ca. 40.8 cm CCL.
Only 35% of examined turtles were new or recent recruits, with the remaining 65% (n = 34), comprised of older age classes up to large sub-adults (μ 63 cm CCL, S.D. = 9.9, range 46.5–94.6 cm). If turtles settle at ca. 40.8 cm CCL as shown, this suggests these older age classes have occupied coastal neritic habitats for some time, hence exhibiting a degree of residency. The absence of mature adult turtles does suggest however, if residency does occur, that turtles are departing from New Zealand coastal areas prior to the onset of puberty. Discrete assemblages of immature age classes at neritic foraging grounds and puberty related migrations have been observed in other regions (Koch et al. 2007, Meylan et al. 2011).
Immature-dominated cohorts occupying neritic foraging areas were initially identified by Carr and Caldwell (1956) and later defined by the term
41
2.5.3 Seasonality
Further evidence supporting a temporary developmental habitat in northern New Zealand was the consistent year round occurrence of green turtles shown in the present work. Contrasting Gill (1997), this work found no correlation between ENSO (La Niña periods) and the influx of green turtles, and, despite an average winter SST of 14 qC, sightings of live free-ranging turtles were recorded in all seasons. This contradicts with the currently accepted view that green turtles appear incidentally as stragglers or occasional visitors (McCann 1966, Gill 1997). Nevertheless, data presented here detected a significant decrease in sightings on the east coast during winter, despite stranding rates remaining relatively stable throughout the year. Several possibilities may lead to lower detection probability during colder seasons: 1) a seasonal reduction in marine observers (e.g. recreational fishers and divers) during winter (Gill 1997), 2) a compensatory response to cooler water by temporarily migrating to warmer water (offshore) during winter (Mendonca 1983, Epperly et al. 1995, Ogren and McVea 1995), 3) turtles employing a ‘sit and wait’ behaviour during winter, where turtles undergo long quiescent dives of up to several hours with very short surface intervals (Hochscheid et al. 2005). Despite this, the present work does indicate a more permanent occurrence of green turtles in New Zealand’s neritic habitats than previously concluded (Gill 1997). The temperature regime described by the Leigh dataset does suggest overwintering turtles would experience some degree of temperature related stress, however, their occurrence in similarly cool winter temperatures has been observed in Australia. For example, at Moreton Bay, Australia (a permanent warm temperate foraging ground), green turtles have been shown to actively feed at 15 °C (Read et al. 1996), while in New South Wales, green turtles remain active in water as cool as 12 °C (pers. obs., C. J. Limpus).
42
in other studies (Greig et al. 1988). Therefore, it is suggested that the prevalence of stronger westerly winds and higher storm frequency during winter may substantially impact green turtle populations within the west coast, resulting in higher incidence of stranded turtles within this region. Correspondingly, a marginal decrease in stranded turtles on the east coast during winter may reflect an inverse effect, where stronger offshore westerly winds reduce the probability of stranding incidence. Similarly, a correlation between onshore storm events and turtle strandings has been observed on the east Australian coast (Boyle 2006). One unexpected result was the negative effect of the QTA where fewer records were observed when the SST (based on the QTA) was unusually warm. However, the negative effect of the QTA could be attributed to the fact that the majority of records were of stranded animals, hence, when SST are unusually warm, fewer temperature-related strandings will result in fewer stranding numbers overall during these periods. Also, no relationship between CCL and season was detected; suggesting environmental conditions are exerting equal influence across the population.
2.5.4 Annual trends