DO CROSS LISTED SECURITIES IN THE FACE OF EXTREME EVENTS
PRESENT ANY RISK RETURN BENEFITS FOR NEW ZEALAND
INVESTORS?
A thesis presented in partial fulfilment of the requirements for the degree of Master of Business Studies in Finance at Massey University, Auckland, New Zealand
ABSTRACT:
Many investors are looking for alternative investment options in todays market as correlations among markets have increased, causing diversification benefits once gained to be diminished.
This thesis examines what risk return benefits can be gained by investors from international diversification, especially cross listed securities, and how these benefits may enhance the risk return relationship in the face of extreme events. Extreme events being researched are Russian Ruble Crisis in 1998, September 11 2001, and Argentina Financial Crisis in 2002.
ACKNOWLEDGMENTS:
TABLE OF CONTENTS
ABSTRACT
ACKNOWLEGMENTS TABLE OF CONTENTS UST OFT ABLES LIST OF FIGURES INTRODUCTION LITERATURE REVIEW
Evidence and Motivations for Cross Listing EXTREME EVENTS
Ru sian Ruhle Crisis Scplemhcr I I
Argciine Financial Crisis MARKET CAPITALISATION International Country Risk Price Stabilisation
HYPOTHESIS TESTING COM PUT ATIO AL METHODS
PORTFOLIO FORMATION AND RESEARCH DESIGN FORMATIO OF DATASETS EMPLOYED
LIST OF TABLES
Table I -Real GDP and Consumer Prices: Argentina 1994 - 2002 Table 2-Total Number of Companies with Shares Listed
Table 3- Market Capitalisation of Shares of Domestic Companies Table 4-Total Value of Share Trading
Table 5-Comparison of Average Share Price in 1990 and 2000
Table 6-Australian Price Earnings, Returns Indicators and Inflation Rate Table 7-Japanese Price Earnings Ratio, Return Indicators and Inflation Rate Table 8- New Zealand's Price Earnings Ratio, Return Indicators and Inflation Rate Table 9 -South Africa's Price Earnings Ratio, Return Indicators and Inflation Rate
Table I 0 -The United Kingdom· s Price Earnings Ratio, Return Indicators and Inflation Rate Table I I-Stock Markets Importance in the National Economy
Table 12 - International Country Risk Ratings for Period 1984-2003
Table 13 -Comparison of the return and risk for the portfolios. demonstrating the benefits of the addition of cross listed securities into a portfolio
Table 14 -Ranking of the portfolios in terms of risk and return Table 15-Ranking of Portfolio Performances
Table 16 -The Risk/Return Relationship for markets researched Table 17 - Comparison of Average Risk/Return for Extreme Events
Table 18-Portfolio Risk and Return in comparison to single and multi indices Table 19- Weighting Techniques and portfolio performance measures Table 20- Portfolio Betas
LIST OF FIGURES
Figure I: Daily exchange rates of Russian Ruble per US Dollar
between June 1998 and June 1999 24
Figure 2- Dow Jones Industry Average for the period between December
2000 and December 2004 30
Figure 3-Latin America and Argentine Stock Indices for December 1999 to
June 2002 37
Figure 4 - International Country Risk Ratings 56
Figure 5 -Price Volatility of Australian Share Prices versus Australian Cross Listed Share Prices 60 Figure 6 - Price Volatility of Japanese Share Prices versus Japanese Cross Listed Share Prices 60 Figure 7 - Price Volatility of UK Share Prices Versus UK Cross Listed Share Prices 61 Figure 8 -Price Volatility of South Africa Share Prices Versus South Africa Cross Listed Share Prices 61 Figure 9 -Price Volatility of New Zealand Share Prices Vcrsu New Zealand Cross Listed Share Prices62 Figure I 0-Risk Return relationship for Portfolios
Figure I I -Portfolio risk/return during September I I
INTRODUCTION
This research examines whether cross listed securities exhibit higher levels of diversification, and show any risk return benefits over single listed securities in the face of extreme events. These questions may seem obvious due to the extensive research which has been conducted concerning international diversification, and the benefits to investors and companies gained from cross listing. Nevertheless, little research has focused on these topics in relation to extreme events.
There are several reasons why cross listing may not enhance investors risk return benefits in the face of extreme events. Firstly, diversification benefits have been stated to have been diminishing over time a markets have become more integrated through international trade, common currencies, stock markets and shared resources. With increased market integration, correlations between the markets have also increased, lowering diversification benefits. Greater diversification benefits are gained with low or negative correlations between portfolio securities. This leads to the second factor that may lower the benefits to investors during extreme events. It is expected that markets will react in the same way to an extreme event, causing market correlations to increase and reduce diversification benefits. This expectation is especially so for cross listed securities, due to cross listed securities being exposed twice to the foreign and domestic markets, instead of only to the domestic market as for single listed securities. Nevertheless, some researchers state that cross listed securities are able to mitigate the effects of extreme events through their unique structures. Finally, there is much debate about the benefits versus the costs of cross listing and what, in real terms, can be achieved through cross listing. For example, if there are so many benefits why is it that only one in ten US companies are cross listed on a foreign market?
LITERATURE REVIEW
International diversification and portfolio performance have been widely researched to attempt to establish the level of international diversification benefits that can be achieved by investors. International diversification is resultant through the addition of securities/ bonds/derivatives into a domestic portfolio, with the purpose of reducing unsystematic risk. Greater diversification benefits can be achieved if there are imperfect correlations between the securities. By adding securities which are negatively correlated to one another, it is possible to diversify risk to a level equivalent with the market risk. Unfortunately, diversification is unable to eliminate the volatility of market segmentation factors (systematic risk), which is associated with all markets. As regards international diversification, as systematic risk differs between markets, it is possible to achieve a world systematic risk level (Reilly and Brown, 2003).
Speidell and Sappenfield conducted a study in 1992 which demonstrated the benefits investors can gain through international diversification. They used the S&P 500 index to represent the domestic market and the EAFE index (Europe, Australia and Far East) to represent international securities. They found that a portfolio comprising I 00% of the S&P 500, resulted in a return of l 5.8%, with a risk measured by standard deviation of 17 .1 %; representing the return for a domestic portfolio and the portfolio risk, respectively. Combining a 10% mix from the EAFE with a 90% mix from the S&P 500, an increase in the return (to 16.1 % ) was achieved, and risk was reduced (to
is between 30-50%. Beyond this point the benefits start to diminish, indicating that the addition of international securities into a domestic portfolio can result in diversification benefits in the form of lower risk or higher returns.
Early works of international diversification found the risk/ return benefits to be significant. For example, Grubel ( 1968) found large benefits for investors through international diversification. This finding was supported by Hunter and Coggin ( 1988), who found that international diversification reduced systematic risk to circa 56% of risk of a domestic portfolio held in the US. Solnik (1974) found that through the additional of international securities into a US domestic portfolio the portfolio risk could be significantly reduced.
Hauser, Marcus and Yaari (1994), however, hedging foreign exchange movements reduces the diversification benefits from international investments. Nevertheless,
Dun is and Levy (2001) showed that additional di versification benefits can be achieved through exotic currency hedging using a currency overlay programme.
There is significant disagreement over the existence of international diversification and the benefits that they provide to investors. Some researchers believe that as time has passed, markets have become more integrated and relationships between countries have strengthened, causing diversification benefits to diminish.
Speidell and Sappenfield ( 1992) have put forward four main arguments as to why diversification benefits are shrinking into today's markets. Firstly, there are an increasing number of institutional investors. This has arisen due to an increase in the variety of investment options available to investors, coupled with the ease of investing in mutual and equity funds, which provide larger, stabilised returns. This has increased the size and number of institutional investors trading in today's markets. As institutional investors become a larger proportion of the trading numbers, the number of key decision makers lowers, increasing the power and importance of the trading decisions made by such traders. In the US 70% of trading volume is currently made up of institutional investors, compared to 40% in the 1960s.
If one security moves in either direction the other index stocks, therefore, tend to
follow, causing buying and selling decisions of larger traders to become very important. If they decide to participate within a large trade of an indexed stock, other stocks of the index are affected by thi and react accordingly. Such an effect can result in the market being influenced by the behaviour of other stocks.
Thirdly, markets are increasingly being classified and treated as one as the world economies become more integrated through trade relationships, common currencies and increased tourism. These factors increase the importance of stocks on these markets and affect the value of other markets within clo e geographical proximately. This has recently been the experience in Europe through the introduction of the Euro.
Finally, companies have become more mutually dependent on one another as they are no longer country specific. The number of multinational companies has increased tenfold in the last ten years, causing market correlation to increase, which, in turn, decreases diversification benefits.
study period. Fooladi and Rumsey (2002) concluded, therefore, that although country and market integration has increased there is no significant reduction in the di versification benefits achieved.
Solnik, Boucrelle and Le Fur ( 1996) agreed with Speidell and Sappenfield ( 1992) that the integration of international markets has increased and that, over time, correlations are changing. This has caused the diversification benefits to decrease, especially in the face of extreme events.
As the behaviour of markets and investors has changed, these market decision makers have looked at alternative options to achieve greater returns. A common strategy is cross listing, which enables the investor to gain international diversification benefits without having the common difficulties of investing globally. Miller ( 1999) found that when a company announced a US listing, abnormal returns of 1.54% resulted for a firm listing from an emerging market, and 2.63% resulted for a firm listing from any other exchange. Other studies (such as that of Foerster and Karolyi, 1999) found excess returns in the weeks prior to listing, but negative excess returns of -0.14% per week during the listing period. This makes it difficult to determine whether any benefits, besides excess returns at the time of listing, are evident. Investors and companies need to evaluate the benefits from cross listing when considering their investment options in the current turbulent market.
Evidence and Motivations for cross listing
There is significant evidence of benefits that can be achieved by compames and investors from cross listing. Pagano, Roell and Zechner (2002) summarised the
motivations for cross listing as follows:
1. Reducing Barriers for Foreign Investors and Creating a Larger Investor
Base
Cross listing allows companies to enter foreign markets that may have been closed in the past due to barriers to entry based on legislative, political or economical factors. Entering new foreign markets gives the company the potential to enlarge their investor base. An enlarged investor base allows for greater information
sharing across markets, providing opportunities for investors to trade upon this information before prices in other markets respond to the new information. The more information shared and known about a company, the less risky it is to hold as part of a portfolio, as less speculation about the security is required. The risk for
a company is measured by its beta; a beta measures the security's systematic risk compared to that of the overall market. The lower the risk, the lower the beta will be. Companies with lower betas are able to achieve lower costs of capital through
lower entry barriers into foreign markets due to higher market segmentation. Factors affecting market behaviour are; transaction costs, regulation, taxes, competition, legislation and asymmetrical information. Through inconsistent
market pressures and differing levels of information, informed traders of cross
listed securities are able to trade on their information and gain higher returns. Merton ( 1987) revealed that when firms cross list, there occur opportunities for
and gain benefits from it. Lang, Lins and Miller (2003) found that cross listed securities had better information flows, resulting in higher market valuations.
2. Relying on Foreign Expertise
Companies are motivated to cross list on markets with superior expertise and knowledge. Greater expertise is gained through a higher number of analysts following a particular industry. With more analysts following an industry, the greater visibility a company in that industry will have, and a higher level of publicly available information will result. Analysts provide information about historical trading data, major decisions within the company, management, key suppliers, contractors and the future direction for the company. More analysts are allocated to industries, or companies, with high dollar values, as traders are more interested in information relating to the larger market movers. This situation is of particular interest to securities listed on smaller exchanges, as the number of analysts utilised in such markets is significantly lower than in the developed markets. Greater visibility for these companies can be achieved through listing on larger markets, such as the Nasdaq in the US or FfSE in London, which have higher analyst followings.
the London Stock Exchange. This can be partially explained by the higher costs associated with listing in New York.
3. Committing
to Higher Disclosure
and Corporate Governance Standards
and a Lower Cost of Equity
Companies deciding to cross list on foreign exchanges often have higher disclosure requirements in foreign markets than in their home market. If a company chooses to disclose more accurate information, investors have more knowledge of the company and holding the security is Jess risky. Companies can benefit from greater disclosure, as they are able to obtain a lower cost of capital in the foreign market than in their domestic market.
security will be more likely invest in the security. Higher cash flows can be achieved through higher disclosure, lowering agency costs as information is already disclosed to investors. These factors all result in helping to increase the market value of the company.
Koedijk and Yan Dijk (2004) tested the estimates for Cost of Capital for cross listed securities in nine different countries. They hypothesised that cross listed securities cost of capital would be different. They found that asset pricing models yielded different estimates of cost of capital. In the US, the difference was about 50 basis points lower, 80 basis points in the UK and 100 points in France. The only drawback is that only 12% of cross listed securities experienced the benefits. This is supported by Errunza and Miller (2000) who examined 126 firms from 32 countries and there results showed a decrease in cost of capital of 42%, which was achieved from US investors being able to invest in foreign markets.
4. Liquidity
Stoll (1978) found that greater competition among markets will cause the bid ask spread to lower, as a greater following of investors is generated from the company being listed in two different markets.
Noronha, Sarin and Saundagaran (1996) found contradicting results on the bid ask spread as they examined the impact of NYSE/AMEX stocks which were cross listed on the London or Tokyo stock exchanges. They found that spreads did not narrow (as Stalls found in 1978), but they did find that following a foreign listing the depth of the quotes improved. This occurred through a greater investor base, as a result of the diversification into another market. It needs to be noted, however, that the improved depth disappeared once changes in price, volume and return variance were taken into account.
5. Relative Mispricing
Firms which are cross listed are able to take advantage of the overvaluation of shares traded abroad compared to that of the home market. Through inefficient information flows, shares on the foreign market can become over- or undervalued compared to the home market, and vice versa, because of differing levels of information being available in different markets. This can occur as one market can close for the night while another is just opening. Through the mispricing of securities, and incorrect information flows, investors can take advantage of the situation and achieve higher returns.
result provided evidence that the US markets and securities adjusted their prices to reflect information already known in the UK, which had been revealed during the previous trading session.
6. Capitalising on Product Market Reputation
Companies selling products in foreign countries, should cross list on a market where their brand name and product are known by investors. Foreign sale success and popularity within an economy creates a competitive advantage, and the company should use this to drive competition and visibility for their stock, which will result in higher sales for the company. It is assumed that companies with high foreign sales will have a greater advantage in cross listing due to their existing visibility in foreign markets.
7. Costs of Cross Listing
Costs of listing abroad are relatively low compared to the benefits which can be gained from listing. There are a variety of listing fees, direct expenses and professional costs that need to be accounted for when listing a company; and these can vary depending on which market the company is cross listing on. US markets have the highest listing fees.
found that only two were cross listed, indicating that only larger firms can afford to cross list.
Based on these motivations and evidence why do less than one in ten large companies in the US have a foreign listing, while in other developed markets the ratio is even lower, when it appears that many benefits exist for both the company and the investor? Doidge, Karolyi and Stulz (2004) found that foreign companies cross listed in the US had a Tobins q 16.5% higher than firms which were not cross listed. This results in cross listed companies having higher valuations, with the difference between cross listed and non listed companies being statistically significant even after controlling for firm and country characteristics.
A number of companies have chosen to cross list on a foreign market to try and stabilise their company returns due to the increased volatility of market returns and correlations during the last ten years. This has been demonstrated through five financial crises occurring within this period: Brazil, Argentina, Mexico, Russia and Asia.
Financial cnses and extreme events are becoming more frequent, and cause major shocks through economies and stock markets. Financial crises normally arise from incompatible fiscal and monetary policies, weak financial institutions, fixed exchange regimes, high foreign debt, outflows of capital and loss of investor confidence.
twenty-three macroeconorruc factors. They found that the crises were mainly caused by
traditional variables which were common across all the crises. These were high public
debt, private sector liabilities, current account deficits, poor M2 to reserves ratios, foreign liabilities of banks, inflation, unemployment and overvaluation of real exchange rates. All of these factors existed within the financial crises which occurred within Russia and Argentina, and will be examined in this research.
Schwebach, Olienyk and Zumwalt (2002) found that low correlations exist between domestic and foreign securities, however at times of extreme events (especially after the Asian crisis), the correlations and volatility of the eleven foreign markets
researched increased, causing diversification benefits to decrease. Meyer and Rose (2003) measured the effects of international diversification in the face of an extreme event (the Asian Crisis). They used a New Zealand-only unit trust as their base
investment and added other global unit trusts to observe the impact on risk and return during the Asian Crisis. Over the six year holding period, it was found that the introduction of global investments reduced the shocks of the crisis compared to those experienced by a purely domestic option.
In view of the mixed results in regards to international diversification and cross listing, our current research considers the possibility that cross listed securities will provide greater diversification benefits in terms of risk and return in the face of
two markets. This results in more stabilised returns and risks, especially in the face of extreme events.
Three extreme events will be researched in this paper; the Russian Ruble Crisis in 1998, the September 11 terrorist attacks in 2001 and the Argentine Financial Crisis in 2002. Below is a summary of the crises to give background on the main drivers
EXTREME EVENTS
Russian Ruble Crisis
The Russian economy was in disorder after the ruble was devalued on August 17, 1998.
Figure 1: Daily exchange rates of Russian Ruble per US Dollar between June 1998 and June 1999
Daily Exchange Rates: Russian Rubles per US Dollar 5.0
7.5
10.0
12.5
15.0 17.5
20.0
22.5
25.0 'Zl.5 Jun
98 Ju98 l
\
r
"I
Mr
.
Oct 98
'\
.
v ...
\
4.r
1
...
Nov Dec Jan 98 98 99
'11
Feb Mar99 99
v
Sourced from University of British Columbia, Vancouver BC, Canada
JtJ
f.-t
~v
AP-r May 99 99
The devaluation of the ruble was the first outward indication that the Russian
economy was in trouble, but many other factors contributed to the downturn within
the Russian economy.
One of the factors that caused an upset within the economy was a significant increase
in inflation. Consumer prices rose 4.3% during each of the first seven months of 1997,
rising again (by 15%) in the latter part of August, and again in September. In total
prices rose over 40% for the year. The increase in inflation was partly due to the
of retail sales in Russia and the devaluation in the ruble drove up import prices, which
contributed to the increases in consumer prices.
The second cause was the Joss of investor confidence; which had not fully recovered
since the Asian Crisis in I 997; towards emerging markets and their stability. The
concerns shown by investors regarding the economy, coupled with the deterioration of
the Russian current account, attributed to significant outflows of cash from the
economy.
In 1996 the country had a current account surplus of US$1 l.l l billion, which
deteriorated to US$3.3 billion in 1997 due to the decrease in prices of Russia's key
exports of gas and oil. The trade surplus also reduced due to the tightening economy,
from US$23. I billion to US$ l 7.3 billion, in 1997. The trade and current accounts
reduced in 1998, with the current account showing a deficit of US$ l.5 billion after the
first quarter of 1998.
With a weakening economy the stock market also reacted to a Joss of investor
confidence and the continual devaluation of the ruble, with the stock market falling
over 60% between mid August and the end of 1998. The deterioration of the stock
market had begun in 1997 after the Asian Crisis, but had started to show some
recovery signs. By October 1998, however, stock prices had fallen by more than 82%,
from their pre-Asian Crisis levels.
The many failed attempts to build infrastructure within the Russian economy by the
the Russian economy. In 1992 Russia had introduced the essential elements required to rebuild the economy, but failed to follow through with the structural changes
essential to make these work. The government failed to provide the effective laws and regulations to battle tax evasion and the widespread corruption existing throughout the
business and political sectors. The judiciary and the government were too weak and corrupt to enforce the existing laws, which resulted in weak points within the
economy becoming overloaded. Government instability was the final straw that tipped the economy into a crisis in August 1997. President Boris Yeltsin fired Prime Minister Kirienko and ousted the government on 23 August. Yeltsin nominated Yiktor
Chermomyrdin to replace the Prime Minister, believing that Chermomyrdin would be the best person to turn the economy around. This appointment had to be approved by the Duma (parliament), which had already rejected Chermomyrdin twice. The system dictated that if they rejected him again the Duma would have to be re-elected. Instead
of continuing with this government instability, President Yeltsin tried to save the economy by nominating Primakov, who was accepted by the Duma. This move proved to be ineffectual, however, as the financial crisis was by this time already well set in.
On 17 August the Russian government declared two important financial controls for
the country, hoping they would help reshape the economy. Firstly, a rescheduling of
the country's short term ruble debt. Holders of Russian treasury bills and short term bonds set to mature in 1998 and 1999 were given the opportunity to convert their
securities into long term assets. The available options saw the holders suffering huge
rescheduling was designed to relieve the government of servicing of short term
foreign debt. The government in 1997 had encountered difficulty rolling over their
short term debt, leading to a significant quantity of short term debt repayments falling
due. Rescheduling would relieve debt and interest payments, freeing up government
cash flow, with the purpose of helping urgent payments due for such things as wage
arrears. Liquidity of the commercial banks became a concern, as the banks had to
transfer their short term ruble debt into longer term securities. The Russian central
bank Jent cash to the other banks against some of their short term debt so they were
able to pay debts to one another, stopping the collapse of the banking sector.
The second financial move undertaken by the government was a ninety day
moratorium on payments by Russian banks and enterprises on their foreign exchange
debt. This applied only to payments of the principal debt of their loans. The reasoning
behind this was to provide some further relief to the commercial banks which were
already struggling with their short term foreign debt. It was estimated that the banks
had US$ I I billion of short term forward contracts, with US$8 billion of it due on 30
June 1998 and the balance of US$3.4 billion due within the ninety day moratorium
period.
After the ruble devaluation, the government sought many avenues to rescue their
economy and currency. Over a ten month period there were three ruble crises. The
first occurred in October 1997, the second in January 1998 and the third in May 1998.
The first two were successfully resolved by the central bank. Russia required help,
however, and came to an agreement with the IMF, the World Bank and Japan for
wa agreed upon, and it was distributed throughout 1998 and 1999. The IMF quickly
provided US$4.8 billion for urgent requirements. With the money given, Russia promised to put in place infrastructure to prevent a reoccurrence and defaults on
foreign debt. (Russian Country Monitor Oct 1998:IMF Volume 27. 11.14,15)
September 11
September 11 2001 was a truly deva~tating event which ha changed the Western World, especially in terms of the way business is conducted internationally. The US
Patriot Act. implemented after September 11, stipulates that all foreign payments
record all details of payer. payee and country of origin, and the act doesn·t allow
transfer of money from. or to. certain speci fie countries. This act ha. been implemented by most western countries: including ew Zealand; with the purpose of ~topping terrori~t~ gaining acce~s to large cash re~ervcs and, thereby, helping to prevent another event like September 11 from happening.
The effects of September 11 were not confined to the US economy. but have been felt all around the world. The four major effects of September 11 are centred on the
following areas: financial market~; world trade; unemployment; and interest rates.
With the integration of markets, there is a greater dependence of them on one another, increa ing the reaction of world stock markets to extreme events. Financial markets
reacted within in a matter of hours to the event of September 11, due to the case and
speed of information. The recovery times of markets reflect the effect that
September 11 had on stock market around the world. Financial markets around the
e-September 11 levels. Helsinki was the fastest at two days, with New Zealand in the midrange taking thirty-three days, and Saudi Arabia the slowest at one-hundred days
to recover, which shows the full effects that extreme events have on markets and
economies around the world. Bruck (2002) suggested that stock markets recover more
quickly from extreme events in today's environment than in the past, due to the
integration of markets, and the level of technology used. It took the Dow Jones forty
days from September 11 for their share index to return to its level pre-September 11,
which was longer than for twenty countries outside the US. Figure 2 depicts the fall in
value of the Dow Jones after September 11; from 10,000 to 8,200 in a short period of
time. Compared to other extreme events, the Dow Jones recovered quickly. The Dow
Jones took 232 days to recover from the attack on Pearl Harbour in 1941, 321 days to
fully recover from the 1987 stock market crash and 134 days to recover from the US invasion of Kuwait in 1990.
Overall, Bruck (2002) found that companies after September 11 found it harder to
issue stock and debt, and stocks sold at lower prices, with riskier stock requmng
Figure 2- Dow Jones Industry Average for the period between December 2000
and December 2004.
DJ hulustry Average Dow Jones & Co
12000 11000
10000
9000
8000
7000
Jan01 Jan02 30
(/)
§ 20
·~
::: 10 :E
0
Sourced from: http://finance.yahoo.com/
Secondly, world trade was severely affected by September 11. Higher transaction
costs were imposed on world trade due to the attacks of this new, global terrorism.
World Trade was affected by heightened security measures, collapse of businesses
and reduction in world trade volumes. In a simulation undertaken at a DIW
conference held in Berlin, it was found that, on average, an increase of l % in
transaction costs of the total value of goods is believed to represent the effect of
September l l (Bruck,2002). An increase in transaction costs of I% reduces
international trade by circa 3%. Some industries, such as agricultural product , textiles
and machinery, were the most severely affected by the increases in transactions costs,
countries, welfare losses ranged from US$3 l. l 6 billion m Western Europe to
US$0.74 billion in Sub Saharan Africa (Bruck, 2002).
Another factor which affected the US economy was the increase in the unemployment rate. In October 2001 private payrolls had fallen by 439,000 jobs, which was one of
the largest declines in fifteen years, and the unemployment rate increased to 5.4%, from 4.9% in early September 2001. This was caused by a downturn in the economy
and the collapse of many businesses (FSBR Cleveland 2001 ).
The final major effect on the US economy was the decrease in interest rates. The Federal Reserve lowered the short term interest rate twice, first on September 17 and
the second time on October 2, by a total of 100 points, to 2.5%. As at December 2001, the interest rate had fallen another 50 points to 2.0%, which is significantly lower than the 6.5% interest rate of January 200 I. This was designed to allow the struggling economy to try and boost investor confidence; however it had little impact
on the economy, which entered a recession in 2002. With one of the major economies in the world struggling, many countries with close connections were also strongly impacted by this event.
The Federal Reserve managed to soften the severity of the attacks on the economy. In the first few days after the attacks, they injected massive amounts of money (totalling
The Federal Reserve helped foreign banks by providing swap lines, suspending fees and penalties and lending money un-collateralised to help with the liquidity of the companies that had been hit hard by September l l. Three other fiscal policies were introduced to help the US economy after September 11. These consisted of tax reductions, the emergency spending bill (which was passed after the attacks) and the fiscal stimulus bill. These three moves were anticipated to inject circa US$160 billion into the economy during 2002.
Argentine Crisis
Table 1- Real GDP and Consumer Prices: Argentina 1994 - 2002
Real GDP and Consumer Prices: Argentina 1994 -2002
Real Consumer GDP Prices Year
(annual
(annual%
%
change) change)
1994 5.8 4.2 1995 -2.8 3.4
1996 5.5 0.2
1997 8.1 0.5
1998 3.8 0.9
1999 -3...i -1.2
2000 -0.8 -0.9
2001 -3.7 -I. I
2002 -I 0 to -15 +25 lO +30
Sourced from IMF World Economic Outlook (April 2002)
As shown in Table 1, the problems began in 1999 with negative GDP and a decrease
in Consumer Prices. There were especially large movements forecast in 2002, which was when the country defaulted on large amounts of foreign debt, as well as a significant outflow of cash over the four year period from 1999 to 2002.
prevented from printing new money. This resulted in price stability. Third, there was a
deregulation of markets, an opening up the country to overseas investors and attempts
to make the economy attractive for trade and privatisation in order to stimulate
growth. The growth rate had been stagnant at 0% for a period of time. Finally, the
central bank was made independent and a framework was created to regulate sectors,
and grow their investment attractiveness by giving independent power to the
Securities and Exchange Commission.
The Convertibility Plan resulted in the Peso being pegged one to one to the US dollar
to stop inOation. This was enacted because during the period of hyperinflation, the
majority of prices had been denominated in US dollars. As a result of the
convertibility plan, the central bank was required to maintain cash reserves equal to
I 00% of the monetary base, the reserves being used to maintain the exchange rate at
I: I. The central bank acted like a currency board and was responsible for maintaining
the exchange rate. Strict laws were placed on the central bank as to the level they
financed their treasury bonds to. Argentina maintained its bank deposits in dollars, but
the new law allowed for deposits to be exchanged into other currencies.
The Convertibility Plan quickly showed phenomenal results. Prices stabilised and
inflation dropped rapidly to the point where it wa down to a single digit by the mid
1990s. The growth rate increa ed to around 9% between 1991 and 1994, with a rate of
6% being maintained in 1995 after the Mexican Financial Crisis. The convertibility
plan created capital inflow and, with lower entry barriers, international trade exports
grew significantly. This growth in exports was one of the main drivers behind the
being able to choose the currency in which their deposits were held. This expanded
the financial sector as the majority of Argentineans decided to hold their deposits in
US dollars rather than Argentine pesos. With privatisation the government generated
US$ l 6 billion in revenue over the seven years to 1998, allowing the government to
grow the economy and lower the budget deficit.
The convertibility plan restored economic stability for a number of years, but was not
a long term solution. Argentina entered a recession in 1998, which lasted for four
years as unemployment and poverty increased uncontrollably. The country ended up
with major problems caused by a currency regime that was not linked to the economic
state of the country. Pegging the peso one to one to the USO did not take into account
the country's fiscal state or inflation rate.
Fixing the exchange rate to the USO solved many of Argentina·s short term problems,
but no measures were implemented for the long term. If Argentina had the majority of
its international trade with the US it would have made sense to fix the peso I to I with
the USO. Since the US only accounted for 12% of Argentina·s exports, the exchange
rate regime was not appropriate for Argentina's major trading partners. Argentina had
the majority of its export trade with Brazil and Europe, which meant that there was
more sense in pegging the peso to a ba ket of currencies with these major trading
partners. As the peso become overvalued, Argentina was running with a trade deficit.
The deficits were funded by foreign borrowings. The more the peso devalued, the
harder Argentina found it to repay their foreign obligations. Argentina had a large
quantity of imports, and comparatively few exports, so was not able to generate
Consequently, Argentina increased foreign borrowings to meet their current
obligations, causing foreign debt to increase further. The government imposed tariffs
to discourage imports, which had increased significantly as prices had stabilised and
the demand for overseas consumer goods had grown. The convertibility plan only
allowed the government to finance its deficits by t\VO means; borrowing or increasing
tax; with neither option seen as very appropriate, due to the state of the economy.
Argentina decided to borrow, as the population could not support tax increases. The
borrowings reached 50</c of GDP in 200 l.
The stock market also showed the effects of the declining economy. The stock market
fluctuated and began to lose value from December 2000. with a significant decline in
value in January 2000, as shown in Figure 3. The convertibility plan was abandoned
Figure 3-Latin America and Argentine Stock Indices for December 1999 to June
2002
Argetina Stock :rvlarket December 1999-June 2002
... 100 ~.-JL~4'--~---lll.---=~~~+-~:..+.-.1:,~~~~~~~~~_,..,<::::>....-~--i
'C
Q)
,,,
l'l:Iii
80+-~~~_,,,_~~~-T....,...-, ... 1--~~~~~-r--:---'1,--~~-+-~~~~--b;,..---i..:..
- Latin America - Argentina
0+-~~~~--.-~~-.--~~-r-~~...--~--.-~~-,-~~-.-~~...--~--..~ Dec-99 Mar-00 Jun-00 Sep-00 Dec-00 Mar-01 Jun-01 Sep-01 Dec-01 Mar-02 Jun-02
Sourced from Latin Focus 2002
Besides the internal issues faced by Argentina, external factors were taking their toll
on the economy. After the Asian and Russian crises in the late 1990s, significant
increases in interest rates were imposed because investors had become more risk
averse in relation to emerging markets and had withdrawn large proportions of their
money from such markets. Financial institutions were also fearful of emerging
markets such as Argentina and imposed higher interest rates to compensate for their
perceived risk. This made it even more difficult for Argentina to repay its foreign
debt. As new interest rates rose, the country went deeper into recession. At the end of
[image:38.564.50.491.139.473.2]The 1999 Brazilian Crisis severely affected Argentina, as Brazil was its main trading
partner and accounted for 30% of its export market. Europe was Argentina's second largest trading partner. At the same time that the peso was devaluing, the Euro and
Yen were appreciating, placing further strains on Argentina's export revenues. All of
these external and internal factors led to Argentina defaulting on its foreign debt of
US$141 billion in December 2001.
Argentina had been aware that the peso was overvalued, but feared that if it was
devalued then the economy would return to a state of high inflation and low, or no,
growth. Individuals, business and the government were holding USO dominated debt.
Devaluation of the peso would have caused the financial/banking sector to collapse.
Argentina hoped that the USO would depreciate, as the US had large trade deficits
and any improvement in the peso may have helped the exposure Argentina had to the
affects of the USO.
In January 2002, after Argentina had defaulted on its US$28 million payment in
December, the convertibility plan was abandoned, and the peso was devalued by 40%.
All dollar deposits and debts were converted at this rate into peso, causing the financial sector of Argentina to collapse. As the peso had the ability to float, the
economic state of the country also affected the exchange rate. In 2003, after many discussions with the IMF, a rescue package was agreed upon once the Argentine
economy started to show some signs of recovery. The world markets had little ability
to cope with another financial crisis after the Asia, Russia and Brazilian crises, all
MARKET CAPITALISATION OF MARKETS INCLUDED
In this research five markets are studied; Australia, Japan, New Zealand (NZ}, South
Africa (SA) and the United Kingdom (UK). Within the larger economics, more than
one stock market is in existence. The stock markets chosen for this research are; the
Australian Stock Exchange, the New Zealand Stock Exchange, the Johannesburg
Stock Exchange for South Africa, the London Stock Exchange for the UK and the
Tokyo Stock Exchange for Japan. Data has been sourced from World Federation of
Exchanges
The Australian and New Zealand markets were chosen for the study due to their close
relationship with one another. With Z being a small market in comparison to other
developed markets, we want to determine whether it exhibits similar. or different.
behaviour to the larger markets of the UK and Japan: which are among the most
common markets that companies chose to cross list on. The inclusion of the UK and
Japanese markets in this study is imperative to determine whether cross listing
provides any benefits to inYestors. South Africa was chosen as it is a market that has
strong ties with other African countries. Other studies do not often include African
stock markets due to their size and volatility. No US markets were added as the
majority of studies conducted are from the perspective of the US investor, wherea.
this study is from the perspective of the NZ investor. It is difficult to establish the true
effect of an extreme event on a US market as they are affected by many factors and,
therefore, it is difficult to measure the effect of one event/factor in time. Background
information about the markets being tudied has been given to provide some hi tory,
Differing levels of market segmentation lead to different market structures which, in
turn, affect market behaviour and relationships between markets. This is especially so
in times of extreme events. It is for this purpose that we study the behaviour and
structure of these markets to determine whether market factors; including political,
economic, social and technological change; have influenced the markets over the time
[image:41.560.55.510.283.431.2]periods being researched.
Table 2-Total Number of Companies with Shares Listed (Domestic and Foreign)
1990 1991 1992 1993 1994 1995 1996 1997 1998 1999 2000 2001
Total Sumber of Companies
Australia 1136 1005 1073 1107 1185 1178 I 190 1219 1222 1287 1406 1410
Japan 1752 1764 1768 I 775 1782 1791 1833 1865 1890 1935 2096 2141
.
vz
245 196 167 180 187 175 170 180 182 189 203 195SA 769 728 671 631 624 638 626 642 669 658 606 532
UK 2559 2572 2440 2412 2416 2502 2623 2513 2423 2274 2374 2332
Australia and Japan were the only markets of the five being studied that saw an
increase in the total number of shares listed over the thirteen year period. The other
three markets decreased in size, with no set pattern of behaviour.
South Africa recorded the largest change with a reduction of 41 % in the number of
companies listed, followed by Australia with an increase of 25%, Japan with an
increase of 23%, and NZ and the UK followed with decreases of 19% and 11 %,
respectively.
Australia
Over the period between 1990 and 1996 the market stayed fairly constant in terms of
the number of companies listed, with a high recorded of 1190 in 1996 and a low of 2002
1421
2153
199
451
1005 in 1991. From 1997, the Australia market saw steady growth of 16.5% over the
five years to 2002. A growing Australian economy and its importance in global terms
as regards exports, imports and currency growth were the main contributing factors to
the increase in the number of companies listed.
Japan
The Japanese stock market grew steadily over the thirteen years studied, which is a
reflection of the growth of the economy and the increased interaction of Japan with
the Western World. Japan ha built strong relationships within the computer
electronics and car manufacturing industries because of their leading technology
capabilities. The majority of Japanese firms cross listed were on the London Stock
Exchange, with the second most popular market to cross list on being the US.
New Zealand
The New Zealand market steadily decreased over the last six years, which is
attributable mainly to the privatisation of the economy that occurred in the late 1980s
and early 1990s. ew Zealand had its highest level of companies listed in 1990, at
245, at which time the Z economy was very strong and consumer confidence was
high. Over time, however, as the economy has tightened and growth has slowed; only
the larger companies within NZ's small economy are now listed on the Z Stock
Exchange. (Kerr, Qiu & Rose, 2005)
South Africa
South Africa showed similar results to the NZ market, with the total number of
decreased in the 1990s due to the increased popularity of mergers and acquisitions. A
high percentage of companies listed on the Johannesburg stock exchange are involved
with gold mining, resulting in the market closely following the gold cycle.
United Kingdom
This market had the highest number of companies in 1996 with 2623, and the lowest
in 2002 of 2272. Over this period the market fluctuated with no great changes. The
number of companies listed has decreased, due to the growing importance of the
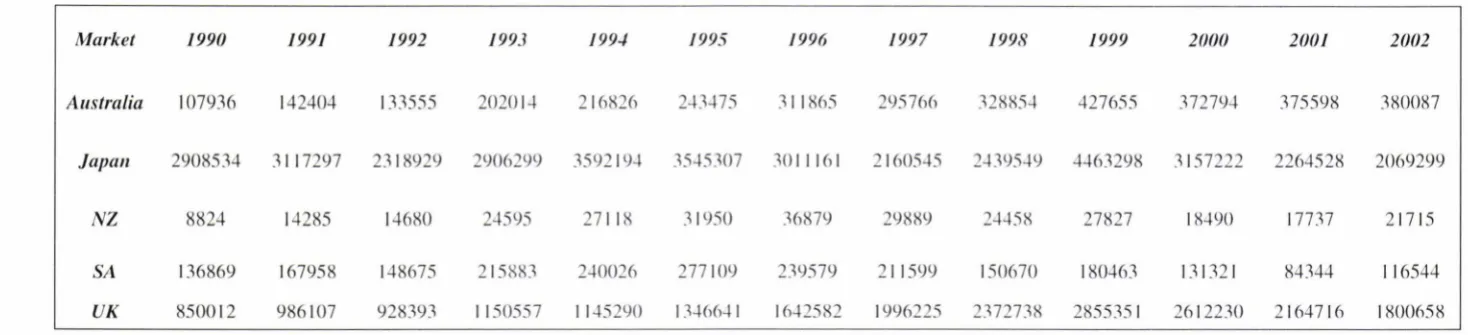
Table 3- Market Capitalisation of Shares of Domestic Companies (US$000,000)
Market 1990 1991 1992 1993 199.J 1995 1996 1997 1998 1999 2000 2001 2002
Australia 107936 142404 133555 20201-1 21682(1 2-13-175 311865 29576(1 328854 427655 37279-1 375598 380087
Japan 2908534 3117297 2318929 2906299 359219-1 35-15307 3011161 2160545 2-1395-19 4-163298 3157222 2264528 2069299
N
Z
8824 14285 14680 24595 27118 31950 36879 29889 24458 27827 18-190 17737 21715SA 136869 167958 148675 215883 2-10026 277109 239579 211599 150670 180463 131321 84344 116544
In terms of market capitalisation, Australia, NZ and the UK have een phenomenal
increases in the values of their domestic share markets. In comparison, the Japanese
and South African share markets have decreased in value between 1990 to the end of
2002.
The Australian market has steadily increased in value over the thirteen year period,
with growth of 19.4% pa. Market capitalisation saw a dramatic increase as a result of
privatisation, which occurred in most Commonwealth countries, such as Australia,
NZ and the UK. Market capitalisation stabilised over the last three years of the study
period, balancing out at around the high US$300,000s.
Japanese market capitalisation was volatile over this period. No set pattern is evident
in the results, except that there was a significant reduction in 1997. This can be
attributed to the Asian crisis, where Asian companies saw an average reduction of
20% in their share value. The market made a strong comeback in 1998, but by 2002
the market was half of the 1998 value.
The New Zealand share market saw an increase in value in the early 1990s due to
privatisation. The main driver behind this growth was the privatisation of Telecom in
1991. The NZ economy was severely affected by the Asian crisis, through reductions
in trade, tourism and foreign investment.
The value of the NZ share market is l/95th the size of the Japanese market, and
l/83rd that of the UK market. Due to its comparatively small size the effects of world
Smaller economies have less liquidity, market depth and market breadth, as well as a
smaller volume to absorb such effects. As a result, these markets take longer to
recover.
The South African market, unlike the other markets, remained fairly stable over the
thirteen year period. Movements noted were marginally smaller than those seen in the
other markets. The value of the market at the end of 2002 was US$ l l 6,544, compared
to US$ l 36,869 in 1990, showing a decrease in value of 15%. As the number of
companies listed has decreased, however, the value of each security has actually
increased.
The UK showed stable growth over the nine years to the end of 1999 ($2,855,35 I),
driven by privatisation of state-owned assets. Since 2000 market capitalisation
reduced dramatically, however, it must be remembered that the market still doubled
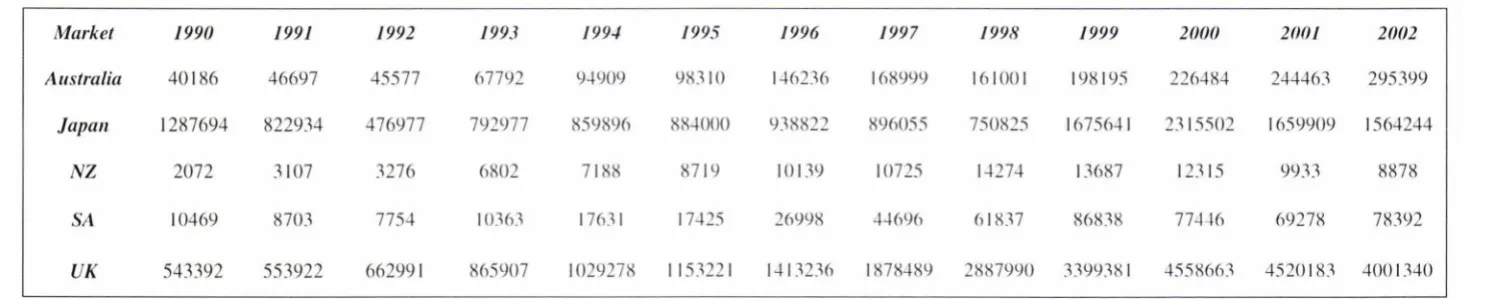
Table 4-Total Value of Share Trading (US$000,000)
Market 1990 1991 1992 1993 199./ 1995 1996 1997 1998 1999 2000 2001 2002
Australia 40186 46697 45577 67792 94909 98310 1-16216 168999 161001 198195 226484 244463 295399
Japan 1287694 822934 476977 792977 8598% 88-1000 938822 896055 750825 1675641 2115502 1659909 1564244
NZ 2072 3107 3276 6802 7188 8719 10139 10725 l..+27..+ 13687 12115 9933 8878
SA 10469 8703 775-1 10363 17631 17..+25 26998 4..+696 61837 86838 77-1..+6 69278 78392
The share market has become a popular investment tool over the last ten years, which
is demonstrated through the increase in the total value of share trading.
To formulate an average share price per company, the following formula was used:
[image:48.560.50.263.252.438.2]Total value of shares traded I Number of companies listed
Table 5-Comparison of Average Share Price in 1990 and 2000
Market 1990
2000 Average
Average +/ -Share Change
Price Share Price
Australia 35.38 207.88 4887r
Japan 754.99 726.54 -3.807r
NZ 8.46 44.61 42
87<-SA U.61 173.82 I I 777r
UK 212.35 1.761.15 7297r
With the exception of the Japanese market; which decreased slightly 111 value; all of
the markets saw a significant increase in the average share price.
Definitions for financial terms, ref er below . 1
1
Price Earnings Ratio, Return Indicators and the Inflation Rate Definitions:
The Price-Earnings Ratio is 1he ratio of price 10 earnings per share (market).
Price-earnings ratio
This measure shows !he muhiple of the earnings al which a stock sells. This is determined by dividing the curTent stock price by the cu1Tent earnings per hare (adjusted for stock splits). Earnings per share. for the P/E ratio. are determined by dividing earnings for the past twelve months by the number of common shares outstanding. A higher multiple means investors have higher expectations for future growth and have. therefore. bid up the stock's price.
Dividend yield (Stocks)
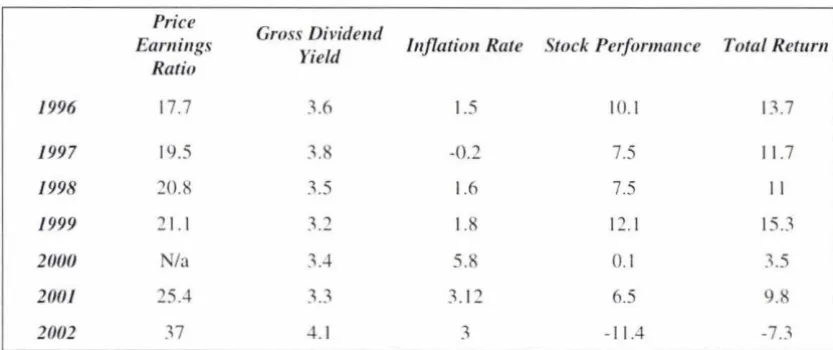
Table 6-Australian Price Earnings, Returns Indicators and Inflation Rate
Price
Gross Dividend
Earnings
Yield lnj7atiun Rate Stock Performance Total Return
Ratio
1996 17.7 .1.6 1.5 10.1 13.7
1997 19.5 .1.8 -0.2 7.5 11.7
1998 '.20.8 .1.5 1.6 7.5 II
1999 '.21. I .1.2 1.8 l'.2.1 15 . .1
2000 /a .1.-l 5.8 0.1 3.5
2001 25.4 .1 . .1 .1.1'.2 6.5 9.8
2002 .17 4.1 .1 -11.4 -7.3
The pnce earnings ratio (PIE ratio) for the Australian market demonstrated the
increased and improved liquidity of the market. The Australian stock market returned
a positive return every year except 2002. This was a world wide problem, as the US
was in a recession and many economics were struggling to return to pre-September 11
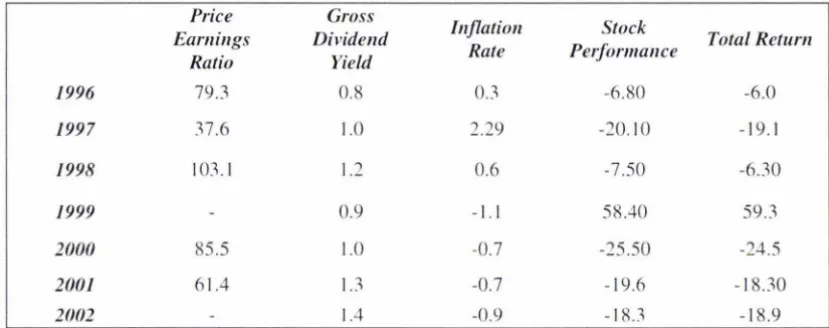
Table 7- Japanese Price Earnings Ratio, Return Indicators and Inflation Rate
Price Gross
Inflation Stock
Earnings Dividend Total Return Ratio Yield Rate Pe1f ormance
1996 79.3 0.8 0.3 -6.80 -6.0
1997 37.6 1.0 2.29 -20.10 -19.1
1998 103.1 1.2 0.6 -7.50 -6.30
1999 0.9 -1. I 58.40 59.3
2000 85.5 1.0 -0.7 -25.50 -24.5
2001 61.4
u
-0.7 -19.6 -18.302002 1.4 -0.9 -18 . .1 -18.9
The figures for the Japanese stock market reveals that the companies listed on it have
significantly higher earnings per share than those listed on the Australian market. The
gross dividend yield has remained stable at a low dividend payout of circa 1 % of the
stock price, where the average on other markets is 4%. The stock market is the
opposite of other markets, having only one positive return in 1999 of 59.3%, and
Table 8- New Zealand's Price Earnings Ratio, Return Indicators and Inflation
Rate
Price Cross
Stock
Earnings Dividend Inflation Rate
Performance Total Return
Ratio Yield
1996 14.8 4.3 2.6 19.90 19.90
1997 15.3 4.7 0.8 2.90 2.90
1998 37.6 4.0 0.4 -3.30 -3.30
1999 16.2 3.8 0.5 17.0 17.0
2000 15.0 3.8 4.0 -9.10 -9.10
2001 13.13 4.62 1.81 16.70 16.70
2002 18.4 6.0 2.7 4.2 4.2
The New Zealand stock market reveals that over the seven year period a fairly
constant P/E ratio existed; except in 1998 when the market had a PIE ratio almost
double the other years of 37.6. This indicates that NZ companies have had strong
revenue growth relative to their sale price. The NZ market, like other stock markets,
had a gross dividend yield of circa 4.0%. On average, companies paid dividends of
6% relative to their share price in 2002.
Inflation in NZ is a lot more stable than in some of the other countries in the study,
with the Z government trying to keep inflation within a band of between 2 to 3%.
The stock performance demonstrates that, unlike other markets, these changing
returns move to a lesser extent than the larger markets. On average, the Z tock
[image:51.563.45.457.112.278.2]Table 9 -South Africa's Price Earnings Ratio, Return Indicators and Inflation
Rate
Price Gross
Stock Earnings Dividend /ujlation Rate
Pe1f ormance Total Return Ratio Yield
1996 18.7 2.5 9.2 8.90 9.4
1997 16.8 2.7 6.1 -6.80 -4.1
1998 19.4 .3.3 9.0 -12.40 -9.1
1999 16.9 2.0 10.0 57.30 59.3
2000 13.5 2.6 14.8 -2.50 0.1
2001 13.29 2.87 6.62 25.40 28.27
2002 12.6 -l.O 12.4 -I 1.2 -7.2
The South African stock market shows a relatively stable earnings to share price ratio,
with a range between 12.6 and 19.4, and an average over the period of 15.88. The
gro s dividend, like the P/E ratio, has remained fairly constant at '.?..5, with an increase
to 4.0 in 2002. Stock performance has fluctuated between positive and negative
[image:52.561.48.465.111.294.2]Table 10 -The United Kingdom's Price Earnings Ratio, Return Indicators and
Inflation Rate
Price Gross
Stock Earnings DiFide11d /11jlatio11 Rate
Pe1forma11ce Total Return
Ratio Yield
1996 16.2 3.8 2.5 11.50 15.4
1997 19.2 3.2 3.6 24.7 27.9
1998 23.3 2.8 1.8 14.50 17.30
1999 30.5 2.0 1.6 17.80 19.80
2000 23.3 2.2 2.9 -8.0 -5.8
2001 20.29 2.59 1.96 -15.40 -12.81
2002 17.7 3.6 2.8 -25.0 -21.5
The P/E ratio for the UK market shows a similar pattern to those of the other markets.
Except for in 1999 (which had a high P/E ratio of 30.5), there is a comparatively
stable ratio over the period. The stock performance of the market reveals good returns
for the first four years, of between 11.5% and 24.7%, however, over the last three
years of the study the stock market has not performed well and has produced negative
[image:53.559.47.462.141.321.2]Table 11-Stock Markets Importance in the National Economy (US$000,000)
1995 1996 1997 1998 1999 2000 2001
GDP MV % GDP MV 'lo GDP MV 'lo GDP J\IV % GDP J\IV % GDP MV % GDP MV %
Australia 348.8 244.3 70.1 393 312 79 395 2% 75 379 329 87
w+
428 I 09 382 373 98 358 376 105Japan 4394 3667 83.5 4600 3106 68 4193 2217 53 3 798 2-196 66 43-19 -1555 105 4749 3 19-1 67 4141 229-1 55
NZ 52.8 31.9 60.5 N/a 36.9 65.9 29.9 -15 65.1 29.9 46 53.1 29.9 56 50.6 18.2 36 50.5 17.7 35
SA 132.9 258.6 195 126 2-10 190 129 212 I (1-I N/a N/a N/a 131 181 138 15.9 131 10-1 113 84.3 75
Gross Domestic Product (GDP) is the market value of all final goods and services
produced within a country during a given time period. The higher the percentage of
stock market value to GDP, the more importance the share market has for GDP, and
the more influence it has within the economy. The Australian stock market had an
increasing importance for GDP, as indicated by the increasing percentage.
The Japanese market had varying importance within the economy, with the
percentage ranging from 53% in 1997, to a high of l 05% in 1999. It is expected that
the share market in Japan was of low importance to the economy in 1997, as this was
the beginning of the Asian crisis and the stock markets in all Asian countries suffered.
Likewise, 1999 was a year when the stock market was important, as foreign
investment started to flow back into the stock market and economy.
The New Zealand stock market had the least importance on the economy of the five
markets researched. This is mainly due to NZ being an exporting country which
derives the majority of its income from this. The stock market, therefore, plays a less
important role within the economy and makes a smaller contribution towards GDP.
The South African tock market is very important within the South African economy,
as demonstrated by the high percentage of stock market value to GDP, but has been
steadily diminishing over the past two years.
The UK market produced similar results to those in South Africa, highlighting the
importance of the stock market on its economy and GDP. The UK stock market is one
within the economy. This means that the economy 1s heavily reliant on the stock
International Country Risk
Figure 4 - International Country Risk Ratings
International Country Risk Analysis
100 90
80 70 60 Rating 50 40 30 20 10 0
Sourced from THE PRS Group I C
• Australia • Japan
• NZ
South Africa
• UK
Thi analysis of country risk and market segmentation used the following factors that
could potentially affect market behaviour:Government Stability, Socio-economic
Conditions, Investment Profile, Internal Conflict, External Conflict, Corruption,
Military in Politics, Religion in Politics, Law & order, Ethnic Tensions, Democratic
Accountability and Bureaucracy Quality.
Each country was given a rating out of 100, with 100 being the highest. The first five
factors were given weightings of 12 as they are more influential on risk than other
factors. The following six factors were given a rating of 6 and Bureaucracy Quality
[image:57.560.55.464.111.413.2]Table 12 shows country rankings from 1984 to 2003 in 12 month intervals. In 1984,
Japan was the most stable country in terms of risk with a rating of 92.75. The three
commonwealth economies of NZ, Australian, and UK closely followed with ratings
between 87.5-89.67. South Africa was the least unstable economy with a rating of 63.
This pattern continues over the 20-year period with all economies averaging above
82.5 except South Africa attaining an average rating of 63.64. The commonwealth
and Japanese economies have stabilised over the last five years. With key factors;
Government Stability, Socioeconomic Conditions and Investment Profile averaging a
rating of 10 out of 12. There was an unstable period in late l 980's early l 990's
caused by monetary and economic policy changes and privatisation within the
commonwealth economies. The South African economy has been unstable over the
whole 20 year period with its lowest rating of 49.33 in 1986. The South African
economy has always been plagued with government instability, racial and religion
tensions. corruption, unstable socio-economic conditions and conflict in many areas.
The economy improved in the early 90's but has started a gradual decline in the past 5
years, as other economies have been improving. All of the problems faced within
South Africa are inter related and as a whole affect the risk stability of the economy as
demonstrated in the country's rating.
It is believed that market segmentation factors for the commonwealth and Japanese
economies will not affect the results in this research as they are relatively stable, as
shown with their ratings. However market segmentation factors in the South African
economy may have a negative effect on the results. This can be attributed to the
instability of the economy, making it harder for companies to achieve positive returns,