An experiment in iterated function learning
Vanessa Ferdinand
Institute for Interdisciplinary Studies
University of Amsterdam
and
Willem Zuidema
Institute for Logic, Language and Computation
University of Amsterdam
Abstract
1. Introduction
'Iterated learning' refers to situations, such as in language acquisition or musical learning, where learners learn from data that is itself the result of a learning process. Iterated learning has been extensively studied in the iterated learning model (ILM), which was first formalized for the study of language evolution by Kirby (1998) and provides a framework for the empirical study of cultural transmission and how it effects the information being transmitted. ILMs can be implemented in a variety of ways, but they all contain these fundamental components:
1) A learning algorithm
2) Some form of information which is the input/output of the algorithm
3) Structured transmission of the information, where the output of one learner serves as the input for the next.
Some learning algorithms commonly used in ILMs are symbolic grammar induction algorithms (Brighton & Kirby, 2001), neural networks (Smith, 2002), Bayesian agents (Kalish et al., 2007), and human subjects (Cornish, 2006; Griffiths et al., 2006). The data can be linguistic input or numerical values and the transmission format could be any conceivable social structure, but is commonly kept to a parent-child chain for analytical ease.
The modeling work in Kalish et al. (2007) and Ferdinand & Zuidema (2008) has shown that if learners are perfectly Bayesian-rational, have perfect knowledge of the distributions from which data could be drawn, and sample from the posterior, then iterated learning will converge to the prior. If any of these conditions do not hold, then the prior, likelihoods, and selection strategy all influence the outcome of iterated learning.
Ultimately, we are interested in explanations for the structure of natural language and how cultural transmission mechanistically translates the properties of individual learners into the properties of human language. If we take this model seriously, then we would expect that human learning biases can be read off of the universal properties of human language. However, if we would like to make this claim and take an observed universal as evidence for a specific learning bias, then we must be sure that the likelihood structure and selection strategy are of the required kind. Likewise, if we want to predict what sort of universal will arise from a particular bias, then we need to know the state of the other parameters involved in order to make such a predictions.
2. Previous work
Experimental ILMs with human subjects show promise as a powerful framework for testing predictions of both computational models and psychological studies regarding learning biases and the cultural transmission of language. Over the past couple years, some initial explorations into this framework have been made. In vertical transmission models, where information is transmitted serially, from one generation to the next, Kirby et al. (2008) demonstrated in human learners, the emergence of regularization, increased learnability, and compositionality due to a transmission bottleneck. Flaherty (2008) also demonstrated a learnability increase with children, however these language did not become regular. As for horizontal transmission models, where individuals repeatedly interact and negotiate a communication system, Galantucci (2005) showed the emergence of a communication system where the communication channel was undefined and Scott-Phillips (2008) showed the emergence of a symbolic communication system, even when communicative intent was not pre-established between subjects. Additionally, Kalish et al. (2007) demonstrated regularization and learnability in a vertical ILM with human subjects, but in the domain of function learning; not a communication system.
The present research will take up the experimental ILM in function learning, as put forward by Kalish et al. (2007). This is a simple paradigm with established results regarding the role of human learning biases and has been successfully modeled with a Bayesian ILM. Because these task-specific learning biases are more or less known, this task offers an ideal setting for studying the role of the data likelihoods in a population of human learners. In this paper, we will present a replication of Kalish et al. (2007) iterated function learning experiment with human subjects. Additionally, we will present a novel, second condition which tests if human subjects display a behavioral difference to a manipulation in their perceived reliability of the training data.
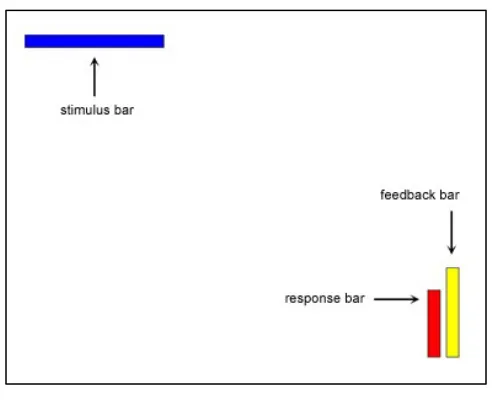
In both the original experiment and the present replication, subjects attempt to learn and then reproduce the underlying relationship between the lengths of two different bars over a series of trials (see Figure 3.2 for an example screen shot). The two lengths constitute (x,y) pairs, so this underlying relationship can be described as a function that relates these two data points over the complete set of (x,y) pairs. The x value serves as the subject’s stimuli and is encoded by the length of a horizontal, blue bar. Each trial, a new stimuli bar length appears and subjects indicate the corresponding y value by adjusting the height of a vertical, red response bar. During the training phase, a feedback bar is presented alongside the subject’s response bar, showing the correct response bar height for the target (x,y) pair. In the testing phase, this feedback bar does not appear and the subject’s responses are recorded as the new y-values for the corresponding stimuli of each trial. At the end of the testing trials, a new set of (x,y) pairs has been obtained, and reflects what the subject inferred about the relationship behind the data in their training set. This new set of (x,y) pairs then serves as the training set for the next subject in the iterated learning chain.
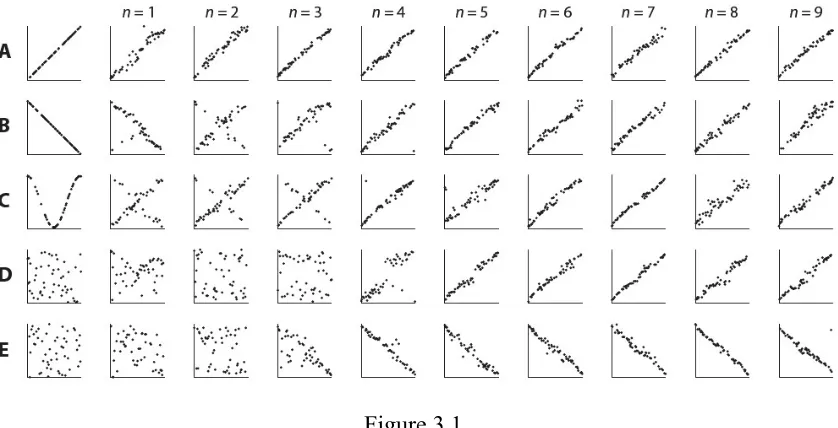
nine generations. Each condition was defined by the initial function which was used to generate the (x,y) pairs of the first generation’s training set. These four functions are positive linear, negative linear, u-shape, and random (x,y) pairs. Figure 3.1 shows representative chains from each condition, taken from Kalish et al. (2007).
Figure 3.1
Results from Kalish et al. (2007) iterated function learning experiment with human subjects. Shown are 5 representative chains from the 4 conditions, where the initial function is: (A) positive linear, (B) negative linear, (C) U-shaped or (D) & (E) random. Each set of axes plot the testing phase responses of each subject, which was trained on the data to the left of it. Regardless of the initial data, iterated learning converges to the positive linear function, with the highest inductive bias, and occasionally to the negative linear function, with the next highest bias.
Regardless of the initial data, the subjects in the iterated learning chains converged to one of the a prior preferred solutions: a positive linear function with positive slope (with the highest bias), or one with negative slope (with the second-highest bias). Kalish et al. attest that these bias rankings are established in previous psychological studies on function learning, which show that linear functions with positive slope require the least training to learn (Brehmer, 1971 & 1974) and are consistent with subjects’ initial responses (Busemeyer et al., 1997).
It is important to note that this specific function learning task was developed by Kalish et al. (2004) to demonstrate knowledge partitioning and showed that subjects readily divided a complex function into multiple, simpler sub-functions. This study provides empirical evidence that individuals are capable of inferring a discontinuous function for this particular task paradigm. However, subjects were explicitly aware that the underlying function was somewhat complex, and this might have elicited additional strategies. If subjects were instructed in Kalish et al. (2007) that the relationship was simple, generated by one rule, or continuous, then this may have excluded some of these other possible behaviors. It is also possible that such a restriction to subjects’ expectations of the possible, task-relevant hypotheses might have played into the demonstrated convergence to the prior, where other solutions could be equally stable for human learners. Therefore, in the present replication, we were careful to not over specify the nature of the function, so not to add additional expectations toward a specific class of functions (such as continuous, generated by a single rule, or based on one-to-one mappings). Leaving the nature of the function ambiguous establishes more potential for varied behavior. Additionally, any behavioral differences regarding the manipulation of the likelihoods may not be visible under a task in which subjects entertain a restricted set of hypotheses.
In the present study, the Kalish et al. experiment is replicated. The findings confirm that the majority of chains converge to the known bias, the positive linear function. However, this replication also obtained semi-stable discontinuous functions, discrete responses, and confirms through exit questionnaires, bet-hedging behavior. These behaviors will be discussed further in the Results section. A second experiment (condition 2) contains a novel manipulation to subjects’ perceived reliability of their training data in comparison to the replication experiment (condition 1). This manipulation was accomplished by an addition to the instructions, informing participants that some of the trials in the training phase would be random pairs, to add a small level of noise to the training, and the testing phase would test how well they learned the underlying relationship. (See Appendix B for both instructions.) Only the instructions differed between conditions; otherwise, the set up of the experiment remained exactly the same. In both conditions of the following experiment, instructions, methodology, and stimuli were kept as similar as possible to the original study. Additionally, all chain initializations were set to a different set of random (x,y) pairs, corresponding to Kalish et al.’s 4th condition. Although Kalish et al. show that the initial data plays no role in the long run, this initialization was still used to rule out an initial bias in the data toward any specific function.
It is clear that human subjects are neither perfectly Bayesian-rational, nor do they have perfect knowledge of the distributions from which the data might be drawn. Additionally, their hypothesis choice strategy might fall on a continuum between maximizing and sampling. According to the modeling work, violating these assumptions does not exclude the prior from determining the outcome of iterated learning, but it does suggest that the likelihoods will play a role in determining this outcome. Assuming that the Bayesian model is a good approximation of human inductive inference, manipulating the role of the data should not affect which bias is converged to (because the priors are not the target of manipulation), but the dynamics of convergence themselves. For example, this could affect the rate of convergence, or the proportion of chains which conform to each hypothesis. This manipulation choice is supported by the known trade-off in Bayesian statistics between the influence of the prior vs. the influence of the data. Where data provides little information, the prior is more influential, and vice a versa. It is hypothesized that in the condition where the data are perceived to be less informative, chains will converge to the positive (or occasionally negative) linear function quicker than in the replication condition. Additionally, it is predicted that behavior corresponding to a wider variety of hypotheses will be obtained in condition 1 than in condition 2. And because both conditions leave the possible hypotheses unspecified, more varied behavior will be obtained in both conditions than in the original study by Kalish et al. (2007).
3. Method
3.2.1 Participants
Experiments 1 & 2: Participants were solicited by email invitation from an established mailing list experiment participants. 56 respondents completed the online experiment. Condition 1 consisted of 8 chains and 32 subjects and condition 2 consisted of 7 chains and 20 subjects. 4 subjects from condition 1 were automatically excluded due to contemporaneous login. Not all subjects completed the exit questionnaire, so the age range and gender is not known for all participants. Experiment 3: 9 graduate students of Logic and Cognitive Science constituted 1 chain. 3F/6M, aged 23-30. They took a computerized, offline version of the experiment in person.
3.2.2 Apparatus and stimuli
Figure 3.2
Example screen shot, with labels added. This is taken from the implementation of the present experiment, but is nearly identical to the original interface of Kalish et al. (2007).
At the beginning of a trial, the blue bar appeared. The response bar could be adjusted at will and no time constraint was imposed. When the subject had adjusted the bar to the desired height, they pressed the return key to record their response. During the training phase of the experiment, a feedback bar displayed the target response after the return key was pressed. The feedback bar was presented 10 pixels to the right of the response bar and had the same width and possible range as the response bar. If the response was correct (within a 5 unit / 20 pixel range of the correct y value) the feedback bar would appear in green and the screen remained as is for 1-second study period. If the response was incorrect, the feedback bar would be shown in yellow until the subject readjusted the response bar to the exact height of the feedback bar and pressed return again. This readjustment period looped until the correct answer was recorded. Once recorded, the feedback bar would be shown in green and the screen remained as is for a 2-second study period. Afterward, the next trial began. The testing phase was identical to the training phase, except no feedback in the form of the feedback bar was given. After the subject pressed the return key to record their first response, the next trial began. The training and testing phases each consisted of 50 trials.
3.2.3 Procedure
participants and they were unaware that their data would be used for another test-taker.
3.2.4 Data Collection and Analyses
When a subject accessed the experiment link, they would be directed at random to one of the chains, where the last recorded testing set of that chain would serve as their training set. Due to this implementation, the number of generations of each chain varies, and some chains did not receive enough subjects and remain un-converged. Additionally, some chains that showed convergence to the positive linear function for at least 2 generations were truncated by the experimenter. The original study displayed the robustness of this convergence state and it was preferred to initialize as many chains as possible with the limited number of subjects. If two or more subjects were directed to the same chain contemporaneously, both would complete the task, but only the first completed testing set would serve as the input to the next generation. IP addresses were also logged and each computer was blocked from running the experiment twice. Lastly, the testing phase was followed by a brief questionnaire (Appendix B).
Because this is a relatively new function learning paradigm, it is unclear what the best quantitative analyses might be. Kalish et al. (2007) mainly presented a qualitative characterization of their results. For their quantitative analysis, they computed the correlation of each function to the positive linear function, y = x. However, in the present experiment, not all chains converge to the positive linear function, and therefore such a correlation measure would not be equally informative for all chains. The present results will also be characterized qualitatively and focus on a comparison and contrast of the dynamics obtained here to those of the original study.
4. Results
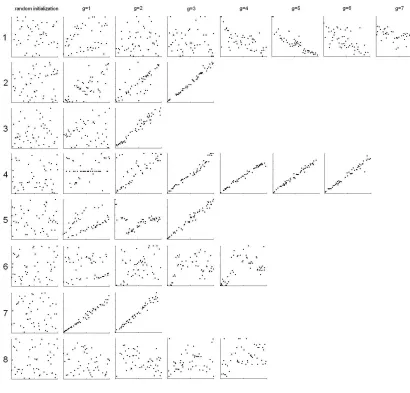
Condition 1 constitutes a replication of Kalish et al. (2007). Figure 3.2 shows all chains collected for this condition. Of these 8 chains, 5 seem to converge to the positive linear function. The remaining chains show no sign of definite convergence, though chain #1 seems to be headed toward negative linear. Of the converged chains, estimated convergence to the positive linear function occurred by an average of 2.4 generations. Figure 3.3 shows all results from condition 2, where subjects where told a small level of noise existed in the training set. Of these 7 chains, 3 seem to converge to the positive linear function, and 1 to the negative linear function. Of the converged chains, estimated convergence to the positive or negative linear function occurred by an average of 2 generations.
Figure 3.2
This figure shows the results from the 8 chains of condition 1. Each set of axes plot the testing phase responses of each subject, which was trained on the data to the left of it. The leftmost column shows the random initialization that the first subject of each chain was trained on. 5 of these chains seem to converge to a linear function with positive slope, and chain 1 seems to be headed toward a negative linear function. Bet hedging and discontinuous functions also appear.
responded by choosing randomly according to both rules, in attempt to “get at least some answers correct.”
Second, is the appearance of discontinuous functions. C1-5-2, C1-6-3&4, C2-6-1,2&3 all appear to be categorizing certain lengths of the blue bar and applying different rules relating red bar size to each category. The strongest evidence of this shown in C2-7-3&4. Here, this discontinuous function seems relatively stable and clearly originated in the bet-hedging behavior of generation 2.
Figure 3.3
This figure shows the results from the 7 chains of condition 2. Each set of axes plot the testing phase responses of each subject, which was trained on the data to the left of it. The leftmost column shows the random initialization that the first subject of each chain was trained on. 3 of these chains seem to converge to a linear function with positive slope, and 1 to a linear function with negative slope. Chains 6 & 7 show additional behaviors, maintained for 3 generations.
Figure 3.4
[image:10.595.100.497.527.704.2]relationship might be, they generated their testing answers by either simulating random responses or by matching the red bar to the blue bar length, resulting in a positive linear function. The latter was the case for C1-7-1, C2-2-2, and C2-4-1.
One additional, small experiment (Figure 3.4) was conducted with graduate students in logic and cognitive science, who were told that this was a function learning
experiment. In general, these students displayed a lot of motivation to “correctly figure out” the underlying function. The resulting behavior of these subjects give rise to chain full of variation in hypotheses choice, but also
a higher degree of transmission fidelity between these more complex functions. It is possible that these subjects entertained a wider variety of hypotheses, or even have developed different learning biases for function learning tasks than the general population. It is also likely that these subjects took the data into account differently than subjects in the previous experiments, through higher attention levels or working memory capacity, explaining the increased transmission fidelity.
The subject in generation 1 reported bet hedging between y = 2x and y = ½ x. This served as a foundation for the next 2 subjects who inferred that the relationship was generated by 2 rules, y = 2x and y = ½ x. Subject 5 categorized the stimuli bar into two separate rules. Subject 6 found a continuous function based on a proportion of the stimulus bar’s remainder. In generation 7, the extreme values of the previous subject are regularized as maximum response bar lengths for the smallest third of stimulus bar sizes. Last, subjects 8 and 9 reported using the same
categorization and rules in the testing phase. It is doubtful that this chain will converge to a positive linear function anytime soon, due to the saliency of the rule coding x < 1/3 its maximum length = maximum y. It seems likely, however, that this function could converge to a fully discrete function, which might be just as stable as the positive linear function.
5. Discussion
These experiments elicited a wider variety of behavior in than has been previously demonstrated in an iterated function learning experiment. This is probably due to an under specification of the nature of the function to be learned, resulting in subjects entertaining, on average, more hypotheses than subjects in Kalish et al. (2007). These results show that some aspect of human subject’s hypotheses can be reached by manipulating their expectations of the processes which generate the data they see. The more expectations they have toward a particular class of functions (such as continuous, one-to-one mappings), the less they will entertain hypotheses which do not conform with those expectations. However, this result could very well be explained by a change in subjects’ prior distribution over hypotheses between the original and present experiments. And thus, serves as evidence that the distribution of prior probabilities over hypotheses can be manipulated through instructions or
represent the volume of two cups (linear) or the speed and stopping distance of vehicles (exponential), the corresponding ranking of biases might be altered.
This variance in behavior obtained in the present experiments, coupled with a small number of chains, makes it unclear whether there was a difference in convergence rate between conditions 1 and 2. Perhaps collecting more chains could provide a clearer picture. There is some evidence, though, that the purported noise facilitated subjects in choosing their first hunch. In particular, subject C2-1-3 reported entertaining a wide variety of possible relationships to no success during the training phase, but then “remembered reading something about the noise added and I decided to stick to my original idea…” which was inverse proportionality of the two bars.
Although individual variation in ILMs may obscure differences between experimental manipulations, these differences shouldn’t necessarily be controlled for, but instead studied in greater depth. These experiments demonstrated that experimental ILMs offer a very incomplete picture of individual learning biases. Looking back at the results, a wide variety of responses are obtained in the first generation of each chain, to initializations of the same class; random (x,y) pairs. Although we can see different responses from different people to similar stimuli, there is not way to tell, from such an ILM, what range of responses to this stimuli any particular subject is capable of.
Despite an unclear difference between conditions, this experiment largely replicates the results of Kalish et al. (2007). This helps to establish this relatively new task as a reliable paradigm for revealing the inductive biases of human function learning. As Kalish et al. assert, the experimental ILM may be a good tool for revealing human inductive biases for tasks where they are unknown or where researches have few a priori hypotheses about what they might be. Additionally, the human subjects ILM may lend itself well to the experimental manipulation of convergence patterns or the biases themselves. Such manipulations could be useful in testing hypotheses
informed by computational modeling, as explained in this paper’s introduction.
In general, an experimental ILM can inform us more about human iterated learning behavior than a computational ILM and the relevant psychological studies combined. However, it will provide the strongest results when coupled with these other
methodologies. It is possible that certain psychological pre-tests could be conducted with experimental ILM participants to ascertain subject-specific biases. Subjects could be grouped into ILMs according to differences in biases and this could be correlated with differences that are obtained in the dynamics or resulting
Acknowledgments
Appendix
Experiment instructions for condition 1:
Instructions:
Thank you for your participation! This experiment consists of 2 parts. In the first part, you will be taught the relationship between the sizes of two different bars. In the second part, you will be tested to see how well you learned this relationship.
Part 1 Instructions:
Part 1 will teach you the relationship between the sizes of a blue and a red bar. During this part of the experiment, pay attention and try to learn this relationship the best you can.
Here’s what will happen in Part 1:
1. At the top of the screen, a blue bar will be shown at a particular size. Each trial, it will be a different size. Your job is to adjust the red bar (by rolling your mouse) so that the red bar has the size you want. You will learn, over the course of Part 1, what the correct response is.
2. Once the red bar is the size you want, press the
space bar on your keyboard to record your response.
When your response is correct: When your response is not correct.
If your response was correct, a green bar will appear to the right of the red bar for a 1-second study period. (If your answer is
very close, but not exact, it will be accepted). Then the next trial will begin.
If your response was incorrect, a yellow bar will appear to the right of the red bar and show you the correct answer. You must re-adjust the red bar to the exact height of the yellow bar and press the
Part 1 consists of 50 trials. There is no time constraint.
Part 2 Instructions:
Part 2 will test how well you have learned the relationship between the blue and the red bar. This part is identical to Part 1 except that the feedback bar will not appear. Once you record your response with the
space bar, the next trial will begin.
Try your best to indicate the correct size of the red bar during this part of the experiment!
Part 2 consists of 50 trials. There is no time constraint.
Good Luck!
Experiment instructions for condition 2:
Instructions:
Thank you for your participation! This experiment consists of 2 parts. In the first part, you will be taught the relationship between the sizes of two different bars. In the second part, you will be tested to see how well you learned this relationship.
Part 1 Instructions:
Part 1 will teach you the relationship between the sizes of a blue and a red bar. For most of the trials in Part 1, the blue and red bar sizes will correspond to this relationship. However, in some trials the blue and red bar sizes will be random – this adds a small level of noise. During this part of the experiment, pay attention and try to learn the underlying relationship the best you can.
Here’s what will happen in Part 1:
1. At the top of the screen, a blue bar will be shown at a particular size. Each trial, it will be a different size. Your job is to adjust the red bar (by rolling your mouse) so that the red bar has the size you want. You will learn, over the course of Part 1, what the correct response is.
2. Once the red bar is the size you want, press the
space bar on your keyboard to record your response.
When your response is correct: When your response is not correct.
If your response was correct, a green bar will appear to the right of the red bar for a 1-second study period. (If your answer is
very close, but not exact, it will be accepted). Then the next trial will begin.
If your response was incorrect, a yellow bar will appear to the right of the red bar and show you the correct answer. You must re-adjust the red bar to the exact height of the yellow bar and press the
Part 1 consists of 50 trials. There is no time constraint.
Part 2 Instructions:
Part 2 will test how well you have learned the underlying relationship between the blue and the red bar. This part is identical to Part 1 except that the feedback bar will not appear. Once you record your response with the space bar, the next trial will begin.
Try your best to indicate the correct size of the red bar during this part of the experiment!
Part 2 consists of 50 trials. There is no time constraint.
Good Luck!
References
Bartlett, F. C. (1932). Remembering: A study in experimental and social psychology.
Cambridge: Cambridge University Press.
Batali, J. (1998). Computational simulations of the emergence of grammar. In Hurford, J. R.,
Studdert-Kennedy, M., Knight, C. (Eds.), Approaches to the Evolution of Language:
Social and Cognitive Bases, pages 405-426.Cambridge: Cambridge University Press.
Brehmer, B. (1971). Subjects’ ability to use functional rules. Psychonomic Science, 24,
259-260.
Brehmer, B. (1974). Hypotheses about relations between scaled variables and in the learning
of probabilistic inference tasks. Organizational Behavior & Human Decision
Processes, 11, 1-27.
Brighton, H. (2002). Compositional Syntax From Cultural Transmission. Artificial Life, 8(1).
Brighton, H. & Kirby, S. (2001). The survival of the smallest: stability conditions for the cultural evolution of compositional language. In Kelemen, J. & Sosik, P. (Eds.),
ECAL01, pages 592-601. Springer-Verlag.
Brighton, H., Smith, K., & Kirby, S. (2005). Language as an evolutionary system. Physics of
Life Reviews, 2, 177-226.
Busemeyer, J. R., Byun, E., DeLosh, E. L., & McDaniel, M. A. (1997). Learning functional relations based on experience with input-output pairs by humans and artificial neural
networks. In Lamberts, K. & Shanks, D. R. (Eds.), Knowledge, concepts, and
categories: Studies in cognition, pages 408-437. Cambridge: Cambridge, MA: MIT Press.
Christiansen, M. & Kirby, S. (2003). Language Evolution: Consensus and controversies.
Trends in Cognitive Science, 7(7), 300-307.
Cornish, H. (2006). Iterated Learning with Human Subjects: an Empirical Framework for the
Emergence and Cultural Transmission of Language. Unpublished Masters thesis, School of Philosophy, University of Edinburgh, U.K.
Flaherty, M. & Kirby, S. (2008). Iterated language learning in children (abstract). In Smith,
A. D. M., Smith, K., & Ferrer I Cancho, R. (Eds.), Proceedings of the 7th
International Conference (EVOLANG7), pages 425-426. World Scientific. Galantucci, B. (2005). An experimental study of the emergence of human communication
systems. Cognitive Science, 29, 737-767.
Griffiths, T. L. and Kalish, M. L. (2005). A Bayesian view of language evolution by iterated
learning. In Bara, B.G., Barsalou, L., and Bucciarelli, M. (Eds.), Proceedings of the
Twenty-Seventh Annual Conference of the Cognitive Science Society, pages 827-832. Erlbaum, Mahwah, NJ.
Griffiths, T. L., Christian, B. R., & Kalish, M. L. (2006). Revealing Priors on Category
Structures Through Iterated Learning. Proceedings of the 28th Annual Conference of
the Cognitive Science Society.
Ferdinand, V. (2008). How learning biases and cultural transmission structure language:
Iterated learning in Bayesian agents and human subjects. Unpublished Master's thesis, Institute for Interdisciplinary Studies, University of Amsterdam
Ferdinand, V. and Zuidema, W. (2008). Language adapting to the brain: a study of a Bayesian
iterated learning model, ILLC Preprint Series (PP-2008-54), University of
Amsterdam
Hurford, J. R., (2000). Social transmission favors linguistic generalization. In Knight, C.,
Studdert-Kennedy, M., Hurford, J. R. (Eds.), The Evolutionary Emergence of
Language: Social Function and the Origins of Linguistic Form, pages 324-352. Cambridge: Cambridge University Press.
Kalish, M. L., Lewandowsky, S., & Kruschke, J. K. (2004). Psychological Review, 111(4),
1072-1099.
Kalish, M. L., Griffiths T. L., & Lewandowsky, S. (2007). Iterated learning: Intergenerational
knowledge transfer reveals inductive biases. Psychonomic Bulletin & Review. 14(2),
288-294.
Kirby, S. (1998). Language evolution without natural selection: From vocabulary to syntax in a population of learners. Unpublished manuscript.
Kirby, S. (1999). Function, Selection, and Innateness: the Emergence of Language Universals. Oxford university Press.
Kirby, S. (2000). Syntax without Natural Selection: How compositionality emerges from vocabulary in a population of learners. Unpublished manuscript.
Kirby, S. (2001). Spontaneous evolution of linguistic structure: An iterated learning model of
the emergence of regularity and irregularity. IEEE Journal of Evolutionary
Computation, 5, 102-110.
Kirby, S., Dowman, M., & Griffiths, T. L. (2007). Innateness and culture in the evolution of
language. PNAS, 104(12), 5241-5245.
Kirby, S., Cornish, H., & Smith, K. (2008). Cumulative Cultural Evolution in the Laboratory:
an experimental approach to the origins of structure in human language. Proceedings
of the National Academy of Sciences, 105(31), 10681-10686.
Kuhl, P. K. (2004). Early language acquisition: cracking the speech code. Nature Reviews
Neuroscience, 5(11), 831-843.
Lieberman, A. M., et al. (1967). Perception of the Speech Code. Psychological Review, 74,
431-61.
Lieberman, E., Michel, J., Jackson, J., Tang, T., & Nowak, M. (2007). Quantifying the
evolutionary dynamics of language. Nature, 449, 713-716.
Nowak, M. A., Komarova, N. L., & Niyogi, P. (2001). Evolution of universal grammar.
Science, 291, 114-118.
Pinker, S. (1984). Language Learnability and Language Development. Cambridge, MA:
Harvard University Press.
Scott-Phillips, T. C., Kirby, S., & Ritchie, G. R. S. (2008). Signalling signalhood and the emergence of communication (abstract). In Smith, A. D. M., Smith, K., & Ferrer I
Cancho, R. (Eds.), Proceedings of the 7th International Conference (EVOLANG7),
pages 497-498. World Scientific.
Smith, K. (2002). The cultural evolution of communication in a population of neural
networks. Connectionism Science ,14, 65-84.
Smith, K. (2003). Learning biases and language evolution. In Kirby, S. (Ed.) Language
Evolution and Computation (Proceedings of the Workshop on Language Evolution and Computation, 15th European Summer School on Logic, Language and
Information).
Smith, K., & Kirby, S. (2008). Natural selection for communication favors the cultural evolution of linguistic structure. In Smith, A. D. M., Smith, K., & Ferrer I Cancho, R.
(Eds.), Proceedings of the 7th International Conference (EVOLANG7), pages
283-290. World Scientific.
Vogt, P. (2003). Iterated learning and grounding: from holistic to compositional languages. Unpublished manuscript.
Weisbuch, G. (1991). Complex systems dynamics: an introduction to automata
networks. Santa Fe Institute Studies in The Sciences of Complexity Lecture
Notes, vol. 2.
Zuidema, W. (2003). How the poverty of the stimulus argument solves the poverty of the
stimulus argument. In Becker, S., Thrun, S., & Obermayer, K. (Eds.) Advances in