COMMISSION OF THE EUROPEAN COMMUNITIES
Brussels, 23.04.1997
COM(97) 169 final
Progress report on the implementation of the
1996 Broad Economic Policy Guidelines
Table of contents
1. Macroeconomic policy-mix conducive to growth, employment and convergence 1
1.1. Macroeconomic policy-mix 1
1.2. Upturn in economic activity 3
1.3. Gradually improving employment outlook 4
1.4. Social dialogue 4
2. Price and exchange rate stability 5
2.1. Price stability 5
2.2. Exchange rate stability 7
3. Sound public finances 8
3.1. The pace and size of consolidation efforts 8
3.2. The composition and durability of consolidation efforts 12
4. Better functioning of product and services markets 14
5. Fostering employment and labour market reforms 16
5.1. Wage developments 16
5.2. Labour market reforms 17
Box: Main labour market reforms in EU countries in recent years 20
Progress report on the implementation of the
199S Broad Economic PoEicy Guidelines
The 1996 Broad Economic Policy Guidelines confirmed and developed the policy recommendations laid down in previous Broad Guidelines. The present document reviews the progress made in implementing the Community's economic policy strategy according to each of the headings in the 1996 Guidelines.
1. Macroeconomic policy-mix for growth, employment and convergence
1.1 Macroeconomic policy-mix
In line with previous Guidelines, the 1996 Broad Economic Policy Guidelines recommended a "stable macroeconomic framework characterised by:
- a stability-oriented monetary policy whose task is not undermined by inappropriate budgetary and wage developments;
- sustained efforts to consolidate public finances in most Member States consistent with the objectives of their convergence programmes;
- nominal wage trends consistent with the price stability objective; at the same time, real wage developments should be below the increase in productivity in order to strengthen the profitability of employment-creating investment. "
In overall terms, the macroeconomic policy-mix in the Community has been in line with these recommendations. Both monetary policies, fiscal policies and wage trends have evolved favourably:
- Monetary policies have been credibly oriented towards achieving and maintaining price stability, both in Member States where inflation was already low and in Member States where further progress in disinflation was needed. At the same time, monetary conditions have provided room for an upturn in GDP growth in the Community. Short-term interest rates have reached historically low levels in Germany and countries whose currencies are linked closely to the DEM, and they have fallen considerably in most other Member States. This was mads possible by subdued price pressures and favourable budgetary and wage developments. Moreover, the credibility of the monetary policy framework has increased in several countries, particularly those which have established central bank independence and have made large efforts to fulfil the Treaty's convergence criteria for participation in EMU.
- Governments in virtually all countries have taken significant steps to consolidate their public finances in 1996-97. Although some countries to some extent have relied on one-off measures which will need to be complemented by lasting budgetary measures, a substantial structural improvement in the budgetary position is clearly taking place in the Community. Furthermore, the framework for the maintenance of sound public finances over the medium term has been strengthened with the political agreement on the Stability and Growth Pact at the Dublin European Council.
In most countries, wage agreements have increasingly been consistent with the Guidelines recommendation. For the Community as an average, nominal compensation per employee rose by 3/2 per cent in 1996 and the average rate of wage increases is expected to be around 3 per cent in 1997. With a productivity growth trend of around 2 per cent, this is consistent both with the price stability objective and with the objective that annual real wage developments should be sufficiently below the productivity trend to strengthen the profitability of investment in the Community.
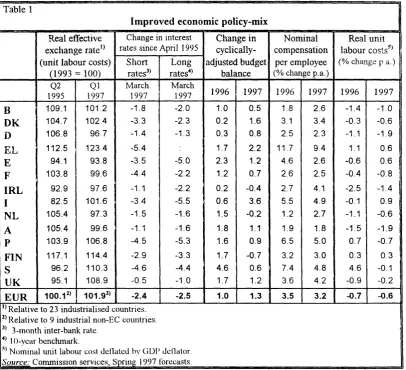
The increasingly well-balanced macroeconomic policy-mix in the Community as a whole has already brought important benefits. The exchange rate misalignments which occurred during 1995 have been broadly reversed and a higher degree of exchange rate stability has returned within the ERM. Long-term interest rates have converged towards lower levels. The most spectacular reductions in bond yields have occurred in countries where the prospects for budgetary convergence have improved most significantly. Between April 1995 and March 1997, the yield on ten-year benchmark bonds declined in Spain, Italy, Portugal and Sweden by between 440 and 550 basis points. Bond yields in other Member countries also dropped significantly during 1995 and
[image:5.593.99.506.293.663.2]1996 as they managed to decouple to a significant degree from US long rates.
Table 1
Improved economic policy-mix
Real effective exchange rate1*
(unit labour costs)
(1993 = 100)
Change in interest rates since April 1995
Short rates3) Long rates4) Change in cyclically-adjusted budget balance Nominal compensation per employee
(% change p.a.)
Real unit labour costs?) (% change pa.)
Q2 1995 Ql 1997 March. 1997 March
1997 1996 1997 1996 1997 1996 1997
B DK D EL E F IRL I NL A P FIN S UK 109.1 104.7 106.8 112.5 94.1 103.8 92.9 82.5 105.4 105.4 103.9 117.1 96.2 95.1 101.2 1 0 2 4
96.7 123.4 93.8 99.6 97.6 101.6 97.3 99.6 106.8 114.4 110.3 108.9 -1.8 -3.3 -1.4 -5.4 -3.5 -4.4 -1.1 -3.4 -1.5 -1.1 -4.5 -2.9 -4.6 -0.5 -2.0 -2.3 -1.3 -5.0 -2.2 -2.2 -5.5 -1.6 -1.6 -5.3 -3.3 -4.4 -1.0 1.0 0.2 0.3 1.7 2.3 1.2 0.2 0.6 1.5 1.8 1.6 1.7 4.6 1.7 0.5 1.6 0.8 2.2 1.2 0.7 -0.4 3.6 -0.2 1.1 0.9 -0.7 0.6 1.2 1.8 3.1 2.5 11.7 4.6 2.6 2.7 5.5 1-2 1.9 6.5 3.2 7.4 3.6 2.6 3.4 2.3 9.4 2.6 2.5 4.1 4.9 2.7 1.8 5.0 3.0 4.8 4.2 -1.4 -0.3 -1.1 1.1 -0.6 -0.4 -2.5 -0.1 -1.1 -1.5 0.7 0.3 4.6 -0.9 -1.0 -0.6 -1.9 0.6 0.6 -0.8 -1.4 0.9 -0.6 -1.9 -0.7 0.3 -0.1 -0.2
EUR 100.12 ) 101.92) -2.4 -2.5 1.0 1.3 3.5 3.2 -0.7 -0.6
^Relative to 23 industrialised countries. Z) Relative to 9 industrial non-EC countries. 3) 3-month inter-bank rate
4) 10-year benchmark.
5) Nominal unit labour cost deflated by GDP deflator.
Although there could be a backlash if the credibility of budgetary objectives were undermined, sounder macroeconomic policies are now underpinning a "virtuous circle" where budgetary consolidation has led to lower interest rates which strengthens the growth prospects of the economy and lowers government interest payments. The sound economic policies have led to an improvement in economic confidence and a gradual strengthening in economic activity.
1.2 Upturn in economic activity
The set-back to demand growth and the loss of confidence among economic operators in the second half of 1995 ~ which occurred mainly as a result of unfavourable interest rate and exchange rate developments rooted in a lack of credibility of economic policies in some Member States ~ has given way to a renewed upturn. Thus, the soundfy-based recovery which began in mid-1993 and which was temporarily interrupted in 1995 is now entering its second phase. Economic activity grew at a pace of VA per cent (annualised rate) in the first half of 1996, in spite of a large correction of stock levels. In line with expectations, the pace of expansion accelerated to around 2V< per cent in the second half of 1996.
The near term prospects are for a progressive strengthening of the recovery. Economic confidence improved sharply over the last months of 1996 and the first months of 1997. Conditions on the supply side of the economy are favourable to a sustained pick-up in economic activity and job creation, and demand prospects are improving.
On the supply side, the fundamentals in terms of prospects for moderate wage increases and sound investment profitability are better even than they were during the high-growth period 1986-90 and the first leg of the recovery in 1994 and early 1995. The prospects for moderate wage increases are underpinned by low and stable inflation expectations related to the enhanced credibility of the stability framework and by efforts to improve the functioning of the labour market in several Member States. Real wage increases have generally moderated relative to productivity and average investment profitability in the Community is now higher than at any time since the 1960s. Even though real interest rates are also higher than in the 1960s, the current and prospective level of profitability provides a good basis for a strong pick-up in investment as demand prospects strengthen.
The main risk to this outlook arises from the possible emergence of doubts as to whether governments will meet their budgetary objectives in 1997. Such doubts could lead to pressure on
interest and exchange rates with potentially damaging consequences for output, investment and employment. Moreover, consumers wary of uncertain job prospects could hold back more than expected on new purchases. On the other hand, as the positive effects of lower interest rates progressively comes through and if the recent improvement in confidence is sustained, a self-feeding cycle of increased spending and employment could lead to a more positive outcome.
1.3 Gradually improving employment outlook
Employment growth, which typically reacts to changes in output growth with a certain lag, suffered a set-back in early 1996 in most countries. But as economic activity gradually firmed, total employment in the Community stabilised and then began rising slowly in the second half of 1996. These trends were reflected in the evolution of unemployment. Average unemployment stabilised during the first half of 1996 and has since edged down marginally. However, trends varied significantly between Member States. The unemployment rate was on a declining trend in late 1996/early 1997 in all the countries where economic activity was expanding at a healthy pace, including the United Kingdom, Finland, Ireland, the Netherlands and Denmark. In contrast, unemployment was still increasing in Germany, France and Sweden in late 1996/early 1997 as the recovery was still hesitant and, in some cases, as special factors contributed to a rise in the number of unemployed.
The rebound in economic activity will lead to progressively stronger job creation. However, the labour force will also increase and unemployment is likely to decline only gradually during 1997 and somewhat faster in 1998.
The high level of unemployment points to the need for a continuation and reinforcement of the economic policy strategy for growth and employment in the Community. A stable and investment-enhancing macroeconomic policy-mix is necessary to ensure sustained economic growth and job creation over the medium term, capable of ensuring a marked reduction in unemployment and of employing progressively the high potential residing in the unused labour reserve in the Community.
In countries (Denmark, Ireland, Luxembourg and the Netherlands) which have for some time followed economic policies and achieved wage trends ~ helped also by an intensive and effective social dialogue ~ approximately in line with the Broad Economic Policy Guidelines and which have reduced their budget deficit ratios to below the Maastricht Treaty's reference value of 3 percent of GDP, the results in terms of sustainable economic growth and job creation have been favourable and are clearly among the best in the Community.
1.4 Social dialogue
The 1996 Broad Guidelines noted that the Commission intended to intensify its dialogue with the social partners. The social dialogue should also be intensified, where possible and according to prevailing traditions, at the national level.
growth and employment. With respect to the macroeconomic framework, there was a noteworthy consensus in favour of the economic policy strategy laid down in the Broad Economic Policy Guidelines. The Social Partners agreed on the great importance of completing EMU and recognised that, to ensure credibility, the Treaty provisions must be met in full. At the heart of the strategy is the need to improve competitiveness, and to foster higher and more employment-creating growth, mainly supported by capacity-expanding investment. More active and efficient labour market policies must also be implemented to increase incentives and ensure that people are able to take up the job opportunities thus created.
In Germany, the government and the social partners launched an "Alliance for jobs" in January 1996 with the aim of halving unemployment by the year 2000, but the initiative has not progressed as hoped for. In Ireland, a new tripartite agreement (Partnership 2000) was concluded covering the period to the year 2000. In Austria, co-ordination between the social partners was re-intensified in order to help meet the Maastricht-criteria. In Italy, an accord was reached in September 1996 to introduce more flexibility in employment contracts, better incentives for part-time work and co-ordinated action to promote business expansion in less developed regions. In Spain, agreement between the social partners was reached on specific issues on a case-by-case basis and in early 1997 agreement was reached on a reform of job protection legislation. In Portugal, a "strategic agreement" was reached covering a wide range of issues, including employment, education, social security, tax reform, income policies, competitiveness, productivity and reform of the public administration. In the remaining countries, including countries such as the Netherlands and Denmark where long-standing social consensus has provided a basis for comparatively favourable economic performance, the social dialogue has continued according to national traditions.
2. Price and exchange rate stability
2.1 Price stability
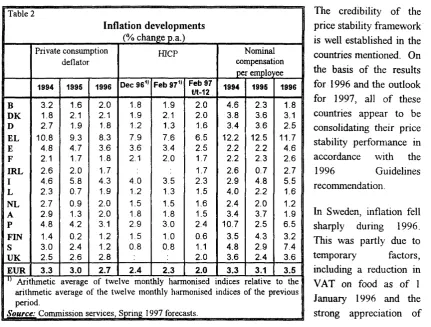
For the Community as a whole, the 1996 Guidelines urged that the expected 2'A percent inflation result in 1996 be improved upon in 1997. The Guidelines recommended that in the countries where inflation was below 2 per cent (Belgium, Germany, France, Luxembourg, the Netherlands, Austria and Finland) or just above 2 per cent (Denmark and Ireland), the task would be to consolidate this performance over the medium term. In Sweden, where inflation had come down significantly, and in the United Kingdom, where inflation was around 3 per cent and on a downward trend, economic policies were to aim at consolidating the results achieved. Spain, Portugal and Italy were urged to reduce inflation to below 3 per cent by 1997 while in Greece, efforts to reduce inflation needed to be continued and enhanced.
On the basis of the latest HICP data1, inflation in Belgium, Denmark, Germany, France, Ireland,
Luxembourg, the Netherlands, Austria and Finland was about 2 per cent or less and price increases are likely to remain around VA per cent or less in all cases in 1997.
In the countries mentioned, low inflation in 1996 was generally underpinned by moderate wage increases. The rate of increase in nominal compensation per employee, including employers' social contributions, was below 3 % per cent and in some cases even below 2 per cent.
[image:9.594.81.513.215.542.2]The prospects for price stability in 1997 are reinforced by the outlook for moderate wage increases. In Belgium, Germany, France, the Netherlands, Finland and Austria, the outlook is for increases in nominal labour costs per employee of 3 per cent or less in 1997. In Denmark, recent wage settlements should lead to an average increase in wage costs of around VA per cent per year over the next two to three years unless wage drift increases.
Table 2
Inflation developments
(% change p.a.) |
B DK D EL E F BRL I L NL A P FIN S UK EUR " Arit arith peri Soura Private consumption deflator 1994 3.2 1.8 2.7 10.8 4.8 2.1 2.6 4.6 2.3 2.7 2.9 4.8 1.4 3.0 2.5 3.3 1995 1.6 2.1 1.9 9.3 4.7 1.7 2.0 5.8 0.7 0.9 1.3 4.2 0.2 2.4 2.6 3.0 1996 2.0 2.1 1.8 8.3 3.6 1.8 1.7 4.3 1.9 2.0 2.0 3.1 1.2 1.2 2.8 2.7 HICP
Dec 961' 1.8 1.9 1.2 7.9 3.6 2.1 4.0 1.2 1.5 1.8 2.9 1.5 0.8 2.4
Feb 971' 1.9 2.1 1.3 7.6 3.4 2.0 3.5 1.3 1.5 1.8 3.0 1.0 0.8 2.3 Feb 97 t/t-12 2.0 2.0 1.6 6.5 2.5 1.7 1.7 2.3 1.5 1.6 1.5 2.4 0.6 1.1 2.0 2.0 Nominal | compensation | per employee I 1994 4.6 3.8 3.4 12.2 2.2 2.2 2.6 2.9 4.0 2.4 3.4 10.7 3.5 4.8 3.6 3.3 1995 2.3 3.6 3.6 12.5 2.2 2.3 0.7 4.8 2.2 2.0 3.7 2.5 4.3 2.9 2.4 3.1 1996 1.8 3.1 2.5 11.7 4.6 2.6 2.7 5.5 1.6 1.2 1.9 6.5 3.2 7.4 3.6 3.5 hmetic average of twelve monthly harmonised indices relative to the imetic average of the twelve monthly harmonised indices of the previous ad.
zj_ Commission services, Spring 1997 forecasts.
The credibility of the price stability framework is well established in the countries mentioned. On the basis of the results for 1996 and the outlook for 1997, all of these countries appear to be consolidating their price stability performance in accordance with the
1996 Guidelines recommendation.
In Sweden, inflation fell sharply during 1996. This was partly due to temporary factors, including a reduction in VAT on food as of 1 January 1996 and the strong appreciation of
1 Harmonised Indices of Consumer Prices; inflation is calculated on the basis of the arithmetic average of
the Swedish krona from previous LOWS. The latest trends point towards continued low rates of price increases. However, labour costs per employee increased by around 7.4 per cent in 1996; a rate which would clearly not be compatible with the maintenance of price stability, growth and employment over the medium tenn. Recent wage agreements have been concluded at lower levels but after allowing for wage drift, the rate of labour costs increases per head could still be close to 5 per cent in 1997. If Sweden is to live un to the Guidelines recommendation and the results in terms of price stability are to be consolidated, a marked deceleration in nominal wage increases is required.
In the UK, the large appreciation of the Pound Sterling in late 1996 and early 1997 exerted a restraining impact on price pressures in early 1997. On the other hand, consumption growth v/as buoyant and the output gap was closing at a fast rate. Unemployment has fallen rapidly to levels which have historically been associated with an upturn in wage pressures. Thus, although inflation is expected to subside slightly and the growth of nominal compensation per employee is forecast to be around 4 per cent in 1997, the risks of a worse outcome cannot be disregarded. The UK authorities need to be vigilant in guarding against the emergence of a price-wage spiral if the results in terms of low inflation are to be consolidated.
In Portugal, annual inflation fell to 3.0 per cent by February 1997 (latest 12 months over previous 12 months; HICP) while the latest figure stood at 2.4 per cent (February 1997 over February 1996; HICP). Disinflation is helped by lower nominal wage increases and by continued labour productivity gains in excess of the Community average. In Spain, inflation is on a downward trend and while annual HICP inflation amounted to 3.4 per cent by February 1997, the latest figure was down to 2.5 per cent. Given the continued anti-inflationary vigilance of the monetary authorities and good prospects for continued moderate wage increases, Spain is on track to achieve low inflation in 1997. In Italy, inflation has come down sharply over the course of 1996 and early 1997 (annual inflation at 3.5 per cent but latest figure at 2.3 per cent) helped by stability-oriented monetary policies, slightly moderating wage increases and a large appreciation of the lira since mid-1995. The growth of nominal compensation per employee is expected to edge downwards but it may still be close to 5 per cent in 1997. Nevertheless, with a stable lira and pressure on operating margins, the government's inflation target of 2.5 per cent for the year as an average (CPI) is within reach. In all three countries, the 1996 Guidelines recommendation is set to be fulfilled and inflation is expected to undershoot the 3 per cent mark with some margin.
In Greece, efforts to reduce inflation have been continued and enhanced in line with the 1996 Guidelines recommendation. Annual inflation measured by the HICP fell to 7.6 per cent (latest 12 months over previous 12 months) while the latest figure (February 1997 over February 1996; HICP) stood at 6.5 per cent. Continued efforts are required in order tc reach the government's target of 4.5 per cent inflation by year-end (CPI).
2.2 Exchange rate stability
Since 1995, sounder economic policies in the Community, increased budgetary credibility in a number of Member States and a strengthening US-dollar have contributed to a more appropriate alignment of exchange rates within the Community. The rebound in the US-dollar reflected the relatively strong cyclical position of the US economy as well as changes in the respective policy-mix in the US and (he Community. Enhanced policy credibility helped the Italian lira, the Swedish krona and several other currencies to recuperate much or all of earlier losses relative to the DEM. The pound sterling appreciated markedly relative to most ERM currencies in late 1996 and early 1997 against the background of the stronger dollar, high economic growth and prospects for a rise in interest rates. The spring 1995 overvaluation of the DEM, and currencies closely linked to the DEM, has been unwound.
Finland and Italy joined the exchange rate mechanism of the EMS on 14 October and 25 November 1996, respectively. Currently, 12 Member States participate in the exchange rate mechanism (ERM); only Greece, Sweden and the United Kingdom do not participate.
Within the ERM, the spread between the strongest and weakest currencies in the grid narrowed progressively to some 2 per cent in late September 1996. Subsequently, this spread widened as the Irish pound appreciated significantly relative to other ERM currencies. This was the result of three factors, namely the appreciation of the pound sterling and the US-dollar relative to the ERM-currencies, the strong cyclical position of the Irish economy which has not led to a tightening of budgetary policies; and the higher levels of interest rates associated with the strong growth.
All other ERM currencies remained within narrow margins against each other. In overall terms, exchange rate stability within the ERM has been maintained and improved since the adoption of the 1996 Broad Guidelines.
3. Sound public finances
3.1 The pace and size of consolidation efforts
The 1996 Guidelines stressed that the generally unsatisfactory state of the public finances in the Community should lead Member States to review and, where necessary, to strengthen their fiscal consolidation plans. The Council recommended that virtually all Member States should aim at lowering the budget deficit to, at most, 3 percent of GDP in 1997, as a step towards the objective of close to balance in the medium term.
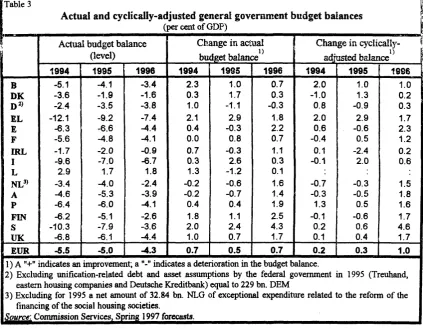
Budget results in 1996: All Member States except Germany made progress towards reducing their budget deficit in 1996. For the average of the Community, the budget deficit declined to 4.3 percent of GDP in 1996 from 5.0 per cent of GDP in 1995. This improvement was achieved despite the deterioration in the cyclical position which exerted an adverse impact on tax revenues and public spending. Adjusted for cyclical effects, the budget balance for the Community as an average improved by 1 percentage point of GDP, according to the estimates of the Commission services2. This represented a much larger reduction in the cyclically-adjusted budget deficit than
[image:12.595.95.519.209.538.2]had been achieved in the preceding years (table 3). The cyclically-adjusted deficit was reduced significantly in a large majority of Member countries in 1996. Among the countries subject to a 1996 Council decision on the existence of an excessive deficit, only Germany failed to make substantial progress in reducing the cyclically-adjusted budget deficit in 1996.
Table 3
Actual and cyclically-adjusted general government budget balances (per cent of GDP)
Actual budget balance (level)
1994 1995 1996
Change in actual budget balance
1994 1995 1996
Change in cyclically' adjusted balance
1994 1995 1996
B DK D2) EL E F IRL I L
NL3> A P FIN S UK -5.1 -3.6 -2.4 -12.1 -6.3 -5.6 -1.7 -9.6 2.9 -3.4 -4.6 -6.4 -6.2 -10.3 -6.8 -4.1 -1.9 -3.5 -9.2 -6.6 -4.8 -2.0 -7.0 1.7 -4.0 -5.3 -6.0 -5.1 -7.9 -6.1 -3.4 -1.6 -3.8 -7.4 -4.4 -4.1 -0.9 -6.7 1.8 -2.4 -3.9 -4.1 -2.6 -3.6 -4.4 2.3 0.3 1.0 2.1 0.4 0.0 0.7 0.3 1.3 -0.2 -0.2 0.4 1.8 2.0 1.0 1.0 1.7 -1.1 2.9 -0.3 0.8 -0.3 2.6 -1.2 -0.6 -0.7 0.4 1.1 2.4 0.7 0.7 0.3 -0.3 1.8 2.2 0.7 1.1 0.3 0.1 1.6 1.4 1.9 2.5 4.3 1.7 2.0 -1.0 0.8 2.0 0.6 -0.4 0.1 -0.1 -0.7 -0.3 1.3 -0.1 0.2 0.1 1.0 1.3 -0.9 2.9 -0.6 0.5 -2.4 2.0 -0.3 -0.5 0.5 -0.6 0.6 0.4 1.0 0.2 0.3 1.7 2.3 1.2 0.2 0.6 1.5 1.8 1.6 1.7 4.6 1.7
EUR -5.5 -5.0 -4.3 0.7 0.5 0.7 0.2 0.3 1.0
1 ) A "+" indicates an improvement; a "-" indicates a deterioration in the budget balance.
2) Excluding unification-related debt and asset assumptions by the federal government in 1995 (Treuhand, eastern housing companies and Deutsche Kreditbank) equal to 229 bn. DEM
3) Excluding for 1995 a net amount of 32.84 bn. NLG of exceptional expenditure related to the reform of the financing of the social housing societies.
&M«£g^Comnu^sionService^
In 1996, the budget deficit remained below 3 per cent of GDP in Denmark, Ireland and Luxembourg. However, Denmark made less-than-expected progress in reducing its deficit and the objective stated in the convergence programme (1.0 percent of GDP) was not achieved. The budget overrun was mainly due to an overshoot in public spending. In Ireland, the budgetary situation improved more than expected as revenues were boosted by high economic growth.
2 The Commission services' method of cyclical adjustment takes a cautious approach in that it produces
levels of cyclically-adjusted budget deficits which tend to be higher compared to those of other methods,
However, notwithstanding the positive effects of the economic cycle, expenditure growth breached the government's initial target by a considerable margin for the second year running. Despite the need to tighten budgetary policies in the current cyclical environment and the need to secure a larger budgetary safety margin for when cyclical conditions become less favourable, there was no improvement in the cyclically-adjusted budget deficit in 1996.
Both the Netherlands and Finland managed to reduce their deficits to below 3 percent of GDP in 1996. Although helped by relatively high economic growth, this was mainly the result of determined consolidation efforts.
Belgium, France, Austria, Portugal and Sweden succeeded in bringing their deficit down to around or below 4 per cent of GDP. In these countries, the budget improvement was considerable in 1996, and for several of them the outcome was better than the government's target. In Belgium, the budget deficit was above the original objective (3.4 per cent against 3 per cent of GDP), but the country has made significant headway towards the 3 per cent reference value. In France, the outcome was marginally above the target set in the convergence programme (4.1 per cent vs. 4 per cent of GDP). In Spain and the United Kingdom, the deficit declined to 4.4 percent of GDP. In all of these countries, fiscal consolidation programmes were resolutely implemented in line with the Guidelines recommendation.
Gennany was the only Member State in which the budget deficit increased in 1996. As a result of adverse cyclical conditions, the deficit reached 3.8 per cent of GDP after 3.5 per cent in 1995. Despite efforts to strengthen expenditure control, hardly any improvement was made to the cyclically-adjusted budget balance in 1996. Most of the budgetary measures agreed in Germany during 1996 take effect in 1997.
Italy achieved only a modest reduction in the budget deficit which turned out at 6.7 per cent of GDP in 1996 against 7.0 percent of GDP in 1995. Both worse-than-expected cyclical conditions and budgetary slippage contributed to the disappointing result. With the adoption of the budget for 1997, the decision was taken to accelerate the pace of fiscal adjustment. With respect to the budget discipline of local government an important new set of rules was included in the budget for
1997.
In Greece, the budget deficit was reduced to 7.4 per cent of GDP in 1996. The improvement was to a large extent due to a reduction in the interest burden made possible by lower interest rates and a stable debt-to-GDP ratio. The tax base has not been broadened as expected and real current expenditure has been reduced only marginally.
Debt-to-GDP trends in 1996: Although the Member States achieved a widespread and significant improvement in budgetary positions in 1996, the budgetary imbalances in the Community were still large. This resulted in a continued upward trend in the debt-to-GDP ratio in 1996. For the Community as an average, the debt ratio rose from 71.2 per cent in 1995 to 73.2 per cent of GDP in 1996. The debt ratio continued rising in Germany, Spain, France, Austria and the United Kingdom. The debt ratio remained at or below 60 per cent of GDP only in France, Luxembourg, Finland and the United Kingdom, but it was declining in a number of Member States (see table 4).
1 ) Government deposits with the central bank, government holdings of non-government bonds and public enterprises related debt amounted to some 16 % of GDP in 1996.
Source: Commission Services, Spring 1997 forecasts.
Budgetary prospects for 1997: Efforts to achieve sound public finances have been stepped up throughout the Community. Virtually all Member States are aiming to reduce their budget deficits to, at most, 3 percent of GDP by 1997, as a step towards the objective of close to balance in the medium term. The only exception is Greece where the government aims to reduce the deficit to 4.2 percent of GDP.
Among the countries which had a budget surplus or a budget deficit below 3 per cent of GDP in 1996 (Denmark, Ireland, Luxembourg, the Netherlands and Finland), the deficit is expected to fall further in Denmark, the Netherlands and Finland. These countries are thus moving in the direction of more ambitious medium-term targets. In Denmark, the budgetary outlook in 1997
is now more favourable than expected in the May 1996 convergence programme and a small surplus is aimed at. However, the budget for 1997 includes some one-off measures and is buoyed by a favourable cyclical position. Also, reaching the objective depends on the ability to conduct tighter discipline in 1997 than was achieved in 1996. In Finland, a general government surplus is targeted in 1999. The budget for 1997 and the ceilings for central government expenditure in
1998-2001 are in line with a steady reduction in deficits in the coming years.
In all of the remaining countries, with the exception of Greece, measures have been adopted to reduce budget deficits to 3 per cent of GDP in 1997. Furthermore, governments have generally undertaken strong commitments to take any supplementary measures which might be needed to meet this target.
In Belgium, Germany, France, Austria, Portugal and Sweden, the planned improvement in 1997 relative to 1996 to reach the 3 per cent target is around 1 percentage point of GDP or less. In Germany, most of the measures contained in the policy packages for growth, investment and jobs presented in early 1996 have been agreed and are taking effect from 1997 onwards. The government has announced that further corrective measures would be taken if there were a further shortfall in tax revenues in 1997. In France, the return to balanced social security accounts will not be reached in 1997 as had originally been planned, but measures have been taken to reduce the social security deficit, and to keep the general government balance within the target in 1997.
Italy has adopted measures to achieve a very large improvement in the budgetary position in 1997 in order to reach the 3 per cent target. Following the worse-than-expected outcome in 1996, a mini-budget was put forward in March.
In Greece, the convergence programme aims at a general government deficit of 4.2 percent of GDP in 1997. The government has adopted a series of measures to reduce government expenditure and to reach the target.
3.2 The composition and durability of consolidation efforts
The 1996 Guidelines identified the following general principles for budgetary consolidation:
(i) restraining expenditure increases, as opposed to further increases in the overall tax burden; among the issues to be addressed were pensions, health care costs and subsidies.
(ii) redirecting government spending, when possible, towards productive activities such as infrastructure, human capital and active labour market measures.
(Hi) improving the efficiency of public services; in some cases through increased use of privatisation and user-fees.
(iv) reducing the overall tax burden, but conditional upon first putting the budget deficit on a firm downward path.
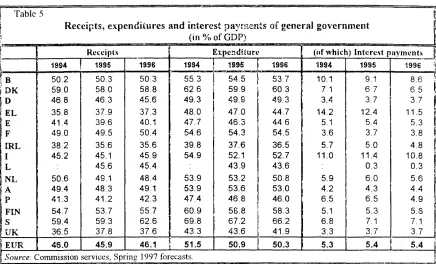
In 1996, the nature of Member States' consolidation efforts was not always in conformity with the Guidelines. The share of public expenditures in GDP was reduced in the majority of Member States in 1996 but it increased in Denmark, where it was already among the highest in the Community, as well as in France and Italy. Tax pressure increased, to a varying extent, in Denmark, Spain, France, Italy, Austria, Portugal, Finland and Sweden (table 5).
In 1997, budgetary consolidation is expected to be achieved mainly through expenditure restraint. For the Community as an average, the expenditure share is expected to decline by nearly VA percentage point this year. Provided current spending plans are adliered to and economic growth picks up broadly as expected, the share of public expenditures in GDP is expected to fall in virtually all Member States. Average tax pressure is expected to remain constant in 1997.
In a number of countries, the emphasis in consolidation efforts has shifted to expenditure restraint m 1997. In France, where most consolidation measures in 1996 took the form of tax increases, measures in 1997 (including restraint in public administration and a reform of the social security system, mainly concerning health care) are expected to lead to virtually no increase in real expenditure while taxes are slightly reduced. In Germany, consolidation measures concentrate on reduced spending (pension, sickness insurance and health care, subsidies, public sector employment and administrative costs). In Spain, key measures include a wage freeze in the public sector, a reduction in government employment, pension reforms and indirect tax increases. In Austria, the emphasis is shifting to expenditure restraint and includes health care reforms. In Finland, the 1997 budget improvement relies almost exclusively on expenditure cuts while some taxes arc being reduced. In the UK, the government is aiming to keep spending within narrow limits. In Italy, where social spending was not affected by budgetary consolidation and non-interest expenditure grew in real terms in 1996, progress is expected to be made in reducing the share of public expenditures in GDP in 1997. However, much of this comes from lower interest payments and the tax burden will increase again.
Some countries have relied to a considerable extent on deferrals of public investment to achieve deficit reduction in the short term This is the case in Spain (albeit From a high level) and. to a lesser extent, in Germany and France. In the United Kingdom, there has been a switch from public to private provisions. Only a few countries (Portugal, Finland) have raised public investment as a share of GDP in recent years.
Table 5
Receipts, expenditures and interest payments of general government (in % of GDP)
Receipts Expenditure ((if which) Interest payments
1994 1995 B D K D E L E F I R L I L N L A P FIN S U K 50.2 59.0 46.8 35.8 41.4 49.0 38.2 45.2 50.6 49.4 4 1 . 3 54.7 59.4 36.5
50.3 58.0 4 6 . 3 37.9 39.6 49.5 35.6 45.1 45.6 49.1 4 8 . 3 41.2 53.7 59.3 37.8
1996 1994 50.3
58.8 45.6 3 7 . 3 40.1 50.4 35.6 4 5 . 9 45.4 48.4 49.1 4 2 . 3 55.7 62.6 37.6 55.3 62.6 49.3 48.0 47.7 54.6 39.8 54.9 53.9 53.9 47.4 6 0 . 9 6 9 . 8 4 3 . 3
1995 1996 19S4
54.5 59.9 49.9 4 7 . 0 4 6 . 3 5 4 . 3 37.6 52.1 4 3 . 9 53.2 53.6 4 6 . 8 58.8 6 7 . 2 43.6
53.7
60.3 49.3 44.7 4 4 6 54.5 36.5 52.7 43.6 50.8 53.0 46.0 58.3 66.2 41.9 10.1 7.1 3.4 14.2 5.1 3.6 5.7 11.0 5.9 4.2 6.5 5.1 6.8 3.3 1995 9.1 6.7 3.7 12.4 5.4 3.7 5.0 11.4 0.3 6.0 4 . 3 6.5 5.3 7.1 3.7 1996 8.6 6 5 3.7 11.5 5.3 3.8 4.8 10.8 0.3 5.6 4.4 4.9 5.S 7.1 3.7
EUR 46.0 45.9 46.1 51.5 50.9 50.3 5.3 5.4 5.4
Source. Commission services, Spring 1997 forecasts.
Budgetary adjustments in Member States are relying to a varying extent on one-off measures, particularly in 1997. The use of one-off measures has in some cases contributed to strengthen the credibility of meeting the 3 per cent reference value by 1997 and has had positive effects en interest rates in some countries. Needless to say, however, the temporary nature of such measures does not contribute to a sustained improvement in the fiscal position. Therefore, in order not to undermine confidence in the establishment of sound public finances, they must be supplemented by measures which provide a lasting improvement to the budgetary situation. In spring 1998, when the decision will be made as to which countries have achieved a high degree of sustainable convergence required for the participation in the third stage of EMU from 1.1.1999, the Commission will assess the durable character of budget improvements also on the basis of Member States' budgets for 1998 and their convergence programmes.
4. Better functioning of product and services markets
The 1996 Guidelines recommended a reinforcement of competition policies and a curbing of State aids. It was crucial to exploit the Single Market potential through the transposition into national law and the effective enforcement of legislation. In addition, measures should be implemented aimed at promoting innovation, the information society, and SMEs. Environmental policies should rely more on market-based instruments, including fiscal ones.
A variety of measures, too numerous to be reviewed in full in the present document, have been taken at both the Community and the national level to boost the competitiveness and efficiency of the European economies. The present review concentrates on developments at the Community level and lists the most important initiatives taken at the national level in 1996.
Although transposition of Single Market measures continued to improve in 1996, inadequate transposition still emerges as a major concern in some sectors and areas. At the Community level, by early February 1997, the Council had adopted 259 Single Market proposals from the Commission, leaving just 11 outstanding. Of these, 4 concern company law while the rest cover company taxation, intellectual property, the free movement of persons, foodstuffs, insurance, veterinary controls and phytosanitary controls.
The measures adopted include 218 directives requiring national implementation laws. On average, Member States had transposed over 94 per cent of these into their domestic legal systems by February 1997, with 64 per cent correctly transposed by all Members States and 80 per cent by 14 Member States.
The Commission services' 1996 Single Market Review3 demonstrated that Member States'
product markets have become highly integrated as a result of globalisation and the Single Market, although product standards continue to raise difficulties; however, in product markets associated with public procurement and/or subject to nationally distinct regulations (e.g., pharmaceuticals) integration has failed to make much headway. For manufacturing products, Member States' domestic demand has increasingly been supplied by products imported from other Member States. Reductions in price-cost margins also show that the degree of competition in manufacturing sectors has significantly increased. Only in sectors associated with traditional or regulated public procurement has the effect on price cost margins been rather insignificant. Convergence in prices of identical products around the Community also suggest that the Single Market has led to further integration of goods markets. Markets in services have remained significantly less integrated than goods markets, but substantial progress has taken place. Around the Community, competition and efficiency are intensifying. But state aids, national taxes and domestic regulations continue to fragment some markets, particularly for services.
3 See Commission Communication on "The impact and effectiveness of the Single Market"
(COM(96)52(), October 1996) and "Economic Evaluation of the Internal Market" (European Economy, Reports and Studies, No. 4, 1996).
The chief areas where work still remains in terms of transposing am implementing Community legislation in the Member States concern public procurement, intellectual property and insurance. The Single Market Review also indicated that uneven enforcement of EU legislation is a persistent barrier to trade or fair competition. This problem will be addressed in the Internal Market Action Plan currently in preparation.
In the field of telecommunications, the Community made further progress towards foil libéralisation, most notably by the adoption of two Commission Directives opening up competition in mobile telephony and requiring the abolition of monopoly rights in voice telephony in most Member States by I January 1998. In the energy sector, the Council adopted a directive on common rules for the internal market in electricity. Tins directive provides for the gradual opening of competition over a period of six years. The corresponding proposal concerning the gas industry is still before the Council. In the transport sector, the Council adopted a directive opening up competition for the provision of ground services at airports.
With a view to removing unnecessary obstacles to the diffusion of innovation, the Commission adopted a new regulation in January 1996, simplifying the conditions for exemption under Article 85 for technology transfer agreements. The Commission also adopted a communication updating its 1994 action plan for the information society and announced its intention to bring forward proposals to harmonise legislation concerning intellectual property rights in this field.
In order to give a new impetus to the promotion of SMEs at the Community level, the Council adopted the third multi-annual programme for SMEs in December 1996. In its "Integrated programme for SMEs and the craft sector" of July 1996, the Commission envisages complementing the measures of the multi-annual programme with other measures such as joint action with Member States to facilitate access to the information society and the simplification of Community legislation.
In the area of environment and taxation, the Commission adopted a proposal for an energy products tax in early 19974. This proposal represents a re-structuring of the system of excise
duties which would both extend the scope of taxation to all energy products that damage the environment, and increase the levels of taxation on these products from 1998 and again in the year 2000. Such steps provide important price signals to energy users, encouraging them to reduce consumption and thereby cause less pollution. The Commission also adopted a Communication on the use of environmental taxes and charges in the internal market5. This Communication is
intended to assist the Member States in their efforts to use fiscal instruments for environmental ends while respecting the requirements of the Treaty and the Single Market. The Communication emphasises that there is considerable room for action by the Member States, who are encouraged to increase the use of such taxes and charges.
4 Proposal for a Council Directive re-structuring the Community framework for the taxation of energy
products (COM(97)30 final of 12/03/97).
5 Communication from the Commission "Environmental taxes and charges in the Single Market"
(COM(97)9 final of 26/03/97).
At the national level, a comprehensive programme to improve competitiveness was put forward by the German government entitled "Offensive for entrepeneurship and innovation" This included measures to promote SMEs (easing of the fiscal burden on founders of new businesses, mobilising risk and venture capital, credit subsidies etc.) and innovation (financing conditions for applied R&D, reduced patenting costs for SMEs, etc.). Shopping hours have been liberalised and numerous other measures to improve the functioning of the economy are planned. The Spanish government put forward a package of structural measures, including action to reduce state aid to public enterprises, ease taxation on SMEs, and boost competition. In Portugal, the "strategic agreement" reached between the social partners and the government refers to the reinforcement of competition policies and to measures aimed at promoting innovation, the information society and SMEs. In Finland, the government has taken a large number of measures in favour of SMEs (better access to financing, training measures, etc.) and in Austria, increased financial and institutional support is given for innovation, research and development. In Denmark, a new competition law was put forward in 1996 which aims to strengthen anti-trust rules and bring the national framework more in line with that of other Member countries.
5. Fostering employment and labour market reforms
5. / Wage developments
The 1996 Guidelines recommended that real wage developments should be below the increase in productivity in order to strengthen the profitability of employment-creating investment. Higher employment growth would be fostered by the maintenance of appropriate average wage trends and in some cases by wage differentials that better reflect productivity differentials. Where possible, the 1996 Guidelines urged that a reduction in non-wage labour costs should be used to
encourage employment.
In recent years, wage trends in the Community have increasingly been in line with the objective of price stability, thereby allowing monetary and financial conditions favourable to growth and employment creation, as well as with the objective to strengthen investment profitability, thereby allowing the upswing to be supported by rapidly rising investment. For the Community as a whole, real wage costs (nominal compensation per employee deflated by the GDP deflator) increased by less than 1 per cent for the fourth consecutive year in 1996. This was sufficiently behind both trend and actual growth in labour productivity (at around 2 and 1.5 per cent, respectively) to provide remuneration for the higher stock of capital employed per worker and to strengthen the return on investment in the Community. The prospects for 1997 and 1998 are for a continued respect of this guideline in the Community.
The condition that real wage costs should increase at a slower rate than labour productivity was respected in nearly all Member States in 1996. In Greece, Portugal, Finland and especially in Sweden, real wage costs outpaced labour productivity in 1996. In these countries a deceleration in real wage increases is needed to enhance job creation in a durable fashion.
In the Community, the restoration of healthier levels of investment profitability has laid the ground for higher economic growth sustained by capacity-widening and employment-creating investment as demand prospects brighten. However, aggregate real wage moderation impacts only slowly on the intensity of growth. Another, more rapid route towards a more employment-intensive pattern of growth would be to encourage a downward widening of the wage cost scale as outlined in the Commission's 1997 Annual Economic Report.
Some countries have taken steps in the direction of ensuring that wage cost differentials take better account of productivity differentials between different occupations and skill levels and between different regions. A targeted reduction of non-wage labour costs at the lower end of the wage scale has taken place in France, Belgium and the Netherlands. In the Netherlands, the legislated minimum wage has increased by less than median wages. In contrast, there has been no halt to the process towards wage equalisation ahead of productivity trends between the former western and eastern Lander of Germany. High wage costs relative to productivity continues to hamper job creation in the eastern Lander of Germany.
Table 6 B DK D EL E F IRL I L NL A P FIN S UK EUR USA JAP
Growth, employment and productivity
Real GDP growth (% change p.a.)
90-92 2.3 1.0 4.2 1.2 2.2 1.5 5.0 1.3 4.2 2.8 3.1 2.9 -3.6 -0.4 -0.7 1.7 1.1 3.4 93-96 1.1 2.7 1.2 1.8 1.5 1.2 7.5 1.1 5.0 2.3 1.3 1.6 2.8 1.4 2.7 1.6 3.0 1.3 96 1.4 2.4 1.4 2.6 2.2 1.3 8.4 0.7 3.6 2.8 1.0 3.0 3.3 1.1 2.1 1.6 2.4 3.6 Employment (% change p.a.)
90-92 0.5 0.0 1.8 0.1 0.3 0.2 1.8 0.7 3.6 2.1 2.0 0.9 -4.2 -2.1 -1.5 0.3 0.3 1.6 93-96 -0.4 -0.4 -1.0 1.2 0.1 0.0 3.1 -1.5 2.3 1.1 1.1 -0.5 -0.9 -1.4 0.2 -0.4 1.7 0.2 96 0.0 1.0 -1.2 1.0 2.9 -0.1 3.8 0.4 2.4 1.9 -0.7 0.7 1.4 -0.6 0.7 0.3 1.4 0.6 Labour productivity (% change p.a.)
90-92 1.9 2.1 2.0 0.9 1.2 1.3 3.3 1.1 0.6 1.2 1.7 2.0 0.7 1.3 0.6 1.4 1.2 1.8 93-96 1.4 2.4 2.2 0.6 1.6 1.3 4.4 2.3 2.7 1.3 1.7 2.4 4.0 2.8 2.4 2.0 0.8 1.0 96 1.3 1.5 2.5 1.5 0.8 1.5 4.5 0.5 1.2 1.0 1.7 2.4 1.9 1.7 1.4 1.5 1.0 2.9
Real wage costs per employee (% change p.a.)
GDP deflator 90-92 3.6 1.5 1.6 -2.0 2.5 1.6 4.2 1.6 2.6 1.6 1.9 5.5 2.5 1.4 1.6 1.7 1.7 1.5 93-96 0.7 1.5 1.1 0.8 -0.5 0.6 1.5 -0.2 0.8 0.5 1.0 1.5 1.2 2.4 0.9 0.6 1.0 0.8 96 -0.1 1.2 1.4 2.6 0.2 1.0 1.9 0.4 -1.0 -0.2 0.2 3.1 2.1 6.4 0.5 0.8 1.8 0.5
Real unit labour cost (% change p.a.)
90-92 1.7 -0.6 -0.4 -2.8 1.3 0.3 0.9 0.6 1.9 0.4 0.2 3.4 1.8 0.1 0.9 0.3 0.5 -0.3 93-96 -0.7 -0.8 -1.1 0.2 -2.0 -0.6 -2.8 -2.4 -1.9 -0.8 -0.6 -0.9 -2.7 -0.5 -1.5 -1.4 0.2 -0.1 96 -1.4 -0.3 -1.1 1.1 -0.6 -0.4 -2.5 -0.1 -2.2 -1.1 -1.5 0.7 0.3 4.6 -0.9 -0.7 0.8 -2.3
Source: Commission services, Spring 1997 forecasts.
5.2 Labour market reforms
The 1996 Guidelines encouraged Member States to intensify their actions to reform labour markets in a number of areas, including occupational and regional mobility, employment services, education systems, active labour market policies particularly for the long-term unemployed, incentives for the employment of low-skilled labour, and working time adaptation.
The commitment to reduce unemployment as the main aim of economic policy has become part of the EU-wide strategy for employment initiated by the Essen European Council in 1994. Since then, the policy recommendations have been refined and made more precise in the subsequent European Councils and a close process of monitoring of their implementation has been developed in co-operation with the Member States.
Strategies and concrete measures at the national level have been embodied in multi-annual employment programmes (MAPs). MAPs allow a closer monitoring of national employment strategies and concrete measures, thereby facilitating identification and exchange of best practices. A first assessment of their implementation has been presented to the European Council in Dublin.
In the implementation of the MAPs, Member States have taken a very wide array of measures covering all the priority issues identified in Essen. On the demand side, the attention has focused on wage moderation and measures to reduce non wage labour costs as well as the promotion of flexible types of work arrangements and in some cases, the reduction in hiring and firing costs, with the aim of increasing the employment content of growth. On the supply side, work incentives and employability have been fostered through reforms of the social protection systems, active labour market policies (ALMPs) and training.
The attached Box provides a snapshot of some of the major labour market measures implemented in EU Member States in recent years. Some emerging patterns of reform involving one or several countries can be identified:
- Countries characterised by a traditionally high degree of social protection have started to curb their support levels via a revision of benefit duration and replacement incomes and, more frequently, through tightening of eligibility rules and controls on active job search by recipients. This has been coupled with increased flexibility of working time (for instance, the Netherlands) and emphasis on training and other ALMPs (the Nordic countries). Although some effort has been done to improve the efficiency and effectiveness of the latter measures, they may be expensive for public finances, at least in the short run, and may entail dead-weight and substitution effects.
- Measures to deregulate the labour market have been implemented in high unemployment countries. Spain, in particular, relaxed statutory employment protection for permanent employees, moving away from the deregulation "at the margin" (spreading of temporary contracts) which had deepened the segmentation of the labour market.
- Countries relying on a system of in-work benefits to top up income from work (the UK and Ireland) have implemented measures to reduce the high marginal effective tax rates in order to tackle potential poverty traps.
- Wage moderation has largely been implemented throughout the EU. Furthermore, a large number of countries have introduced reductions in non-wage labour costs, either through general cuts in social security contributions (e.g., Spain, Portugal, Finland, the UK, the Netherlands) or via reductions targeted on low wages to foster demand for low skilled labour (for instance, France, Belgium, the Netherlands).
- the comprehensive character of the structural reforms, including those in product and service markets and a strengthening of incentives to take up work, compared to the case of numerous but sparse measures without a critical mass;
- the involvement of a large share of the working population, including labour market insiders, thereby improving the perception of equity of the reforms, or the focus on a specific, but highly relevant "system failure" in the functioning of the labour market or the operation of the social protection system;
- the appropriate macroeconomic conditions combining a reasonable growth performance and the credibility of the commitment to sound macroeconomic management.
These basic pre-conditions allow to optimise synergy between various measures and, by enhancing the political and social acceptability of the structural reforms, reduce the likelihood of future policy reversal.
BOX: Main labour market reforms in EU countries in recent years
Vocational education and training
Apprenticeship schemes have been expanded (in A, B, FIN, F, D, IRL and E) and/or reviewed to respond more effectively to market needs (in DK, P, UK, D, IRL, I). A wide variety of innovative instruments to promote continued training have been implemented in IRL, F, NL, DK.
Working time flexibility
Widespread use of part-time contracts in DK, NL, S and the UK. Regulation on part-time work (E) and temporary contracts (D) have been relaxed; working time legislation has been liberalised (P, FIN, A). Other forms of working time flexibility have been introduced (A, D, B, DK, E, FIN, F).
Hiring and firing costs
Permissive stance of employment protection legislation in the UK and DK. Move to ease legislation for permanent workers in E and to increase the threshold for the application of job protection from companies with 5 employees to 10 employees in D. Alternatively, higher flexibility has been allowed via non standard labour contracting (fixed term contracts, part time) temporary work agencies, in a number of MS.
Non-wage labour costs
General reductions in non-wage labour costs (E, P, FIN, UK, NL) and targeted reduction at low end of the wage scale (for instance, F, B, NL).
Unemployment benefits and tax wedge
Replacement ratios and duration have been reduced in DK, IRL, NL, E and S and eligibility and availability to work requirements have been tightened in several countries (DK, UK, FIN, S, D). Adaptation of in-work benefits in UK and IRL to tackle poverty traps. Action to curb high marginal effective tax rates in F, UK, DK, IRL, S and NL (the latter reduced also the overall tax wedge on labour).
Active labour market policies
Substantive reforms of Public Employment Systems including, in some cases, the elimination of public monopoly in job brokerage, in S, FIN, DK, D, A, NL and B. Special efforts and targeting of ALMPs as well as measures under the above headings for the categories most affected by unemployment in most of the MS.