Elahi, A., Perez Algorta, G., Varese, F. et al. (2 more authors) (2017) Do paranoid
delusions exist on a continuum with subclinical paranoia? A multi-method taxometric study.
Schizophrenia Research, 190. pp. 77-81. ISSN 0920-9964
https://doi.org/10.1016/j.schres.2017.03.022
[email protected]
https://eprints.whiterose.ac.uk/
Reuse
This article is distributed under the terms of the Creative Commons Attribution (CC BY) licence. This licence
allows you to distribute, remix, tweak, and build upon the work, even commercially, as long as you credit the
authors for the original work. More information and the full terms of the licence here:
https://creativecommons.org/licenses/
Takedown
If you consider content in White Rose Research Online to be in breach of UK law, please notify us by
Do paranoid delusions exist on a continuum with subclinical paranoia? A
multi-method taxometric study
A. Elahi
a,⁎
, G. Perez Algorta
b, F. Varese
c, J.C. McIntyre
a, R.P. Bentall
aaUniversity of Liverpool, Institute of Psychology, Health and Society, Waterhouse Building, Block B, Brownlow St, Liverpool L69 3GL, United Kingdom bLancaster University, Spectrum Centre for Mental Health Research, Furness Building C73, Lancaster LA1 4YG, United Kingdom
c
University of Manchester, Division of Psychology and Mental Health, School of Health Sciences, Zochonis Building, Manchester M13 9PL, United Kingdom
a b s t r a c t
a r t i c l e
i n f o
Article history: Received 13 June 2016
Received in revised form 29 January 2017 Accepted 6 March 2017
Available online 18 March 2017
Background:There is widespread interest in whether psychosis exists on a continuum with healthy functioning. Previous research has implied that paranoia, a common symptom of psychosis, exists on a continuum but this has not been investigated using samples including both patients and non-patients and up-to-date taxometric methods.
Aim:To assess the latent structure of paranoia in a diverse sample using taxometric methods.
Method:We obtained data from 2836 participants, including the general population as well as at-risk mental state and psychotic patients using the P-scale of the Paranoia and Deservedness Scale. Data were analysed using three taxometric procedures, MAMBAC, MAXEIG and L-MODE (Ruscio, 2016), and two sets of paranoia in-dicators (subscales and selected items from the P scale), including and excluding the patient groups.
Results:Eleven of the twelve analyses supported a dimensional model. Using the full sample and subscales as in-dicators, the MAMBAC analysis was ambiguous. Overall, thefindings converged on a dimensional latent struc-ture.
Conclusions:A dimensional latent structure of paranoia implies that the processes involved in sub-clinical para-noia may be similar to those in clinical parapara-noia.
© 2017 Elsevier B.V. This is an open access article under the CC BY license (http://creativecommons.org/licenses/by/4.0/). Keywords:
Paranoia Taxometrics Dimensional MAMBAC MAXEIG L-MODE
1. Introduction
There is debate about whether psychotic symptoms lie on a contin-uum with less severe psychotic-like experiences, which are widespread in the general population (Lawrie et al., 2010). This debate has focused on the distinction between psychosis and schizotypal traits (Lenzenweger, 2010), with less attention being paid to specific symptoms.
Paranoid (persecutory) beliefs are the most common type of delu-sion, experienced by approximately 90% offirst episode schizophre-nia-spectrum patients. In a general population sample,Freeman et al. (2005)reported that paranoid beliefs occur on a hierarchy of severity, with rare and severe paranoid delusions building upon much more common forms of suspiciousness. Using latent class analysis and factor mixture modelling, they later found evidence of a paranoia continuum
with four underlying components: interpersonal sensitivity, mistrust, ideas of reference and ideas of persecution (Bebbington et al., 2013).
Taxometric methods, developed byMeehl (1995)are specifically de-signed to test for discontinuities in a spectrum of psychopathology. These procedures have been strengthened with new interpretational strategies that rely on quantitative indexes and researchers now use multiple analyses to interrogate a dataset (Ruscio et al., 2006). The methods have been used to study whether schizotypy is a dimensional construct, with mixed results (e.g.Rawlings et al., 2008; Lenzenweger, 2010). A systematic review reported that, with the exception of studies of alcoholism and addictions, most high-quality taxometric analyses, in-cluding those of schizotypy, have found continua between healthy func-tioning and mental illness (Haslam et al., 2012). It is possible that one source of ambiguity in the schizotypyfindings has been the focus on a broad diagnostic concept, rather than specific symptoms. To our knowl-edge, no taxometric studies of paranoia have been reported. We there-fore conducted taxometric analyses on data collected using a large population sample as well as patients with psychosis or with an at-risk mental state (ARMS;Yung et al., 2005).
The data was compiled from published and unpublished studies conducted over a seven-year period (2008 to 2015). Analyses were ⁎ Corresponding author at: University of Liverpool, Institute of Psychology, Health and
Society, Waterhouse Building, Block B, Brownlow St, Liverpool L69 3GL, United Kingdom. E-mail addresses:[email protected](A. Elahi),[email protected] (G. Perez Algorta),fi[email protected](F. Varese),
[email protected](J.C. McIntyre),[email protected](R.P. Bentall).
http://dx.doi.org/10.1016/j.schres.2017.03.022
0920-9964/© 2017 Elsevier B.V. This is an open access article under the CC BY license (http://creativecommons.org/licenses/by/4.0/).
Contents lists available atScienceDirect
Schizophrenia Research
2. Methods
2.1. Participants
Data was obtained from studies that included 2874 participants who had been asked to complete the PaDS, consisting of 2357 participants from the general population (2157 were students), 157 participants with an at-risk mental state (ARMS) for psychosis and 360 patients with schizophrenia-spectrum diagnoses. Of these, 38 participants (20 students, 2 non-student controls, and 16 clinical patients, 1.3% of the total) did not provide complete PaDS data, so ourfinal sample size was 2836. Participants with missing data did not differ on age or gender compared to those with complete data when the entire data set or indi-vidual groups were considered.
Student participants were recruited via cross-sectional studies con-ducted at Bangor, Lancaster, Liverpool and Manchester Universities: Pickering et al. (2008),Melo et al. (2009),Udachina et al. (2009)and Varese et al. (2011, 2012)and unpublished studies conducted for PhD qualifications by F. Varese and A. Udachina at Bangor University (both awarded 2012). The paranoia measures were completed online or in face-to-face interviews. Responses were mostly not anonymous and participants received course credits for completing the questionnaire; however, data was anonymised during the compilation of the present dataset.
Patients with schizophrenia-spectrum disorders were recruited through a series of cross-sectional and case-control studies, along with the non-student healthy controls. These studies wereVarese et al. (2011, 2012),Morrison et al. (2013),Sellwood et al. (2013),Udachina et al. (2014)andWickham et al. (2015)as well as unpublished studies conducted by K. Sitko and M. Haarmans while undertaking PhDs at Liv-erpool University (both awarded 2016). Participants varied in their clin-ical diagnoses which were clinician-assigned. However, the diagnoses for 351/360 patients and 200 non-student controls were supported by a researcher-conducted mental state interview using the Positive and Negative Syndrome Scale (see below). Patients were judged to meet the criteria for schizophrenia (273), acute and transient psychosis (12), schizoaffective disorder (34), delusional disorder (5), unspecific nonorganic psychosis (24), psychosis due to substance misuse (5), bipo-lar disorder (1) and postpartum psychosis (1). Five participants did not have a diagnosis recorded.
Those with an at-risk mental state were from two offive sites partic-ipating in a cognitive behavioural therapy trial (Morrison et al., 2012) and all met the at-risk mental health criteria based on a researcher-ad-ministered interview using the Comprehensive Assessment of At-Risk Mental States (CAARMS;Yung et al., 2005).
secutory belief (P scale) and appraisals about whether perceived perse-cution is deserved (D scale, not used in this study). Each item is scored on a 5-point Likert scale. The possible range of P scores is between 0 and 40.
The P scale has been validated in clinical and non-clinical samples and correlates withFenigstein and Vanable's (1992)paranoia scale, r= 0.78,N= 605 (Melo et al., 2009). There are no published cut-offs. However, if a cut-off of +1SD was used to estimate a paranoid taxon size, 13.24% of the students, 4.55% of the general population controls, 50.32% of ARMS patients and 36.91% of schizophrenia spectrum patients would be assigned to the paranoid category (498 participants). These figures seem reasonable given that previous studies of young adults have reported that a sizeable minority experience paranoid beliefs (for example, 12.6% of the Dunedin cohort study were judged paranoid; Poulton et al., 2000) and that many of the patients were in remission at the time of assessment.
A principal component analysis of the P items in the present dataset yielded a single component accounting for approximately 48% of the variance. The P scale was reliable with McDonald's coefficient omegahierarchicalfor the whole scale (Dunn et al., 2014) = 0.88 (95% CI = 0.87–0.89). Additionally, 351 clinical participants and 200 controls were assessed by interviewers using the positive and negative subscales of the Positive and Negative Syndrome Scale (PANSS;Kay and Opler, 1987); PaDS P scores correlated with PANSS delusions, r= 0.53, pb0.001 in the sample as a whole andr= 0.42,pb0.001 in the clinical participants only, and with PANSS suspiciousness,r= 0.65,pb0.001, in
the sample as a whole andr= 0.59,pb0.001 in the clinical participants
only (these correlations could not be meaningfully computed in the non-clinical participants alone because these PANSS subscales were re-quired to beb3, and hence there was insufficient variance in these
data).
Valid quasi-continuous indicators are recommended for taxometric analyses (Walters and Ruscio, 2009) and some procedures (e.g. MAXEIG) require at least three indicators. Of the four subdomains of paranoia identified byBebbington et al. (2013), PaDS items pertain to three, the exception being ideas of reference. Therefore, using these subdomains, we summed appropriate items to generate indicators at sub-scale level to conduct the analyses. P1, P3 and P9 were judged to constitute the category‘ideas of persecution’or threat of harm (e.g. P1:“There are times when I worry others might be plotting against me”); P2, P4, P6 and P7 were judged to constitute‘interpersonal sensi-tivity’to the negative opinions of others (e.g. P7:“There are people who think of me as a bad person”). P5, P8 and P10 were judged to rep-resent‘mistrust’(e.g. P10:“You should only trust yourself”).
[image:3.595.37.562.682.744.2]From the same analysis, MacDonald's omegasubscalewas calculated separately for the three subscales (Dunn et al., 2014). The values were
Table 1
Demographic data and PaDS scores.
Students from the general population Controls from the general population At-risk mental state participants Clinical patients
Females (N) 1517 120 71 190
Males (N) 621 80 86 170
Not disclosed (N) 19
Age mean (±SD) 21.6 (±5.8) 37.4 (±13.0) 20.2 (±4.2) 39.8 (±12.3)
0.72, (95% CI = 0.70–0.74) for ideas of persecution, 0.76 (95% CI = 0.75–0.78) for interpersonal sensitivity, and 0.69 (95% CI = 0.67–0.71) for mistrust. Correlations between these indicators ranged from 0.64 to 0.72. However, for taxometric analyses, it is desirable to have correla-tions between indicators that are as low as possible (Ruscio et al., 2006). Hence, to generate a second set of indicators, we identified items from each of the sub-scales that correlated the least with the other two sub-scale indicators. The lowest paired item correlations were between P1, P7 and P10; ranging from 0.27 to 0.37. Analyses were therefore con-ducted using both sets of indicators: the indicators at sub-scale level and the three single items indicators (P1, P7 and P10). Because we recognised a risk of creating a pseudo-taxon when combining the gen-eral population and clinical samples and, analyses werefirst conducted on the general population alone and then on the whole sample.
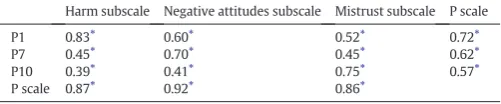
We calculated the three subscales vs. full-scale correlations as a min-imal indication of validity of the subscales inTable 2. Indicator validity was calculated through standardized mean differences (Cohen'sd) across cases assigned to putative taxon and complement groups using the base rate classification method (Ruscio et al., 2006).
2.3. Statistical analyses and procedure
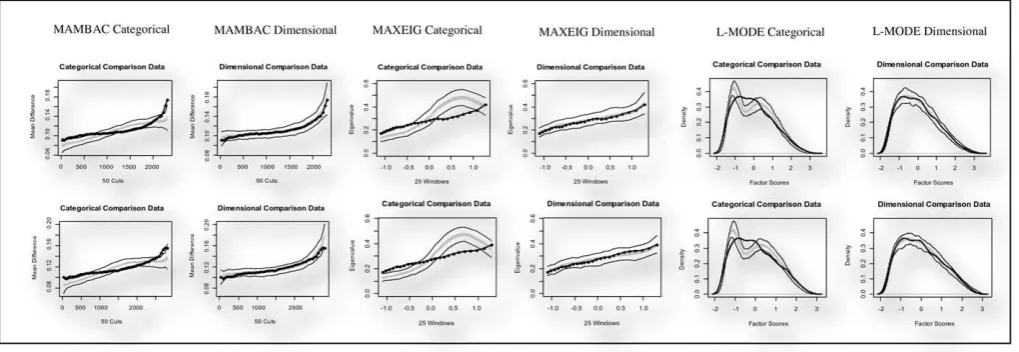
Taxometric programs for R (version 2014-07-29) were employed (Ruscio, 2016; available at http://ruscio.pages.tcnj.edu/quantitative-methods-program-code/). Mean above minus below a cut (MAMBAC; Meehl and Yonce, 1994), maximum eigenvalue (MAXEIG;Waller and Meehl, 1998) and latent mode factor analysis (L-MODE;Waller and Meehl, 1998) were conducted to examine the convergence between thefindings from different methods (Ruscio et al., 2006). Each analysis generates a characteristic plot. For the MAMBAC and MAXEIG function, the plot will be peaked when the latent variable is categorical butflat when it is dimensional. In the case of L-MODE, a bimodal graph is appar-ent when the data is categorical, but unimodal when the trait is dimensional.
MAMBAC, MAXCOV and L-MODE curves were compared to curves derived from simulated categorical and continuous comparison data (Ruscio et al., 2007). As well as visually inspecting the curves, we calcu-lated the comparison curvefit index (CCFI;Ruscio et al., 2007). The CCFI is a value between 0 (dimensional) and 1 (categorical), and evaluates thefit of the curves generated by the analyses in comparison with curves that would be expected if the construct was taxonic (categorical) or dimensional.Ruscio et al. (2006)suggest that the greater the devia-tion of a CCFI score from 0.5, the stronger the result. However, a CCFI score between 0.4 and 0.6 should be interpreted with caution.
3. Results
A full range of PaDS scores was obtained from all groups; this was expected as some patients were in remission and some of the ARMS group showed no paranoid symptoms when being tested. A one way ANOVA on these scores was highly significant, F[3,2382] = 101.39, pb0.001, with all groups differing from the others (Tukeypb0.001).
Results for the population sample (N= 2357) and then the whole sample combined (N= 2836) are presented inTable 3. We would ex-pect a taxon, if present, to be particularly evident in the latter analyses.
There were 2 (types of indicators) × 2 (datasets) × 3 (taxometric methods) = 12 analyses in total.
[image:4.595.311.560.76.129.2]The estimated validity of the item indicators was above a Cohen'sd value of 1.50 as recommended in taxometric analyses (Meehl, 1995). These values were higher than 2.0 when the sub scales were used as in-dicators. Estimated within-group correlations were non-problematic. Mean indicator correlations were higher in the full sample. When using subscales as indicators, the within-group correlations ranged from 0.04 to 0.49; the majority of values were below 0.30. The within-group correlations when using individual item indicators were between 0.002 and 0.18.
Table 3provides the summary values (CCFI) for these analyses. All but one analysis supports a continuum latent structure (CCFI values ranged from 0.08 to 0.59). The exception (0.59) that was observed when the whole sample was analysed using MAMBAC with the item in-dicators, reflected an ambiguous structural solution.
The graphical outputs of all analyses are shown inFig. 1. The graph-ical representations concord with the CCFI data; eleven of the graphgraph-ical outputs illustrate a dimensional underlying structure, while the MAMBAC function with the whole sample and item indicators poorly discriminates between the models.
4. Discussion
We examined the latent structure of paranoid beliefs in a large sam-ple of patients and participants from the general population. With one exception, the three taxometric methods, using two sets of indicators, demonstrated that the underlying structure of paranoiafitted continu-ous rather than taxonic simulation data.
The exception was the MAMBAC analysis with item-indicators that included patients. Although it is not clear why this analysis did not con-form to the results of the remaining eleven, it is important to note that the analyses including patients were most vulnerable to the identifi ca-tion of a pseudo-taxon. Despite this, infive out of six cases the results were unambiguously non-taxonic and, even in the case of the exception, the results were ambiguous (a taxon was not suggested but the contin-uum hypothesis was also not supported). Hence, we argue that the hy-pothesis that paranoia exists on a continuum with healthy functioning, as suggested byFreeman et al. (2005)andBebbington et al. (2013), was supported. Thisfinding is consistent with general models of a positive psychosis symptom continuum (e.g.,Claridge, 1987) and with research thatfinds evidence for continua across most areas of psychopathology (Haslam et al., 2012).
Confidence in thefindings is strengthened by concordance with pre-viousfindings using different methods. Using a population sample Freeman et al. (2005)found that the distribution of paranoia closely fitted a single continuous dimension.Bebbington et al. (2013)used a factor mixture modelling analysis on data collected from an epidemio-logical sample, againfinding evidence of a continuum.
[image:4.595.43.294.684.736.2]Ourfindings contrast with studies that have reported taxons in schizotypy (e.g. Everett and Linscott, 2015; Linscott et al., 2006; Linscott et al., 2010; Morton et al., 2016) although other studies have not reported schizotypy taxons (e.g.Ahmed et al., 2012; Ahmed et al., 2013).Haslam et al. (2012)have argued that studies with the highest Table 2
Single item/subscales and single item/P scale correlations (Spearman Rank correlations, rs).
Harm subscale Negative attitudes subscale Mistrust subscale P scale
P1 0.83⁎ 0.60⁎ 0.52⁎ 0.72⁎
P7 0.45⁎ 0.70⁎ 0.45⁎ 0.62⁎
P10 0.39⁎ 0.41⁎ 0.75⁎ 0.57⁎
P scale 0.87⁎ 0.92⁎ 0.86⁎
⁎ pb0.001.
Table 3
CCFI values for the three item indicators and full scale.
MAMBAC MAXEIG L-MODE
General population samples item indicators 0.297 0.134 0.277
Whole sample item indicators 0.591 0.201 0.357
General population sample full scale 0.171 0.081 0.187
Whole sample full scale 0.327 0.122 0.234
methodological rigor have generally yielded dimensional results. A strength of our study is the consideration of non-clinical and clinical samples. We acknowledged the risk of creating a pseudo-taxon when including the clinical participants but pursued this strategy anyway be-cause it was conservative with respect to supporting the continuum hy-pothesis (in the event, no taxon was detected).
Another difference between, on the one hand, this study and the studies ofFreeman et al. (2005)andBebbington et al. (2013), and, on the other hand, the schizotypy studies that have produced mixed re-sults, is the focus on a single symptom. There has been considerable de-bate about the extent to which schizophrenia/psychosis is a heterogeneous concept (Bentall, 2003). Although recent studies have converged on multidimensional structures that incorporate a positive symptom (hallucinations and delusions) syndrome (van Os and Kapur, 2009; Reininghaus et al., 2016) the existence of this syndrome does not guarantee that the component symptoms have common un-derlying causes (Borsboom and Cramer, 2013). An intriguing possibility is that psychotic symptoms have different latent structures. It would be interesting, for example, to examine the latent structure of hallucinations.
Some limitations of the present study should be noted. First, 90% of the population sample consisted of students, although their age range was close to that of the at-risk mental state group. Despite evidence of the internal consistency and convergent validity of the PaDS, we did not measure ideas of reference, which are a facet of paranoid thinking (Bebbington et al., 2013). Also, although previous comparisons found no significant differences (Wagner et al., 2014), we could not check for systematic differences between online and face-to-face completion of the questionnaire.
The study has clinical and research implications. Ourfindings sug-gest there may be shared psychological mechanisms in clinical and non-clinical paranoia and, therefore, that studies with high scoring non-patients may be informative about targets for intervention. It would be useful to carry out studies with other measures of paranoia while incorporating measures of psychological and neuropsychological functioning that have been hypothesized to play a role in paranoid ide-ation; for example, self-esteem, theory of mind and the jumping to con-clusions bias (Bentall et al., 2009). Given the evidence linking social adversity to psychosis, and that some of these effects may be symp-tom-specific (Bentall et al., 2014), research on how environmental and other risk factors influence where people tend to fall on the continuum may point the way towards preventative public health policies.
Contributors
The study was conceived by AE, FV and RPB. Statistical analysis and interpretation of the data was undertaken by all of the authors, who also all contributed to the drafting and revision of the manuscript. All authors have approved thefinal version of the manuscript.
Conflict of interest
All authors declare that they have no conflicts of interest.
Funding body agreements and policies
AE and JCM are supported by funding from the National Institute for Health Research Collaboration for Leadership in Applied Health Research and Care—North West Coast.
The views expressed are those of the authors and not necessarily those of the NHS, the NIHR or the Department of Health.
Acknowledgements
We are grateful for the support and assistance received from Drs Sophie Wickham, Kasia Sitko, Maria Haarmans and Alisa Udachina while compiling the datasets considered in this report.
References
Ahmed, A.O., Green, B.A., Buckley, P.F., McFarland, M.E., 2012.Taxometric analyses of paranoid and schizoid personality disorders. Psychiatry Res. 196 (1), 123–132. Ahmed, A.O., Green, B.A., Goodrum, N.M., Doane, N.J., Birgenheir, D., Buckley, P.F., 2013.
Does a latent class underlie schizotypal personality disorder? Implications for schizo-phrenia. J. Abnorm. Psychol. 122 (2), 475.
Bebbington, P.E., McBride, O., Steel, C., Kuipers, E., Radovanovič, M., Brugha, T., Jenkins, R., Meltzer, H.I., Freeman, D., 2013. The structure of paranoia in the general population. Br. J. Psychiatryhttp://dx.doi.org/10.1192/bjp.bp.112.119032.
Bentall, R.P., 2003.Madness Explained: Psychosis and Human Nature. Penguin Group, London.
Bentall, R.P., Rowse, G., Shryane, N., Kinderman, P., Howard, R., Blackwood, N., Moore, R., Corcoran, R., 2009.The cognitive and affective structure of paranoid delusions: a transdiagnostic investigation of patients with schizophrenia spectrum disorders and depression. Arch. Gen. Psychiatry 66, 236–247.
Bentall, R.P., de Sousa, P., Varese, F., Wickham, S., Sitko, K., Haarmans, M., Read, J., 2014. From adversity to psychosis: pathways and mechanisms from specific adversities to specific symptoms. Soc. Psychiatry Psychiatr. Epidemiol. 49 (7), 1011–1022. Borsboom, D., Cramer, A.O., 2013.Network analysis: an integrative approach to the
struc-ture of psychopathology. Annu. Rev. Clin. Psychol. 9, 91–121.
Claridge, G., 1987.‘The schizophrenias as nervous types’revisited. Br. J. Psychiatry 151 (6), 735–743.
Dunn, T.J., Baguley, T., Brunsden, V., 2014.From alpha to omega: a practical solution to the pervasive problem of internal consistency estimation. Br. J. Psychol. 105 (3), 399–412. Everett, K.V., Linscott, R.J., 2015.Dimensionality vs taxonicity of schizotypy: some new
data and challenges ahead. Schizophr. Bull. 41 (Suppl. 2), S465–S474.
Fenigstein, A., Vanable, P.A., 1992.Paranoia and self-consciousness. J. Pers. Soc. Psychol. 62, 129–134.
[image:5.595.39.549.55.231.2]Freeman, D., Garety, P.A., Bebbington, P.E., Smith, B., Rollinson, R., Fowler, D., Kuipers, E., Ray, K., Dunn, G., 2005.Psychological investigation of the structure of paranoia in a non-clinical population. Br. J. Psychiatry 186, 427–435.
Haslam, N., Holland, E., Kuppens, P., 2012.Categories versus dimensions in personality and psychopathology: a quantitative review of taxometric research. Psychol. Med. 42, 903–920.
Kay, S.R., Opler, L.A., 1987.The Positive and Negative Syndrome Scale (PANSS) for schizo-phrenia. Schizophr. Bull. 13, 507–518.
Lawrie, S.M., Hall, J., Owens, D.G.C., Johnstone, E.C., 2010.The‘continuum of psychosis’: scientifically unproven and clinically impractical. Br. J. Psychiatry 197, 423–425. Lenzenweger, M.F., 2010.Schizotypy and Schizophrenia. Guilford, New York. Linscott, R.J., Marie, D., Arnott, K.L., Clarke, B.L., 2006.Over-representation of Maori New
Zealanders among adolescents in a schizotypy taxon. Schizophr. Res. 84 (2), 289–296. Linscott, R.J., Allardyce, J., van Os, J., 2010.Seeking verisimilitude in a class: a systematic review of evidence that the criterial clinical symptoms of schizophrenia are taxonic. Schizophr. Bull. 36 (4), 811–829.
Meehl, P.E., 1995.Bootstraps taxometrics: solving the classification problem in psychopa-thology. Am. Psychol. 50 (4), 266.
Meehl, P.E., Yonce, L.J., 1994.Taxometric analysis: I. Detecting taxonicity with two quan-titative indicators using means above and below a sliding cut (MAMBAC procedure). Psychol. Rep. 74 (3), 1059–1274.
Melo, S., Corcoran, R., Bentall, R.P., 2009.The persecution and deservedness scale. Psychol. Psychother. 82, 247–260.
Morrison, A.P., French, P., Stewart, S.L.K., Birchwood, M., Fowler, D., Gumley, A.I., Jones, P.B., Bentall, R.P., Lewis, S.W., Murray, G.K., Patterson, P., Brunet, K., Conroy, J., Parker, S., Reilly, T., Byrne, R., Davies, L.M., Dunn, G., 2012.Early Detection and Inter-vention Evaluation for people at risk of psychosis (EDIE-2): a multisite randomised controlled trial of cognitive therapy for at risk mental states. Br. Med. J. 334, e2233. Morrison, A.P., Shryane, N., Beck, R., Heffernan, S., Law, H., McCusker, M., Bentall, R.P.,
2013.Psychosocial and neuropsychiatric predictors of subjective recovery from psy-chosis. Psychiatry Res. 208 (3), 203–209.
Morton, S.E., O'Hare, K.J., Maha, J.L., Nicolson, M.P., Machado, L., Topless, R., Merriman, T.R., Linscott, R.J., 2016. Testing the validity of taxonic schizotypy using genetic and envi-ronmental risk variables. Schizophr. Bull.http://dx.doi.org/10.1093/schbul/sbw108. van Os, J., Kapur, S., 2009. Schizophrenia. Lancet 374:635–645.http://dx.doi.org/10.1016/
S0140-6736(09)60995-8.
Pickering, L., Simpson, J., Bentall, R.P., 2008.Insecure attachment predicts proneness to paranoia but not hallucinations. Personal. Individ. Differ. 44 (5), 1212–1224. Poulton, R., Caspi, A., Moffitt, T.E., Cannon, M., Murray, R., Harrington, H., 2000.Children's
self-reported psychotic symptoms and adult schizophreniform disorder: a 15-year longitudinal study. Arch. Gen. Psychiatry 57 (11), 1053–1058.
Rawlings, D., Williams, B., Haslam, N., Claridge, G., 2008.Taxometric analysis supports a dimensional latent structure for schizotypy. Personal. Individ. Differ. 44 (8), 1640–1651.
Reininghaus, U., Böhnke, J.R., Hosang, G., Farmer, A., Burns, T., McGuffin, P., Bentall, R.P., 2016. Evaluation of the validity and utility of a transdiagnostic psychosis dimension encompassing schizophrenia and bipolar disorder. Br. J. Psychiatryhttp://dx.doi. org/10.1192/bjp.bp.115.167882.
Ruscio, J., 2016. Taxometric Programs for the R Computing Environment: User's Manual. Available at.http://ruscio.pages.tcnj.edu/quantitative-methods-program-code/. Ruscio, J., Haslam, N., Ruscio, A.M., 2006.Introduction to the Taxometric Method: a
Prac-tical Guide. Lawrence Erlbaum Associates, Mahwah, NJ.
Ruscio, J., Ruscio, A.M., Meron, M., 2007.Applying the bootstrap to taxometric analysis: generating empirical sampling distributions to help interpret results. Multivar. Behav. Res. 42 (2), 349–386.
Sellwood, W., Morrison, A.P., Beck, R., Heffernan, S., Law, H., Bentall, R.P., 2013.Subjective cognitive complaints in schizophrenia: relation to antipsychotic medication dose, ac-tual cognitive performance, insight and symptoms. PLoS One 8 (12) (p.e83774). Udachina, A., Thewissen, V., Myin-Germeys, I., Fitzpatrick, S., O'kane, A., Bentall, R.P., 2009.
Understanding the relationships between self-esteem, experiential avoidance, and paranoia: structural equation modelling and experience sampling studies. J. Nerv. Ment. Dis. 197 (9), 661–668.
Udachina, A., Varese, F., Myin-Germeys, I., Bentall, R.P., 2014.The role of experiential avoidance in paranoid delusions: an experience sampling study. Br. J. Clin. Psychol. 53 (4), 422–432.
Varese, F., Barkus, E., Bentall, R.P., 2011.Dissociative and metacognitive factors in halluci-nation-proneness when controlling for comorbid symptoms. Cogn. Neuropsychiatry 16 (3), 193–217.
Varese, F., Barkus, E., Bentall, R.P., 2012.Dissociation mediates the relationship between childhood trauma and hallucination-proneness. Psychol. Med. 42, 1025–1036. Wagner, B., Horn, A.B., Maercker, A., 2014.Internet-based versus face-to-face
cognitive-behavioral intervention for depression: a randomized controlled non-inferiority trial. J. Affect. Disord. 152, 113–121.
Waller, N.G., Meehl, P.E., 1998.Multivariate Taxometric Procedures: Distinguishing Types From Continua. Sage Publications Inc.
Walters, G.D., Ruscio, J., 2009.Where do we draw the line? Assigning cases to subsamples for MAMBAC, MAXCOV, and MAXEIG taxometric analyses. Assessment 17 (3), 321–333.
Wickham, S., Sitko, K., Bentall, R.P., 2015.Insecure attachment is associated with paranoia but not hallucinations in psychotic patients: the mediating role of negative self-es-teem. Psychol. Med. 45 (07), 1495–1507.