White Rose Research Online URL for this paper:
http://eprints.whiterose.ac.uk/109527/
Version: Accepted Version
Article:
De Cat, C orcid.org/0000-0003-0044-0527, Gusnanto, A and Serratrice, L (2018)
Identifying a threshold for the executive function advantage in bilingual children. Studies in
Second Language Acquisition, 40 (1). pp. 119-151. ISSN 0272-2631
https://doi.org/10.1017/S0272263116000486
© 2017, Cambridge University Press. This article has been published in a revised form in
Studies in Second Language Acquisition https://doi.org/10.1017/S0272263116000486.
This version is free to view and download for private research and study only. Not for
re-distribution, re-sale or use in derivative works. Uploaded in accordance with the
publisher's self-archiving policy.
[email protected] https://eprints.whiterose.ac.uk/ Reuse
Items deposited in White Rose Research Online are protected by copyright, with all rights reserved unless indicated otherwise. They may be downloaded and/or printed for private study, or other acts as permitted by national copyright laws. The publisher or other rights holders may allow further reproduction and re-use of the full text version. This is indicated by the licence information on the White Rose Research Online record for the item.
Takedown
If you consider content in White Rose Research Online to be in breach of UK law, please notify us by
Cecile De Cat
Linguistics & Phonetics, University of Leeds
Arief Gusnanto
Statistics, University of Leeds
Ludovica Serratrice
Psychology and Clinical Language Sciences, University of Reading
Abstract
The literature exploring the executive function correlates of bilingualism is vast, but to date, few studies have concentrated on children, for whom the bilingual advantage appears even more inconsistent than for adults. We investigate a highly heterogeneous group of children (in terms of bilingual experience and socio-economic status) and identify the critical threshold of bilingual experience from which an advantage can be observed at group level. The modeling methods adopted allow the use of fine-grained, continu-ous factors for age and socio-economic status, thereby effectively controlling for their effect and isolating the specific effect of bilingual experience. We pi-oneer the use of Cox Proportional Hazard regression to analyze performance in the Simon task. This allows the modeling ofalldata points without trans-formation nor outlier removal, and captures both accuracy and reaction time within the same analysis, while also being able to handle multiple predictor variables.
Introduction
In the past fifteen years, the amount of research investigating the cognitive correlates of bilingualism has increased exponentially. Much research has focused on the effect of bilingualism on domain-general cognitive skills, and in particular executive functions — see for instance two recent keynote articles by Baum and Titone (2014) and Valian (2015).
Miyake and colleagues’ seminal work (Friedman et al., 2006; Miyake et al., 2000) originally divided executive functions into three separable components: the updating and monitoring of working memory representations, the shifting between tasks and mental sets, and the inhibition of unwanted responses. These three components are dissociable (featur-ing unique variance) but inter-related (featur(featur-ing common variance) (Miyake et al., 2000). This means that in practice, it is impossible to test one component to the complete exclu-sion of others. This tripartite view has now been superseded by a revised model in which two specific components are distinguished (i.e. updating and shifting, as defined above), in addition to a third component that is common to both of them, defined as the “ability to actively maintain task goals and goal-related information and use this information to effectively bias lower-level processing” (Miyake & Friedman, 2012, 12). Valian (2015) pro-poses to interpret this common factor variable asinhibition. We will adopt this label in the remainder of the paper.
Executive function (henceforth EF) development has been shown to span several important stages of maturation from early childhood (Garon, Bryson, & Smith, 2008) to adolescence (Brocki & Bohlin, 2004). In adults, EF has been shown to decline with age (Bryan & Luszcz, 2000; Buckner, 2004).
A growing body of evidence suggests that bilingual experience confers an EF advan-tage. Specifically, the constant need to control one language while using the other (Kroll, Dussias, Bogulski, & Valdes Kroff, 2012) is claimed to exercise the neurological mechanisms underlying attention control, which results in the enhancement of bilinguals’ abilities in that domain (see e.g. Bialystok, 1999). Abutalebi et al. (2011) show that early bilinguals use fewer brain resources for conflict monitoring, causing changes in brain structure in a region used for language control and for the resolution of non-verbal conflict (see Abutalebi & Rietbergen, 2014 for a review). Bilingual experience has been argued to enhance struc-tural connectivity, thereby contributing to the constitution of a cognitive reserve protective against decline in old age (Luk, Bialystok, Craik, & Grady, 2011).
However, the bilingual literature features a discrepancy between studies that found an executive function advantage for bilinguals and those that have not, using seemingly comparable methodologies. This contribution focuses specifically on children, for whom the bilingual advantage appears even more difficult to pin down than for adults (see Valian, 2015 for a review). It explores alternative analytical methods that allow disentangling the effect of bilingual experience from other factors influencing executive function (“thinking multifactorially from the outset” — Titone, Pivneva, Sheikh, Webb, & Whitford, 2015, 44), using a gradient, composite measure of bilingual experience.
advantage was not found by Engel De Abreu (2011) in a study comparable to that of Morales et al. (2013), involving 5- to 6-year-old children of similar SES and using similar (visuo-spatial) tasks.
Shifting concerns the ability to shift between mental sets or tasks (Miyake et al., 2000). It is typically investigated with card sorting tasks, in which the sorting has to be done according to different dimensions (e.g., shape and color) and the relevant dimension changes across trials, with dimensional change patterns varying across blocks of trials (i.e., single-task vs. mixed-single-task blocks). Timed implementations of such single-task-switching paradigms allow the evaluation of switching costs and mixing costs. Switching costs correspond to longer reaction times in switching trials compared with repetition trials in the mixed-tasks blocks (Monsell, 2003). Mixing costs correspond to longer reaction times in repetition trials in the mixed-task blocks compared with trials in the single-task blocks (Los, 1996). Switching costs are assumed to reflect transient control mechanisms, whereas mixing costs are assumed to reflect global sustained control mechanisms. Bilingual children have been shown to perform significantly better than monolingual controls in the Dimension Change Card Sort task (described in detail below). The advantage was observed in highly bilingual 3- to 6-year-olds, controlling for vocabulary and working memory (Bialystok, 1999; Bialystok & Martin, 2004), and in highly bilingual 5- to 7-year-olds (Carlson & Meltzoff, 2008), controlling for vocabulary, and in spite of lower socio-economic status of the bilingual group. By contrast to these positive findings, Mueller Gathercole et al. (2014) did not find a consistent bilingual advantage in their large-scale study involving 650 participants from 7 age groups who “grew up in the same context” (p.3) in North Wales. Participants were classified according to language dominance, which was determined on the basis of the patterns of language use in their home (Only Welsh Homes; Welsh and English Homes; English Only Homes). Card sorting tasks of age-adapted complexity level did not reveal an overall bilingual advantage in terms of accuracy or reaction time. An analysis based on difference scores only revealed a possible bilingual advantage in the teen group from Only Welsh Homes compared with their peers. In terms of absolute scores, the same group showed inferior accuracy compared with their peers, but faster reaction times.
will show an advantage in the incongruent condition only. The so-called Simon effect is the difference in response speed between the incongruent condition and the congruent condition. Bilinguals are expected to experience a smaller Simon effect than monolinguals as they are better at controlling the conflicting information.
The Simon effect has hardly ever been reported in children. An exception is Poarch and van Hell (2012), who found a significant Simon effect in trilingual 5- to 7-year-olds, and a marginally significant Simon effect in bilingual 5- to 7-year-olds, but not in the mono-lingual controls. A number of studies in which no Simon effect was observed nonetheless report a bilingual advantage in terms of reduced reaction times in both congruent and in-congruent conditions, so long as the task was sufficiently demanding and included response competition. This global RT advantage has been found in five-year-olds (Bialystok, Martin, & Viswanathan, 2005; Martin-Rhee & Bialystok, 2008). A similar global RT advantage was also observed in the flanker task in 8-year-old bilinguals (Engel de Abreu, Cruz-Santos, Tourinho, Martin, & Bialystok, 2012) and in 4-year-old bilinguals compared with three monolingual control groups based on culture (i.e. imposing self-regulation of behavior or not) (Yang, Yang, & Lust, 2011).
By contrast to the positive results reported above, Morton and Harper (2007) found no bilingual advantage in the Simon task in a group of 6- to 7-year-olds. They attribute this lack of difference to the control for socio-economic status. In a design that carefully controlled for age, non-verbal IQ, SES (indexed by maternal education), receptive vocabulary, receptive morphosyntax, and short-term memory, Namazi and Thordardottir (2010) also found no bilingual advantage in the Simon task in terms of accuracy or speed. Instead, both were predicted by the children’s working memory scores on a pattern recall task. A number of large-scale studies using a variety of tasks probing inhibitory control did not find a bilingual advantage either (e.g. Duñabeitia et al., 2015; Antón et al., 2014 — see Paap, 2014 for an in-depth review).
It has been claimed that the bilingual advantage in inhibitory control is particularly elusive in young children (Hilchey & Klein, 2011). In their meta-analysis of 39 studies, Donnelly, Brooks, and Homer (2015) ascertained the existence of a moderate but statistically significant bilingual advantage overall on global reaction time and interference costs from conflict resolution tasks. However, different effects emerged at different ages, and in children, larger effect sizes for global reaction times were observed, compared with interference costs. In the 34 studies they review, Paap, Johnson, and Sawi (2014) observe that the bilingual advantage tends to be found in studies with small sample sizes and argue that the lack of a significant effect in large-sample studies coupled with significant effects in small-sample studies is worrisome (as it is unexpected given the properties of null hypothesis statistical testing). Donnelly et al. (2015) also reveal a significant lab effect across studies, which they speculate could be due to socio-linguistic differences of subject pools or different data-preparation methods such as outlier removal.
by differences in how possible confounds are taken into account (Paap & Sawi, 2014). Socio-economic status (SES) might have acted as a confound in some studies (as sug-gested by Hilchey & Klein, 2011). Socially advantaged 4- to 7-year-old children have been shown to perform faster than their age-matched peers in terms of accuracy and speed in a flanker task (Mezzacappa, 2004), and parental level of education has been shown to pre-dict children’s development of executive functions (Ardila, Rosselli, Matute, & Guajardo, 2005; Merz et al., 2015). A number of studies controlling for SES indeed found no bilin-gual advantage (e.g. Morton & Harper, 2007; Paap & Greenberg, 2013; Duñabeitia et al., 2015). However, evidence also exists of a bilingual advantage in socio-economically deprived children (Engel de Abreu et al., 2012; Calvo & Bialystok, 2014).
Differences between children and adults are to be expected, given the protracted development of executive functions. Important stages of executive function maturation have been identified in the preschool years (Hongwanishkul, Happaney, Lee, & Zelazo, 2005) and between the ages of 6 and 13 (Brocki & Bohlin, 2004). For instance, this might contribute to explaining the paucity of evidence for the Simon effect in children but not in older adults (e.g., Bialystok et al., 2005).
Various types of experience that are not usually controlled for in experiments probing executive function performance also have a significant effect. Acute physical activity, for instance, has been shown to affect executive function performance positively in 6- to 10-year-olds (Best, 2012). Musical training (Moreno et al., 2011) and physical exercise (Diamond & Lee, 2011) have also been shown to have a positive effect. Psycho-emotional factors such as lack of sleep, stress and loneliness also impact executive function performance, in this case negatively (Diamond, 2011).
Most importantly, the level of bilingualism of the populations tested is not reported consistently across studies. This is partly due to the lack of a general consensus as to how bilingual experience should be measured (see e.g. Bedore et al., 2012 on assessing language dominance). Several aspects known to vary in bilingual experience have been argued to have an effect on executive function performance, such as proficiency (Gutiérrez-Clellen, Calderón, & Ellis Weismer, 2004; Iluz-Cohen & Armon-Lotem, 2013; Rosselli, Ardila, Lal-wani, & Vélez-Uribe, 2015), language dominance (Mueller Gathercole et al., 2014; Weber, Johnson, Riccio, & Liew, 2015), language exposure (Brito, Sebastián-Gallés, & Barr, 2015), and patterns of language switching (de Bruin et al., 2015; Verreyt, Woumans, Vandelanotte, Szmalec, & Duyck, 2015; Scaltritti, Peressotti, & Miozzo, 2015; Soveri, Rodriguez-Fornells, & Laine, 2011). A number of researchers are now calling for the integration of the variability of bilingual experience in the analyses (e.g. Kaushanskaya & Prior, 2015), to account for the whole spectrum of language experience, from monolingualism to the highest levels of bilingualism (Luk, 2015). Our study takes up this challenge.
Aims of the present study
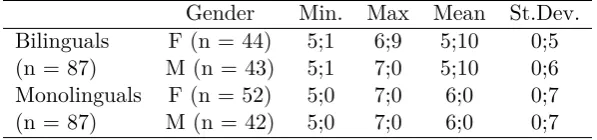
Gender Min. Max Mean St.Dev. Bilinguals F (n = 44) 5;1 6;9 5;10 0;5 (n = 87) M (n = 43) 5;1 7;0 5;10 0;6 Monolinguals F (n = 52) 5;0 7;0 6;0 0;7 (n = 87) M (n = 42) 5;0 7;0 6;0 0;7 Table 1
Distribution in gender and age (in years;months)
status, proficiency in English, short-term memory, working memory, and gender); this was achieved by incorporating them into the analysis. In an attempt to achieve maximum comparability with other studies, we relied on widely-used tasks.
A key aim is to explore and exploit new methods of analysis to better achieve the objectives listed above. On the one hand, we exploit linear regression to model the additive effect of all the predictors, thereby isolating the specific effect of bilingual experience (or “adjusting” its effect in light of other significant factors). On the other hand, we exploit the Cox Proportional Hazard model to capture accuracy and speed within a single analysis of performance in the Simon task, while exploring the additive effect of all predictors. Two additional advantages of the Cox PH model are (i) that it does not require the exclusion of any observation, and (ii) that it is able to take into account the auto-correlation between trials.
The use of modeling techniques and the operationalization of bilingualism as a con-tinuum allow us to identify the threshold from which the performance of bilingual children differs from that of monolingual children. In that way, we aim to contribute to bridging the gap between studies identifying a bilingual advantages and studies reporting null results, thereby starting to answer the question as to how bilingual one needs to be to benefit from a cognitive advantage.
Methods
Participants
We recruited 174 children attending year 1 or 2 of primary school in the North of England, including 87 monolinguals and 87 children with some amount of exposure to a home language other than English. For convenience, we will refer to these groups as the “monolinguals” and the “bilinguals” respectively — even though the language experience of children at the lower end of the bilingualism spectrum is hardly distinguishable from that of monolinguals. Forty one children were sequential bilinguals.1
Table 1 summarizes the distribution of the two groups in gender and age. All children were developing typically and did not have any known hearing deficit.
The language of schooling was English for all the children. The bilingual children were also exposed to another language (henceforth the home language) in varying degrees (see below). There was a total of 28 home languages in our sample:2
Arabic (9%), Bengali, 1
There is a significant correlation between age of initial bilingual exposure and BPI score (see De Cat and Serratrice (to appear) for a model of how the BPI relates with various estimates of bilingual experience).
2
Secondary school Further education University
High 0 13 61
Mid 14 16 8
Low 23 30 7
Table 2
SES measures (reduced to 3 levels): education by occupation. Correspondence with NS-SEC categories listed in Table 14: High<7, Low≥10.
Cantonese, Catalan, Dutch, Farsi, French (8%), Greek, Hindi, Italian, Kurdish, Mandarin, Marathi, Mirpuri, Nepalese, Pashto, Polish, Portuguese, Punjabi (21%), Shona, Somalian, Spanish (6%), Swedish, Tamil, Telugu, Thai, Tigrinya, and Urdu (17%).
Socio-economic profiles
The socio-economic status of the children’s families was estimated on the basis of information gathered via a parental questionnaire. Two measures were obtained: one for parental level of education (1), one for parental level of current occupation. The highest level was chosen in each case (on the assumption that the status of the household was determined by the best educated parent and the highest occupation among the parents). (1) a. None
b. Primary school c. Secondary school d. Further education e. University
The occupational data were scored using the reduced method of the National Statistics Socio-economic Classification (simplified NS-SEC — see Table 14 in the Appendix), which is based on the Goldthorpe Scheme of sociological classification. For each family, the highest current occupation was selected, as recommended by the NS-SEC guidelines, and entered into a 48-point ranking scale. The score obtained was reversed for ease of interpretability (being positively correlated with educational level).
The proxy measures for socio-economic status are strongly and significantly associ-ated, as shown in Table 2 (χ2(4, N = 174) = 83.57, p <0.0001). We subsequently used the simplified NS-SES measures in all our analyses as it afforded the possibility of capturing SES as a continuous variable (based on the 48-point scale).
Quantifying bilingual experience
To quantify bilingual experience as a continuum, we used the Bilingualism Profile Index (De Cat & Serratrice, to appear). The BPI encapsulates children’s cumulative ex-posure to an “additional” language (to the language of schooling) as well as their active (cumulative) use of that language.3
Because English is the language of schooling, we as-sumed it was (or had become) a language actively used by all children. Greater variability
3
was therefore expected in the exposure to and use of the home language (which, for many children, would be the weaker language). The BPI intends to apprehend that variability of bilingual experience, and can be interpreted as a gradient measure of language dominance (De Cat & Serratrice, to appear).
The BPI is a composite score of cumulative input and cumulative output in the home language, derived by a standard measure of dimensionality reduction, i.e. Principal Component Analysis. The PCA of cumulative input and cumulative output yields two principal components, the first of which captures most of the variability (given the strength of the correlation between the two cumulative measures). In our data, the first component captured 98% of the variability, so it can be interpreted as a reliable measure combining the two cumulative (input and output) meaures. The BPI scores correspond to the loadings of that first component.4
It can be interpreted as a measure of the child’s experience of their home language (with a score of 0 indicating monolingualism).
Figure 1 shows the correlation of the BPI with current and cumulative measures of input and output in the home language. The amount of dispersion from the linear relationship between the BPI and each of the cumulative measures shows that it is not reducible to either of these measures. The BPI is also very strongly correlated with the age of onset of exposure to an additional language (r =.85, p <0.0001). This correlation is much stronger than that between current input and onset of exposure to an additional language (r=.51, p <0.0001).
In De Cat and Serratrice (to appear) we provide independent validation for the BPI by predicting the BPI scores (via linear regression) from factors not used to derive the BPI but standardly assumed to predict levels of bilingualism, such as home environment (e.g. one-parent one-language), bilingualism onset and length of exposure. We also demonstrate that, although based on estimates of experience in the home language, the BPI predicts proficiency in the language of schooling (English).
In summary, our sample ranges across an evenly distributed continuum of bilingual language experience, as indexed by the BPI score. At the lower end, some children had a very limited experience in a language other than English. At the higher end, some children were late bilinguals, having only experienced the home language until their first significant exposure to English at primary school. Current exposure to a language other than English ranges from 9% to 89% in our sample.
A weak but significant negative correlation was observed between the level of bilin-gualism and socio-economic status (based on the occupational classification): r=−.25, p= 0.0009.
Proficiency
The executive function tasks used in this study did not rely on language production from the participants (except for the use of numbers in the memory tasks), but the instruc-tions were given in English. It is therefore possible that children’s proficiency in English could have an impact. For that reason, we assessed their global proficiency with a sentence
4
● ● ● ● ● ● ● ● ● ● ● ● ●● ● ● ● ● ● ● ● ● ● ● ● ● ● ● ● ● ● ● ● ●●● ● ● ● ● ● ● ● ● ● ● ● ● ●●● ● ● ● ● ● ● ● ● ● ● ● ● ● ● ● ● ●● ● ● ● ● ● ● ● ● ● ● ● ● ● ● ● ● ● ●
0 10 20 30 40 50 60 70
0 20 40 60 80 100
Cumulative Input (months equivalent)
BPI ● ● ● ● ● ● ● ● ● ●● ● ●● ● ● ● ● ● ● ● ● ● ● ● ● ● ● ● ● ● ● ● ● ● ● ● ● ● ● ● ● ● ● ● ● ● ● ● ● ● ● ● ● ● ● ● ● ● ● ● ● ● ● ● ● ● ●● ● ● ● ● ● ● ● ●● ● ● ● ● ● ● ● ● ●
0 10 20 30 40 50 60 70
0 20 40 60 80 100
Cumulative Output(months equivalent)
BPI ● ● ● ● ● ● ● ● ● ● ● ● ●● ● ● ● ● ● ● ● ● ● ● ● ● ● ● ● ● ● ● ● ●●● ● ● ● ● ● ● ● ● ● ● ● ● ●●●● ● ● ● ● ● ● ● ● ● ● ● ● ● ● ● ● ● ● ● ● ● ● ● ● ● ● ● ● ● ● ● ● ● ● ●
0.0 0.2 0.4 0.6 0.8 1.0
0 20 40 60 80 100
Current Input (%)
BPI ● ● ● ● ● ● ● ● ● ● ● ● ●● ● ● ● ● ● ● ● ● ● ● ● ● ● ● ● ● ● ● ● ● ● ● ● ● ● ● ● ● ● ● ● ● ● ● ● ● ● ● ● ● ● ● ● ● ● ● ● ● ● ● ● ● ● ● ● ● ● ● ● ● ● ● ● ● ● ●● ● ● ● ● ● ●
0.0 0.2 0.4 0.6 0.8 1.0
0 20 40 60 80 100
Current Output (%)
[image:10.595.86.511.111.474.2]BPI
Figure 1. The Bilingual Profile Index and its relationship with input and output measures in the home language
repetition task (the short version of the School-Age Sentence Imitation Test — Marinis, Chiat, Armon-Lotem, Gibbons, & Gipps, 2010), which was originally designed to identify children at risk of Specific Language Impairment in bilingual populations.5
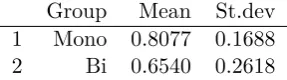
The distribution of scores is shown in Table 3. See De Cat and Serratrice (to appear) for analysis of this and other proficiency tests in the present sample of participants.
Measures of executive function abilities
Updating. Measures of short-term and working memory were obtained from the Digit Span tasks (Wechsler Intelligence Scale for Children III, Wechsler, 1991). The use of numerical memoranda has been shown to be relatively independent of test language and cultural status (Engel de Abreu, Baldassi, Puglisi, & Befi-Lopes, 2013). In those tasks, the
5
Group Mean St.dev 1 Mono 0.8077 0.1688 2 Bi 0.6540 0.2618 Table 3
Distribution of scores in the sentence repetition task, by group
examiner verbally presents digits that the child has to repeat in the same order (in the Forward Digit Recall task) or in reversed order (in the Backward Digit Recall task). The number of digits increases by one until the child consecutively fails two trials of the same digit span length. There were four trials per digit span.
The Forward Digit Span measure was used as a proxy for children’s episodic buffer capacity (i.e. short term memory). The Backward Digit Span measure was used as a proxy for children’s updating abilities (i.e. working memory).
Shifting. To assess children’s flexible use of rules to govern behavior, we admin-istered the Dimensional Change Card Sort task. The protocol was as described in Zelazo (2006). The child was presented in each trial with a picture representing either a rabbit or a boat, that was either blue or red, and asked to place the card in one of two boxes according to a sorting rule (by shape or by color). The boxes were identified by either a blue rabbit or a red boat. The first block trials (N= 6) required using the shape criterion, and the second block (N= 6) required using the color criterion. As the children in our sample were older than 5, we also administered a more advanced block of trials (N= 12) in which a star appeared on some of the cards. Cards without a star had to be sorted according to the shape dimension, and cards with a star had to be sorted according to the color dimension. The repetition of instructions on every trial (in all blocks) ruled out the possibility that difficulty could be attributed to hypothesis testing or memory of the relevant rules. The test session was preceded by a demonstration and two practice trials. The test trials were presented in two counterbalanced orders.
Inhibition. Inhibition was assessed with computer-based version of the Simon task (Simon, 1969), programmed and run via E-Prime software. This task manipulates the compatibility of stimulus and response according to two dimensions: color and position. In order to perform accurately on critical trials, participants have to inhibit the prepotent association of to irrelevant position information and focus on color information exclusively. Children were sat in front of a computer (Toshiba Satellite L-855 laptop with a 15.6” screen) with an E-prime serial response button box featuring a green button and a red button.6
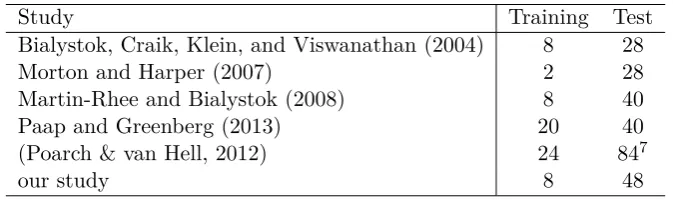
They were asked to press the button whose color matched that of a square as fast as possible after it appeared on the screen. In the matching condition, the color of the square was aligned with the position of the button (i.e. left for red, right for green). In the mismatching condition, the square was aligned with the button with the wrong color. Children were asked to respond as fast as possible, and their reaction time was recorded. There was no neutral condition (in which the colored square would appear centrally). Children started with an 8-trial practice session, immediately followed by 48 test trials. Comparison with other protocols is summarized in Table 4.
6
Study Training Test Bialystok, Craik, Klein, and Viswanathan (2004) 8 28
Morton and Harper (2007) 2 28
Martin-Rhee and Bialystok (2008) 8 40
Paap and Greenberg (2013) 20 40
(Poarch & van Hell, 2012) 24 847
[image:12.595.138.475.92.192.2]our study 8 48
Table 4
Number of critical trials in the Simon task: cross-study comparison
Analysis
For the results of the working memory task and the switching task (DCCS), we fitted linear models using packages lme4 (version 1.1.11) and ordinal (2015.6.28) in R (3.2.4).
The models were built by adding factors incrementally; factors were retained only if they improved the fit of the model, yielding a significant reduction in AIC8
and a significant R-squared value for the model. This allowed the data to determine which variables and which interactions were justified in the model, through systematic testing. The same procedure of incremental model building was adopted in the Cox Proportional Hazard analysis of the Simon task results (which is explained in detail in the relevant section below). All model summary tables report the statistics for the optimal model. Statistics for each non-significant variable or interaction of interest were computed by adding it back to the optimal model. These are reported in the text only.
The following variables were tested for inclusion in all models:9
BPI, SES (occu-pational score), Short Term Memory (forward digit recall score), Proficiency (Sentence Repetition score),Age(in months),Gender, as well as interactions between these variables. Additional, task-specific predictors were also considered, as explained in the relevant sec-tions below. Agewas centered in all analyses to make the value at the intercept interpretable (i.e. not zero months but the average age) and mitigate its correlation with other variables.
Results
Updating
Three (bilingual) children failed the working memory test: they did not manage to reverse even two digits. One of them also failed the DCCS test. The three children were excluded from the analysis of the memory measures. The raw results prior to this exclusion are summarized in Tables 5 and 6.
To account for the fact that memory increases with age, we divided the forward digit span score and the backward digit span score by age (in months).10
This turned them into 7
In addition to these critical trials, there were 42 items in a neutral condition, in which the colored square was presented centrally.
8
The Akaike Information Criterion is a measure of fit that penalizes a model for including an excessive number of variables.
9
Variable names will be italicised for clarity.
10
Digits 3 4 5 6 7 Children (N) 22 68 72 10 2 Table 5
Forward Digit Recall (digits correctly recalled)
Digits 0 2 3 4
Children (N) 3 66 98 7 Table 6
Backward Digit Recall (digits correctly reversed)
continuous measures capturing STMand WM regardless of Age (assuming that increment inSTMandWMis linear withAge). These new measures were used as dependent variables in the linear regression analyses reported below.
As shown in the optimal model reported in Table 7, the only significant predictor of the working memory score was STM(t(181) = 54.15, p <0.0001). Neither BPI (t(181) =
−0.29, p= 0.77) nor SES (t(181) = −0.40, p= 0.69) reached significance, and there were no significant interactions. The model accounted for 94% of the variance (R2
= 0.94). As the strongest predictor of working memory, the short-term memory (STM) per-formance is interesting to model in its own right. It was found to be predicted by socio-economic status (t(181) = 2.94, p= 0.004) and gender, with boys performing less well than girls (t(181) = −2.18, p= 0.03), as shown in Table 8. BPI was not a significant predictor (t(181) = 0.80, p= 0.42). The model accounted for 6% of the variance (R2 = 0.06).
Shifting
We adopted the method recommended by Zelazo (2006) to analyze the DCCS data. It assigns a score between 0 and 3 based on a pass-fail criterion on each trial block. Passing the first two blocks requires sorting at least 5 out of 6 cards correctly (on each block). Passing the third block requires sorting at least 9 out of 12 cards correctly. A child is assigned a score of 0 if they fail the pre-switch block, a score of 1 if they pass the pre-switch block only, a score of 2 if they also pass the post-switch block, and a score of 3 if they pass all three blocks.
Little variability is observed, as shown in Table 9, as many children performed at ceiling. Only one (bilingual) child did not pass the first block, and was excluded from analysis (as he was not able to perform the task).
carefully includeSTMas predictor in the WM model, making it possible to interpret parameter estimates independently. See the Supplementary Online Material for a more detailed explanation.
Coefficient Std.Error t-value p
Intercept -0.0440 0.1150 -0.3823 0.7027
Forward Digit Recall / Age (months) 0.5315 0.0098 54.1544 0.0000 Table 7
Coefficient Std.Error t-value p Intercept 0.0698 0.0021 32.6650 0.0000 SES (occupation) 0.0007 0.0002 2.9444 0.0037 Gender -0.0037 0.0017 -2.1794 0.0307 Table 8
Coefficients of the optimal linear regression model fitted to the Forward Digit Recall scores divided by Age
DCCS score 0 1 2 3
Participants 1% (N=1) 8% (N=14) 37% (N=65) 54% (N=94) Table 9
Distribution of overall DCCS scores (based on block pass-fail)
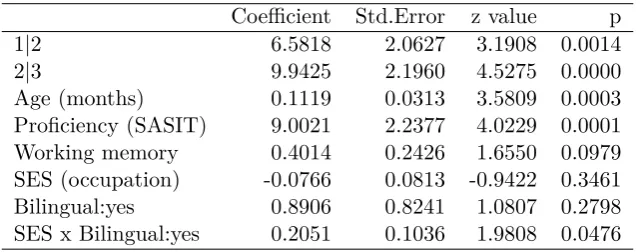
We fitted an ordinal Cumulative Link Model to the DCCS overall 0-3 score (to capture the order of the dependent variable’s levels). The optimal model is summarized in Table 10. Performance in the DCCS was predicted by (i) the child’s socio-economic status in bilingual children only (Z = 1.98, p < 0.05), (ii) the age of the child (Z = 3.58, p <0.001), (iii) the child’s proficiency in English (Z = 4.02, p <0.001). Working memory approached significance (Z = 1.65, p = 0.10). BPI did not reach significance (Z = 0.38, p = 0.70).11
Importantly, in spite of a significant correlation between BPI and Proficiency score (r =
−.49, p < 0.001), BPI does not turn out as a significant predictor even in the absence of
Proficiency, or in interaction with it.
Coefficient Std.Error z value p
1|2 6.5818 2.0627 3.1908 0.0014
2|3 9.9425 2.1960 4.5275 0.0000
Age (months) 0.1119 0.0313 3.5809 0.0003 Proficiency (SASIT) 9.0021 2.2377 4.0229 0.0001 Working memory 0.4014 0.2426 1.6550 0.0979 SES (occupation) -0.0766 0.0813 -0.9422 0.3461 Bilingual:yes 0.8906 0.8241 1.0807 0.2798 SES x Bilingual:yes 0.2051 0.1036 1.9808 0.0476 Table 10
Coefficients of an ordinal Cumulative Link Model fitted to the DCCS overall score. Reference level: Bilingual=no.
Inhibition
As expected, incongruent trials in the Simon task resulted in lower accuracy in average (as shown in Table 11), and slower reaction time (shown in Table 12 for accurate responses only).
11
[image:14.595.150.465.410.536.2]Condition Accuracy Accuracy mean st.dev congruent 0.9638 0.1868 incongruent 0.8998 0.3004 Table 11
Accuracy of responses in the Simon task
Condition RT RT
mean st.dev congruent 1116.9572 772.4815 incongruent 1214.2377 624.8028 Table 12
Speed of accurate responses in the Simon task
Issues with traditional analyses. Reaction time data is known to feature a pos-itively skewed distribution, as the scale is bounded on the left (i.e. one cannot respond faster than x number of milliseconds) but not to the right (i.e. response can be delayed for a variety of reasons). Performance in the Simon Task is usually analyzed by comparing mean reaction times across conditions (congruent vs. incongruent) and across groups (e.g. bilin-gual vs. monolinbilin-gual) — as done in all the relevant studies cited above. This assumes that the data is normally distributed (which it isn’t, as explained above). The traditional solu-tion is to remove observasolu-tions further than 2 standard deviasolu-tions from the mean (for each participant).
In addition to this, auto-correlation between trials is usually not taken into account by traditional analyses. On the one hand, self-monitoring is likely to have an effect, whereby the participant might slow down after noticing they had answered incorrectly on a particular trial. On the other hand, the trials form part of a time series, and there might be an effect of e.g. habituation or tiredness. Removing the trial immediately following an erroneous response (as done by e.g. Poarch & van Hell, 2012) results in further loss of data, and does not take into account the time-series effect.
Finally, and most importantly, traditional approaches cannot apprehend accuracy and response time within the same analysis. Any trial eliciting an incorrect response is removed from the reaction time analysis. If a group is less accurate, the number of data points in the reaction time analysis will be reduced, but the analysis cannot take this disparity into account. In addition to this, the information carried by the incorrect trials is lost.
The combination of these three issues results in the removal of informative data, which means that the estimates of the model parameters are heavily biased and cannot really estimate the truth. This jeopardizes the interpretation of the parameter estimates.12
A solution: Cox Proportional Hazard Model. To address these concerns, we propose the use of a Cox Proportional Hazard (PH) Model to analyze children’s responses to the Simon Task. We start by describing how this type of model allows us to account for
12
[image:15.595.216.400.189.245.2]the difference between efficient and less efficient inhibitors before explaining the technique in detail.
Imagine a “good” inhibitor takes x amount of time to answer correctly on a particular trial in the incongruent condition. A “bad” inhibitor is expected to either take longer to answer correctly, or possibly the same amount of time (or shorter) but with a likely incorrect response. It is most unlikely that the bad inhibitor would be able to respond correctly in that trial in a shorter amount of time than the good inhibitor.13
The Cox PH model enables us to capture this by including the time to an incorrect response as acensoredobservation (as explained below). Censored observations are interpreted as the minimum amount of time it would have taken to produce a correct response in that trial (even though we do not know how long it would actually have taken). In that way, all responses are included in the analysis (i.e., both the time taken to answer correctly, and the time taken to answer incorrectly), while being interpreted differently.
The Cox PH technique (also known as Cox regression in the context of survival analysis) is commonly employed to model time-to-event data (Armitage, Berry, & Matthews, 2008; Collett, 2015). In the case of the Simon Task, the ‘event’ is defined as ‘correctresponse to a trial’ (as opposed to an incorrect response). This definition has two consequences for how the data is treated. First, the time span from stimulus presentation to correct registered response is treated as an uncensored observation, in the sense that the time to end-point (i.e. correct response) is known/observed. Second, when the children gave a wrong response, the time leading to it is treated as censored, as the end point (i.e. correct response) is not observed. Censored observations are taken into account in the model as they carry valuable information: they indicate that the amount of time to a correct response would have taken
at least as long as that of the censored observation. Ignoring that information would result in biased estimates. The Cox PH model takes into account the censored times because it does not model the response time directly, but rather the hazard rate, which is defined as the probability (known as the ‘(instantaneous) hazard’) of responding correctly at any particular time, given the covariates or predictors. The hazard rate is modeled as a function of baseline hazard and covariates as predictors. The baseline hazard can be interpreted as a ‘typical’ rate of correct response over time (independent of the predictors). The effect of covariates is to modify the baseline hazard multiplicatively. This means that the baseline ‘hazard’ function effectively serves as the intercept (as in linear regression models).
In the context of the Cox PH model, longer reaction times are not considered as outliers (indeed, they are expected) and therefore are included in the analysis. As a conse-quence, it is not necessary to log-transform reaction times prior to analysis.
To account for the auto-correlation between trials due to self-monitoring, we included accuracy at the previous trial as a dummy-coded factor. Furthermore, the observations between items are expected to be correlated as they are taken in sequence. To take this correlation into account, we considerItem as a random effect in the Cox PH model. This allows the model to take into account the excess ‘risk’ or’frailty’ forItem, over any measured covariates (Therneau, Grambsch, & Pankratz, 2003): a random intercept is calculated for each item. The normality assumption shrinks the random effects estimates towards
13
the population mean (Lee, Nelder, & Pawitan, 2006). Hence, as an indication that the correlation between items is taken into account, we expect (and, in the present case, find) a reduction in the degrees of freedom of fit in random effects relative to the case in which we would includeItemas fixed effects.
Participant could not be included as a random effect because individual variation is accounted for by the fixed effects in this model. Participant variability is collinear with participant-related variables such asBPI, SES etc,14
as shown by the following diagnostic: when we includeParticipant as a fixed effect to check its impact on the other variables in the predictors,15
collinearity with the other variables in the model makes some parameters unestimable. Furthermore, excludingParticipantfrom the random effect structure is sound in terms of modelling, as confirmed by the following diagnostic: when we includeParticipant
as a random effect, the reduction in the degrees of freedom is minimal (only 8%), indicating that the (random) effects due to individual participants are relatively independent (e.g. in terms of background or genetic profile). This shows that there is no participant-induced structure that has to be accounted for by the model in addition to the baseline hazard function and their covariates as modifying factors.16
Implementation of the Cox PH regression analysis is explained in the Appendix. Results of the Cox PH regression analysis. The results of the optimal Cox PH model for our data are summarized in Table 13. As expected, performance was poorer in the incongruent condition (χ2(1) = 117.54, p < 0.0001). The strongest predictor of performance was Age χ2
(1) = 813.92, p < 0.0001), followed by self-monitoring — resulting in better performance in a given trial if the response to the previous trial had been accurate (χ2(1) = 119.81, p < 0.0001). Socio-economic status (SES) had the opposite effect in monolingual children vs. bilingual children as a group: whereas higher SES seemed to yield marginally poorer performance in monolingual children (χ2
(1) = 4.48, p = 0.03), it conferred a pronounced advantage in bilingual children, when considered as a group (χ2
(1) = 40.60, p < 0.0001). An alternative interpretation (suggested by an anonymous reviewer) is that as SES increases, a bilingual difference emerges. There was also a trend for the bilingual group as a whole to do better than the monolingual group (χ2(1) = 3.8, p= 0.05). Over and above that effect of group, the amount of bilingual experience conferred an overall advantage (χ2
(1) = 12.13, p= 0.0005). That advantage was not significantly greater in the incongruent condition (chi2(1) = 0.07, p= 0.78) — i.e., bilingualism did not give rise to the so-called “Simon effect” given the absence of a significant interaction between BPI and Condition.17
As shown in Figure 2, participants tended to slow down as the experiment progressed. Figure 2 presents the random effects estimates for items 1 to 48 in the experiment. Con-sidering the sequence of items, the figure indicates that the estimates have a significant downward linear trend (p= 0.013). Considering that the random effects estimates modify the baseline hazard, a lower estimate corresponds to a longer time in responding correctly
14
The systematic between-subject variability in our data iscapturedby participant-related variables, re-sulting in a model of more scientific value than an alternative model withParticipantas a random effect (as this would have to exclude participant-related variables.
15
This is relatively safe to do, considering that the participants are randomly selected.
16
See (Hougaard, 2000) for a demonstration of how the standard Cox PH model can capture individual-induced variabiltiy in that way, without the need for includingParticipantas a random effect.
17
Coefficient Coefficient Std.Error Chi-sq DF p (scaled)
Condition: incongruent -0.2470 -0.2471 0.0228 117.5452 1.0000 0.0000 Age (months) 0.0520 0.3360 0.0018 813.9154 1.0000 0.0000 Accuracy at previous trial 0.5243 0.5243 0.0479 119.8091 1.0000 0.0000
BPI 0.0027 0.1026 0.0006 17.7801 1.0000 0.0000
SES (occupation) -0.0100 -0.0839 0.0047 4.4800 1.0000 0.0342 Bilingual: yes 0.1151 0.1151 0.0589 3.8238 1.0000 0.0507
Gender -0.0071 -0.0071 0.0233 0.0938 1.0000 0.7625
Item 7.8878 8.1732 0.4622
[image:18.595.89.547.94.245.2]SES x Bilingual: yes 0.0415 0.3497 0.0065 40.5996 1.0000 0.0000 Table 13
Coefficients of the optimal Cox Proportional Hazard model fitted to the Time to Correct Response (with Item as random effect; reference levels: Condition = “congruent”, Accuracy at previous trial = “inaccurate”, Bilingual = “no”, Gender = “female”). Coefficient (scaled) are for the same model fitted using scaled predictors for BPI, SES and Age. The values in the other columns remain identical for both models.
to the Simon tasks.
Identifying a critical threshold of bilingual advantage
The use of a continuous variable indexing bilingualism makes it possible to identify the amount of bilingual experience18
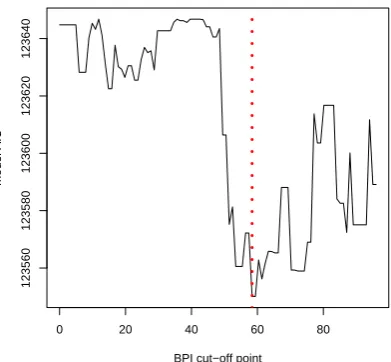
above which children’s performance on the Simon task starts to differ significantly from that of monolingual children. This can be done by partitioning children in two groups (insufficiently bilingual vs. sufficiently bilingual) recursively at each point of the BPI scale, and fitting the optimal Cox PH model (reported in Table 13) using each binary partition for bilingualism in turn. The model with the lowest AIC value is the one with the best fit, and is therefore interpreted as the one with the optimal BPI partitioning score. The AIC value for each of the 98 resulting models is plotted in Figure 3. The model with the lowest AIC value was based on a binary bilingualism partitioning at BPI = 59.19
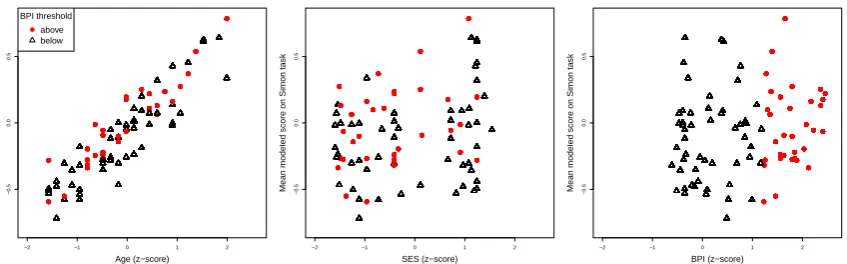
In our sample, 33 children had a BPI score of 59 or above, which means they were likely to benefit from an inhibitory advantage compared with monolinguals,all other things being equal. This represents 38% of the group of children who were exposed to more than one language. Their profiles are summarized in a table in the Supplementary Online Material. It is important to stress that being above the BPI threshold is only one among many factors predicting enhanced performance in the Simon task. Figure 4 illustrates this by plotting the bilingual children’s modeled scores against three of the significant predictors in our model (Age, SES and BPI, taking care of scaling them beforehand),20
highlighting
18
Strictly speaking, the BPI indexes the amount of experience in the Home Language, ranging from 0 (English monolinguals) to 96.
19
The model based on the optimal group partition does not yield a significant Simon effect either, but a general advantage (as in the present model).
20
●
● ●
● ●
●
● ●
● ●
●●
● ●
●
● ●
●
●
● ●
● ●
● ●
●
● ●
● ● ●
● ●
●
●
● ●
●
● ●
● ●
●
● ●
●
● ●
Random effect estimates
Item
Estimates
−0.03
−0.02
−0.01
0.00
0.01
0.02
[image:19.595.205.401.148.327.2]1 4 7 10 14 18 22 26 30 34 38 42 46
Figure 2. Random effect for item in the Cox PH model fitted to the Time to Correct Response
0 20 40 60 80
123560
123580
123600
123620
123640
BPI cut−off point
model AIC
[image:19.595.204.400.459.640.2]● ● ● ● ● ● ● ● ● ● ● ● ● ● ● ● ● ● ● ● ● ● ● ● ● ● ● ● ● ● ● ● ● ● ● ● ● ● ● ● ● ● ● ● ● ● ● ● ● ● ● ● ● ● ● ● ● ● ● ● ● ● ● ● ● ● ● ● ● ● ● ● ● ● ● ● ● ● ● ● ● ● ● ● ● ● ● ● ● ● ● ● ● ● ● ● ● ● ● ● ● ● ● ● ● ● ● ● ● ● ● ● ● ● ● ● ● ● ● ● ● ● ● ● ● ● ● ● ● ● ● ● ● ● ● ● ● ● ● ● ● ● ● ● ● ● ● ● ● ● ● ● ● ● ● ● ● ● ● ● ● ● ● ● ● ● ● ● ● ● ● ● ● ● ● ● ● ● ● ● ● ● ● ● ● ● ● ● ● ● ● ● ● ● ● ● ● ● ● ● ● ● ● ● ● ● ● ● ● ● ● ● ● ● ● ● ● ● ● ● ● ● ● ● ● ● ● ● ● ● ● ● ● ● ● ● ● ● ● ● ● ● ● ● ● ● ● ● ● ● ● ● ● ● ● ● ● ● ● ● ● ● ● ● ● ● ● ● ● ● ● ● ● ● ● ● ● ● ● ● ● ● ● ● ● ● ● ● ● ● ● ● ● ● ● ● ● ● ● ● ● ● ● ● ● ● ● ● ● ● ● ● ● ● ● ● ● ● ● ● ● ● ● ● ● ● ● ● ● ● ● ● ● ● ● ● ● ● ● ● ● ● ● ● ● ● ● ● ● ● ● ● ● ● ● ● ● ● ● ● ● ● ● ● ● ● ● ● ● ● ● ● ● ● ● ● ● ● ● ● ● ● ● ● ● ● ● ● ● ● ● ● ● ● ● ● ● ● ● ● ● ● ● ● ● ● ● ● ● ● ● ● ● ● ● ● ● ● ● ● ● ● ● ● ● ● ● ● ● ● ● ● ● ● ● ● ● ● ● ● ● ● ● ● ● ● ● ● ● ● ● ● ● ● ● ● ● ● ● ● ● ● ● ● ● ● ● ● ● ● ● ● ● ● ● ● ● ● ● ● ● ● ● ● ● ● ● ● ● ● ● ● ● ● ● ● ● ● ● ● ● ● ● ● ● ● ● ● ● ● ● ● ● ● ● ● ● ● ● ● ● ● ● ● ● ● ● ● ● ● ● ● ● ● ● ● ● ● ● ● ● ● ● ● ● ● ● ● ● ● ● ● ● ● ● ● ● ● ● ● ● ● ● ● ● ● ● ● ● ● ● ● ● ● ● ● ● ● ● ● ● ● ● ● ● ● ● ● ● ● ● ● ● ● ● ● ● ● ● ● ● ● ● ● ● ● ● ● ● ● ● ● ● ● ● ● ● ● ● ● ● ● ● ● ● ● ● ● ● ● ● ● ● ● ● ● ● ● ● ● ● ● ● ● ● ● ● ● ● ● ● ● ● ● ● ● ● ● ● ● ● ● ● ● ● ● ● ● ● ● ● ● ● ● ● ● ● ● ● ● ● ● ● ● ● ● ● ● ● ● ● ● ● ● ● ● ● ● ● ● ● ● ● ● ● ● ● ● ● ● ● ● ● ● ● ● ● ● ● ● ● ● ● ● ● ● ● ● ● ● ● ● ● ● ● ● ● ● ● ● ● ● ● ● ● ● ● ● ● ● ● ● ● ● ● ● ● ● ● ● ● ● ● ● ● ● ● ● ● ● ● ● ● ● ● ● ● ● ● ● ● ● ● ● ● ● ● ● ● ● ● ● ● ● ● ● ● ● ● ● ● ● ● ● ● ● ● ● ● ● ● ● ● ● ● ● ● ● ● ● ● ● ● ● ● ● ● ● ● ● ● ● ● ● ● ● ● ● ● ● ● ● ● ● ● ● ● ● ● ● ● ● ● ● ● ● ● ● ● ● ● ● ● ● ● ● ● ● ● ● ● ● ● ● ● ● ● ● ● ● ● ● ● ● ● ● ● ● ● ● ● ● ● ● ● ● ● ● ● ● ● ● ● ● ● ● ● ● ● ● ● ● ● ● ● ● ● ● ● ● ● ● ● ● ● ● ● ● ● ● ● ● ● ● ● ● ● ● ● ● ● ● ● ● ● ● ● ● ● ● ● ● ● ● ● ● ● ● ● ● ● ● ● ● ● ● ● ● ● ● ● ● ● ● ● ● ● ● ● ● ● ● ● ● ● ● ● ● ● ● ● ● ● ● ● ● ● ● ● ● ● ● ● ● ● ● ● ● ● ● ● ● ● ● ● ● ● ● ● ● ● ● ● ● ● ● ● ● ● ● ● ● ● ● ● ● ● ● ● ● ● ● ● ● ● ● ● ● ● ● ● ● ● ● ● ● ● ● ● ● ● ● ● ● ● ● ● ● ● ● ● ● ● ● ● ● ● ● ● ● ● ● ● ● ● ● ● ● ● ● ● ● ● ● ● ● ● ● ● ● ● ● ● ● ● ● ● ● ● ● ● ● ● ● ● ● ● ● ● ● ● ● ● ● ● ● ● ● ● ● ● ● ● ● ● ● ● ● ● ● ● ● ● ● ● ● ● ● ● ● ● ● ● ● ● ● ● ● ● ● ● ● ● ● ● ● ● ● ● ● ● ● ● ● ● ● ● ● ● ● ● ● ● ● ● ● ● ● ● ● ● ● ● ● ● ● ● ● ● ● ● ● ● ● ● ● ● ● ● ● ● ● ● ● ● ● ● ● ● ● ● ● ● ● ● ● ● ● ● ● ● ● ● ● ● ● ● ● ● ● ● ● ● ● ● ● ● ● ● ● ● ● ● ● ● ● ● ● ● ● ● ● ● ● ● ● ● ● ● ● ● ● ● ● ● ● ● ● ● ● ● ● ● ● ● ● ● ● ● ● ● ● ● ● ● ● ● ● ● ● ● ● ● ● ● ● ● ● ● ● ● ● ● ● ● ● ● ● ● ● ● ● ● ● ● ● ● ● ● ● ● ● ● ● ● ● ● ● ● ● ● ● ● ●●●●●●●●●●●●●●●●●●●●●●●●●●●●●●●●●●●●●●●●●●●●●●●●● ● ● ● ● ● ● ● ● ● ● ● ● ● ● ● ● ● ● ● ● ● ● ● ● ● ● ● ● ● ● ● ● ● ● ● ● ● ● ● ● ● ● ● ● ● ● ● ● ● ● ● ● ● ● ● ● ● ● ● ● ● ● ● ● ● ● ● ● ● ● ● ● ● ● ● ● ● ● ● ● ● ● ● ● ● ● ● ● ● ● ● ● ● ● ● ● ● ● ● ● ● ● ● ● ● ● ● ● ● ● ● ● ● ● ● ● ● ● ● ● ● ● ● ● ● ● ● ● ● ● ● ● ● ● ● ● ● ● ● ● ● ● ● ● ● ● ● ● ● ● ● ● ● ● ● ● ● ● ● ● ● ● ● ● ● ● ● ● ● ● ● ● ● ● ● ● ● ● ● ● ● ● ● ● ● ● ● ● ● ● ● ●
−2 −1 0 1 2
−0.5
0.0
0.5
Age (z−score)
Mean modeled score on Simon task
● BPI threshold above below ● ● ● ● ● ● ● ● ● ● ● ● ● ● ● ● ● ● ● ● ● ● ● ● ● ● ● ● ● ● ● ● ● ● ● ● ● ● ● ● ● ● ● ● ● ● ● ● ● ● ● ● ● ● ● ● ● ● ● ● ● ● ● ● ● ● ● ● ● ● ● ● ● ● ● ● ● ● ● ● ● ● ● ● ● ● ● ● ● ● ● ● ● ● ● ● ● ● ● ● ● ● ● ● ● ● ● ● ● ● ● ● ● ● ● ● ● ● ● ● ● ● ● ● ● ● ● ● ● ● ● ● ● ● ● ● ● ● ● ● ● ● ● ● ● ● ● ● ● ● ● ● ● ● ● ● ● ● ● ● ● ● ● ● ● ● ● ● ● ● ● ● ● ● ● ● ● ● ● ● ● ● ● ● ● ● ● ● ● ● ● ● ● ● ● ● ● ● ● ● ● ● ● ● ● ● ● ● ● ● ● ● ● ● ● ● ● ● ● ● ● ● ● ● ● ● ● ● ● ● ● ● ● ● ● ● ● ● ● ● ● ● ● ● ● ● ● ● ● ● ● ● ● ● ● ● ● ● ● ● ● ● ● ● ● ● ● ● ● ● ● ● ● ● ● ● ● ● ● ● ● ● ● ● ● ● ● ● ● ● ● ● ● ● ● ● ● ● ● ● ● ● ● ● ● ● ● ● ● ● ● ● ● ● ● ● ● ● ● ● ● ● ● ● ● ● ● ● ● ● ● ● ● ● ● ● ● ● ● ● ● ● ● ● ● ● ● ● ● ● ● ● ● ● ● ● ● ● ● ● ● ● ● ● ● ● ● ● ● ● ● ● ● ● ● ● ● ● ● ● ● ● ● ● ● ● ● ● ● ● ● ● ● ● ● ● ● ● ● ● ● ● ● ● ● ● ● ● ● ● ● ● ● ● ● ● ● ● ● ● ● ● ● ● ● ● ● ● ● ● ● ● ● ● ● ● ● ● ● ● ● ● ● ● ● ● ● ● ● ● ● ● ● ● ● ● ● ● ● ● ● ● ● ● ● ● ● ● ● ● ● ● ● ● ● ● ● ● ● ● ● ● ● ● ● ● ● ● ● ● ● ● ● ● ● ● ● ● ● ● ● ● ● ● ● ● ● ● ● ● ● ● ● ● ● ● ● ● ● ● ● ● ● ● ● ● ● ● ● ● ● ● ● ● ● ● ● ● ● ● ● ● ● ● ● ● ● ● ● ● ● ● ● ● ● ● ● ● ● ● ● ● ● ● ● ● ● ● ● ● ● ● ● ● ● ● ● ● ● ● ● ● ● ● ● ● ● ● ● ● ● ● ● ● ● ● ● ● ● ● ● ● ● ● ● ● ● ● ● ● ● ● ● ● ● ● ● ● ● ● ● ● ● ● ● ● ● ● ● ● ● ● ● ● ● ● ● ● ● ● ● ● ● ● ● ● ● ● ● ● ● ● ● ● ● ● ● ● ● ● ● ● ● ● ● ● ● ● ● ● ● ● ● ● ● ● ● ● ● ● ● ● ● ● ● ● ● ● ● ● ● ● ● ● ● ● ● ● ● ● ● ● ● ● ● ● ● ● ● ● ● ● ● ● ● ● ● ● ● ● ● ● ● ● ● ● ● ● ● ● ● ● ● ● ● ● ● ● ● ● ● ● ● ● ● ● ● ● ● ● ● ● ● ● ● ● ● ● ● ● ● ● ● ● ● ● ● ● ● ● ● ● ● ● ● ● ● ● ● ● ● ● ● ● ● ● ● ● ● ● ● ● ● ● ● ● ● ● ● ● ● ● ● ● ● ● ● ● ● ● ● ● ● ● ● ● ● ● ● ● ● ● ● ● ● ● ● ● ● ● ● ● ● ● ● ● ● ● ● ● ● ● ● ● ● ● ● ● ● ● ● ● ● ● ● ● ● ● ● ● ● ● ● ● ● ● ● ● ● ● ● ● ● ● ● ● ● ● ● ● ● ● ● ● ● ● ● ● ● ● ● ● ● ● ● ● ● ● ● ● ● ● ● ● ● ● ● ● ● ● ● ● ● ● ● ● ● ● ● ● ● ● ● ● ● ● ● ● ● ● ● ● ● ● ● ● ● ● ● ● ● ● ● ● ● ● ● ● ● ● ● ● ● ● ● ● ● ● ● ● ● ● ● ● ● ● ● ● ● ● ● ● ● ● ● ● ● ● ● ● ● ● ● ● ● ● ● ● ● ● ● ● ● ● ● ● ● ● ● ● ● ● ● ● ● ● ● ● ● ● ● ● ● ● ● ● ● ● ● ● ● ● ● ● ● ● ● ● ● ● ● ● ● ● ● ● ● ● ● ● ● ● ● ● ● ● ● ● ● ● ● ● ● ● ● ● ● ● ● ● ● ● ● ● ● ● ● ● ● ● ● ● ● ● ● ● ● ● ● ● ● ● ● ● ● ● ● ● ● ● ● ● ● ● ● ● ● ● ● ● ● ● ● ● ● ● ● ● ● ● ● ● ● ● ● ● ● ● ● ● ● ● ● ● ● ● ● ● ● ● ● ● ● ● ● ● ● ● ● ● ● ● ● ● ● ● ● ● ● ● ● ● ● ● ● ● ● ● ● ● ● ● ● ● ● ● ● ● ● ● ● ● ● ● ● ● ● ● ● ● ● ● ● ● ● ● ● ● ● ● ● ● ● ● ● ● ● ● ● ● ● ● ● ● ● ● ● ● ● ● ● ● ● ● ● ● ● ● ● ● ● ● ● ● ● ● ● ● ● ● ● ● ● ● ● ● ● ● ● ● ● ● ● ● ● ● ● ● ● ● ● ● ● ● ● ● ● ● ● ● ● ● ● ● ● ● ● ● ● ● ● ● ● ● ● ● ● ● ● ● ● ● ● ● ● ● ● ● ● ● ● ● ● ● ● ● ● ● ● ● ● ● ● ● ● ● ● ● ● ● ● ● ● ● ● ● ● ● ● ● ● ● ● ● ● ● ● ● ● ● ● ● ● ● ● ● ● ● ● ● ● ● ● ● ● ● ● ● ● ● ● ● ● ● ● ● ● ● ● ● ● ● ● ● ● ● ● ● ● ● ● ● ● ● ● ● ● ● ● ● ● ● ● ● ● ● ● ● ● ● ● ● ● ● ● ● ● ● ● ● ● ● ● ● ● ● ● ● ● ● ● ● ● ● ● ● ● ● ● ● ● ● ● ● ● ● ● ● ● ● ● ● ● ● ● ● ● ● ● ● ● ● ● ● ● ● ● ● ● ● ● ● ● ● ● ● ● ● ● ● ● ● ● ● ● ● ● ● ● ● ● ● ● ● ● ● ● ● ● ● ● ● ● ● ● ● ● ● ● ● ● ● ● ● ● ● ● ● ● ● ● ● ● ● ● ● ● ● ● ● ● ● ● ● ● ● ● ● ● ● ● ● ● ● ● ● ● ● ● ● ● ● ● ● ● ● ● ● ● ● ● ● ● ● ● ● ● ● ● ● ● ● ● ● ● ● ● ● ● ● ● ● ● ● ● ● ● ● ● ● ● ● ● ● ● ● ● ● ● ● ● ● ● ●
−2 −1 0 1 2
−0.5
0.0
0.5
SES (z−score)
Mean modeled score on Simon task
● ● ● ● ● ● ● ● ● ● ● ● ● ● ● ● ● ● ● ● ● ● ● ● ● ● ● ● ● ● ● ● ● ● ● ● ● ● ● ● ● ● ● ● ● ● ● ● ● ● ● ● ● ● ● ● ● ● ● ● ● ● ● ● ● ● ● ● ● ● ● ● ● ● ● ● ● ● ● ● ● ● ● ● ● ● ● ● ● ● ● ● ● ● ● ● ● ● ● ● ● ● ● ● ● ● ● ● ● ● ● ● ● ● ● ● ● ● ● ● ● ● ● ● ● ● ● ● ● ● ● ● ● ● ● ● ● ● ● ● ● ● ● ● ● ● ● ● ● ● ● ● ● ● ● ● ● ● ● ● ● ● ● ● ● ● ● ● ● ● ● ● ● ● ● ● ● ● ● ● ● ● ● ● ● ● ● ● ● ● ● ● ● ● ● ● ● ● ● ● ● ● ● ● ● ● ● ● ● ● ● ● ● ● ● ● ● ● ● ● ● ● ● ● ● ● ● ● ● ● ● ● ● ● ● ● ● ● ● ● ● ● ● ● ● ● ● ● ● ● ● ● ● ● ● ● ● ● ● ● ● ● ● ● ● ● ● ● ● ● ● ● ● ● ● ● ● ● ● ● ● ● ● ● ● ● ● ● ● ● ● ● ● ● ● ● ● ● ● ● ● ● ● ● ● ● ● ● ● ● ● ● ● ● ● ● ● ● ● ● ● ● ● ● ● ● ● ● ● ● ● ● ● ● ● ● ● ● ● ● ● ● ● ● ● ● ● ● ● ● ● ● ● ● ● ● ● ● ● ● ● ● ● ● ● ● ● ● ● ● ● ● ● ● ● ● ● ● ● ● ● ● ● ● ● ● ● ● ● ● ● ● ● ● ● ● ● ● ● ● ● ● ● ● ● ● ● ● ● ● ● ● ● ● ● ● ● ● ● ● ● ● ● ● ● ● ● ● ● ● ● ● ● ● ● ● ● ● ● ● ● ● ● ● ● ● ● ● ● ● ● ● ● ● ● ● ● ● ● ● ● ● ● ● ● ● ● ● ● ● ● ● ● ● ● ● ● ● ● ● ● ● ● ● ● ● ● ● ● ● ● ● ● ● ● ● ● ● ● ● ● ● ● ● ● ● ● ● ● ● ● ● ● ● ● ● ● ● ● ● ● ● ● ● ● ● ● ● ● ● ● ● ● ● ● ● ● ● ● ● ● ● ● ● ● ● ● ● ● ● ● ● ● ● ● ● ● ● ● ● ● ● ● ● ● ● ● ● ● ● ● ● ● ● ● ● ● ● ● ● ● ● ● ● ● ● ● ● ● ● ● ● ● ● ● ● ● ● ● ● ● ● ● ● ● ● ● ● ● ● ● ● ● ● ● ● ● ● ● ● ● ● ● ● ● ● ● ● ● ● ● ● ● ● ● ● ● ● ● ● ● ● ● ● ● ● ● ● ● ● ● ● ● ● ● ● ● ● ● ● ● ● ● ● ● ● ● ● ● ● ● ● ● ● ● ● ● ● ● ● ● ● ● ● ● ● ● ● ● ● ● ● ● ● ● ● ● ● ● ● ● ● ● ● ● ● ● ● ● ● ● ● ● ● ● ● ● ● ● ● ● ● ● ● ● ● ● ● ● ● ● ● ● ● ● ● ● ● ● ● ● ● ● ● ● ● ● ● ● ● ● ● ● ● ● ● ● ● ● ● ● ● ● ● ● ● ● ● ● ● ● ● ● ● ● ● ● ● ● ● ● ● ● ● ● ● ● ● ● ● ● ● ● ● ● ● ● ● ● ● ● ● ● ● ● ● ● ● ● ● ● ● ● ● ● ● ● ● ● ● ● ● ● ● ● ● ● ● ● ● ● ● ● ● ● ● ● ● ● ● ● ● ● ● ● ● ● ● ● ● ● ● ● ● ● ● ● ● ● ● ● ● ● ● ● ● ● ● ● ● ● ● ● ● ● ● ● ● ● ● ● ● ● ● ● ● ● ● ● ● ● ● ● ● ● ● ● ● ● ● ● ● ● ● ● ● ● ● ● ● ● ● ● ● ● ● ● ● ● ● ● ● ● ● ● ● ● ● ● ● ● ● ● ● ● ● ● ● ● ● ● ● ● ● ● ● ● ● ● ● ● ● ● ● ● ● ● ● ● ● ● ● ● ● ● ● ● ● ● ● ● ● ● ● ● ● ● ● ● ● ● ● ● ● ● ● ● ● ● ● ● ● ● ● ● ● ● ● ● ● ● ● ● ● ● ● ● ● ● ● ● ● ● ● ● ● ● ● ● ● ● ● ● ● ● ● ● ● ● ● ● ● ● ● ● ● ● ● ● ● ● ● ● ● ● ● ● ● ● ● ● ● ● ● ● ● ● ● ● ● ● ● ● ● ● ● ● ● ● ● ● ● ● ● ● ● ● ● ● ● ● ● ● ● ● ● ● ● ● ● ● ● ● ● ● ● ● ● ● ● ● ● ● ● ● ● ● ● ● ● ● ● ● ● ● ● ● ● ● ● ● ● ● ● ● ● ● ● ● ● ● ● ● ● ● ● ● ● ● ● ● ● ● ● ● ● ● ● ● ● ● ● ● ● ● ● ● ● ● ● ● ● ● ● ● ● ● ● ● ● ● ● ● ● ● ● ● ● ● ● ● ● ● ● ● ● ● ● ● ● ● ● ● ● ● ● ● ● ● ● ● ● ● ● ● ● ● ● ● ● ● ● ● ● ● ● ● ● ● ● ● ● ● ● ● ● ● ● ● ● ● ● ● ● ● ● ● ● ● ● ● ● ● ● ● ● ● ● ● ● ● ● ● ● ● ● ● ● ● ● ● ● ● ● ● ● ● ● ● ● ● ● ● ● ● ● ● ● ● ● ● ● ● ● ● ● ● ● ● ● ● ● ● ● ● ● ● ● ● ● ● ● ● ● ● ● ● ● ● ● ● ● ● ● ● ● ● ● ● ● ● ● ● ● ● ● ● ● ● ● ● ● ● ● ● ● ● ● ● ● ● ● ● ● ●●●●●●●●●●●●●●●●●●●●●●●●●●●●●●●●●●●●●●●●●●●●●●●● ● ● ● ● ● ● ● ● ● ● ● ● ● ● ● ● ● ● ● ● ● ● ● ● ● ● ● ● ● ● ● ● ● ● ● ● ● ● ● ● ● ● ● ● ● ● ● ● ● ● ● ● ● ● ● ● ● ● ● ● ● ● ● ● ● ● ● ● ● ● ● ● ● ● ● ● ● ● ● ● ● ● ● ● ● ● ● ● ● ● ● ● ● ● ● ● ● ● ● ● ● ● ● ● ● ● ● ● ● ● ● ● ● ● ● ● ● ● ● ● ● ● ● ● ● ● ● ● ● ● ● ● ● ● ● ● ● ● ● ● ● ● ● ● ● ● ● ● ● ● ● ● ● ● ● ● ● ● ● ● ● ● ● ● ● ● ● ● ● ● ● ● ● ● ● ● ● ● ● ● ● ● ● ● ● ● ● ● ● ● ● ●
−2 −1 0 1 2
−0.5
0.0
0.5
BPI (z−score)
[image:20.595.94.518.103.235.2]Mean modeled score on Simon task
Figure 4. Bilingual children’s modeled scores in the Simon task (as estimated by the Cox regression model), according to scaled predictors for (i)Age, (ii)Socio-Economic Status, and (iii) bilingual experience (BPI). A higher value on the y-axis indicates better performance (i.e. more accurate and faster).
whether or not the children were above the critical BPI threshold. This plot also shows thatAge is much more strongly correlated with a high score than SES orBPI.
Discussion
The results reveal a mixed picture regarding the impact of bilingual experience on executive function performance, as indexed by the three tasks in our study. This is not unexpected “because of the uncertainty about what components of executive functions dif-ferent tasks tap, and uncertainty about the importance of task features that are orthogonal to executive function” (Valian, 2015, 9).
Results from the working memory tests showed very little variation, making them insufficiently discriminative to be able to detect the influence of likely predictors. Most of the variance in working memory was predicted by short term memory. Because of this, we suggest that the predictors of short term memory could be interpreted as indirect predic-tors of working memory. This includes Age, SES (conferring an advantage) and Gender
(with girls outperforming boys). Given the lack of substantial variation, our study remains inconclusive as to the effect of bilingualism on updating skills. Other studies have reported a bilingual advantage at similar ages (Blom et al., 2014) or younger (Brito et al., 2015).
Although considered to be non-verbal, the DCCS switching task included constant verbal reminders of the sorting rules. This was intended to control for the effect of short-term memory, but there remained a trend for better performance in children with better short-term memory. Crucially, it appears the frequent verbal instructions induced an effect of language proficiency on performance. The amount of bilingual experience did however not have an effect (even if Proficiency was not included as a predictor). Instead, only the children in the (highly heterogeneous) bilingual group benefited from a socio-economic advantage. A limitation of our study is that reaction times were not recoded.