This is a repository copy of Using 2011 Census data to estimate future elderly health care demand.
White Rose Research Online URL for this paper: http://eprints.whiterose.ac.uk/107394/
Version: Accepted Version
Book Section:
Clark, S orcid.org/0000-0003-4090-6002, Birkin, M, Heppenstall, A
orcid.org/0000-0002-0663-3437 et al. (1 more author) (2017) Using 2011 Census data to estimate future elderly health care demand. In: Stillwell, J, (ed.) The Routledge Handbook of Census Resources, Methods and Applications: Unlocking the UK 2011 Census.
Routledge Handbooks . Routledge , London, UK , pp. 305-319. ISBN 9781472475886
(c) 2016 - Routledge. This is an Accepted Manuscript of a book chapter published by Routledge in The Routledge Handbook of Census Resources, Methods and Applications: Unlocking the UK 2011 Census. on 15th August 2017 available online:
http://www.routledge.com/9781472475886
[email protected] https://eprints.whiterose.ac.uk/ Reuse
Items deposited in White Rose Research Online are protected by copyright, with all rights reserved unless indicated otherwise. They may be downloaded and/or printed for private study, or other acts as permitted by national copyright laws. The publisher or other rights holders may allow further reproduction and re-use of the full text version. This is indicated by the licence information on the White Rose Research Online record for the item.
Takedown
If you consider content in White Rose Research Online to be in breach of UK law, please notify us by
Chapter 23
Using 2011 Census Data to Estimate Future Elderly Heath Care
Demand
Stephen Clark, Mark Birkin, Alison Heppenstall and Philip Rees
Abstract
There is recognition by health planners and academics that the ageing of populations has the potential to place growing demands on health services, and that this pattern of demand will vary by place. This chapter outlines how the 2011 Census aggregate outputs, together with microdata from the English Longitudinal Study of Ageing (ELSA), have been used to estimate the demand placed on the health services in each English local authority district to 2031, focusing on three specific morbidities. The morbidities studied are cardiovascular disease (CVD), diabetes or high blood sugar (DHBS) and respiratory illnesses (RI). Together, these three morbidities are the primary cause of nearly half the deaths in those aged 50 and older. The Census 2011 data also provide inputs for the sub-national population projections and for the revision of 2001 Census based local ethnic projections. Without these Census data, the spatial scale for this modelling would need to be regional at best and local variations would be absent, making future resource planning difficult.
23.1 Introduction
Many western societies are predicting an important shift in the composition of their
populations. The clear historical and anticipated future trend is for the elderly
population to increase, both in numbers and as a proportion of the total population
(Rechel et al., 2009; European Commission, 2014). For England, the latest
2014-based principal projection by the Office for National Statistics (ONS, 2015) shows the
English population aged 50 and older increasing from 19.4 million in 2014 to 24.8
million in 2034, a gain of 5.4 million. This is in the context of a more modest increase
of 2.1 million in the 49 and younger population.
The question arises as to what this ageing phenomenon will mean for society
at large (Rutherford, 2011; House of Lords, 2013). Whilst longer life expectancies are
to be celebrated, the ageing of the population is, at best, seen as a challenge
(Christensen et al., 2009) and at worst, a threat (Laurence, 2002). But, in terms of
provision of services for an ageing population, health is an area where the impact of
an ageing population will be most keenly felt (Wanless, 2004; Craig and Mindell,
questions arise around its economic, social and cultural composition. For example, the
ethnic composition of the ageing population may change over time, with a trend
towards greater diversity; the lifestyle history of the population will evolve, with
downward trends in smoking and rising obesity; and the employment history will
continue to transition away from manual occupations such as mining, steel and textiles
towards retail and service occupations. Since health care planning and delivery are
carried out at the local level, it is also important to gain an understanding of the
changes in the geographic distribution of this demand.
23.2 Determinants of health care
The health care demands associated with an elderly population and the determinants
affecting this demand are intensively studied. Some research examines the
prevalence of specific morbidities (Seshamani and Gray, 2004); other work looks at
either general health or the presence of limiting activities (Lubitz et al., 2003). Many
studies, particularly from North America, model health care costs as a proxy for ill
health (Denton et al., 2002). The general findings are that as people get older they are
more prone to develop morbidities or be in generally worse health. This means that,
all other things being equal, an older population will tend to have worse health
(Alemayehu and Warner, 2004). However, chronological age itself may not be the
actual driver of health status. Some studies have reported that it is the remaining years of life that are important, with an individual’s health deteriorating in the final months or years before death (Zweifel et al., 1999). Others take the argument further and suggest
that it is not age or the remaining years of life that are important but the presence of a
disabling condition (de Meijer et al., 2011).
Gender and ethnic differences influence health status as well. Females live
longer than males but these extra years are not necessarily spent in good health. In
regards to ethnicity, there are some morbidity conditions that are more prevalent within
certain ethnic groups, e.g. diabetes is more prevalent in the south Asian population
(HSCIC, 2005). A person’s socio-economic status, measured using income, wealth,
education or employment indicators, can also influence health (McCulloch, 2011).
A range of data exists to study the health outcomes for an aged population.
Population censuses provide extensive coverage of the characteristics of the
for health outcomes. However, the actual information collected in the census on health
is general and rarely touches on specific morbidities. In addition, the time interval
between censuses can be long. To try and overcome these issues, governments often
commission national sample surveys that can either be general in nature or targeted
on a particular public policy issue, such as health. In an era where administrative
systems are increasingly being implemented and coordinated, scope has arisen to use
such data for researching health status.
The literature identifies two main approaches used to model elderly health care
demand, either statistical modelling or simulation. Statistical modelling is the approach
most often used (see Brailsford et al., 2009, for a review of such methodologies). The
advantage of this approach is that it is grounded in statistical theory, which allows for
various interpretative and testing regimes to be followed. The disadvantage is that
statistical modelling is rigid in both its outcome and the reliance on the assumptions
that underlie the modelling technique. Just as are there many statistical techniques
which can be used, there is also a wide variety of simulation methods. These methods
attempt to replicate the composition or behaviour of a population, either real or
hypothetical. They commonly use the technique of Monte Carlo simulation to replicate
a decision-making process within the simulation system (Brailsford, 2007). The
advantage of such an approach is that the simulation can be built using information on
the processes being simulated or by simple rules informed from an understanding of
the dynamics of health care. However, the drawback is that it is sometimes difficult to
disentangle these dynamics, particularly when unexpected or little understood
interactions occur.
23.3 The 2011 Census and health
Questions on health are a fairly recent addition to the UK censuses, starting in the
1991 Census with a question on whether the individual considered that he or she had
a long-term illness which limited their activities. A question on self-assessed general
health was added in the 2001 Census, using a three-point scale of “Good, Fairly good
or Not good”. Also in 2001, a question was asked about the amount of time devoted
to caring for family members, neighbours or friends.
Prior to the 2011 Census, the ONS conducted a consultation exercise on the
the health questions in the census and for continuity so that long-term trends could be
assessed. There was, however, scope for some changes. The question on the
presence of a limiting long-term illness (LLTI) was expanded from a binary “yes or no”
response to a “no, limited a little or limited a lot” response. The general health question
was expanded from a three-point to a five-point scale. The question on the amount of
caring provided question remained unchanged from 2001.
The UK censuses are therefore able to capture the variations in self-rated
health in a population, at geographic scales that vary from small areas to countries.
What the censuses do not provide are any details on which specific conditions or
morbidities cause individuals to assess their health as less than good. For general
health planning and the allocation of resources, these general measures may be
sufficient, but more detailed local health planning information on which morbidities are
present are of greater value. This information could then influence the relative
allocation of resources to various sectors of the health system, e.g. to local
pharmacies, general practitioners, hospitals or specialist treatment centres. Whilst
surveys are available that begin to capture this detail of information, they are not
comparable to the census in being able to provide the geographically specific
information. What is therefore required is a way to combine the rich geographic details
of the census with the information rich detail contained in these surveys.
23.4 Spatial microsimulation
A technique that is often used to achieve this goal is spatial microsimulation. The
technique attempts to reconstruct a population of individuals for a specific area from a
sample population. Individuals are chosen, with replacement, from this sample
population, based on a comparison of their individual characteristics and the known
aggregate characteristics of the population of the area. Thus, if an area contains a
count of 200 individuals who are male, aged 55 to 59 and of Chinese ethnicity, then
the task is to repeatedly select individuals from the sample population to meet this
constraint. The spatial microsimulation task is to estimate a set of area-specific
weights to apply to the sample population so that, when the sample population is
aggregated using these weights, they reproduce the aggregate constraint counts.
Spatial microsimulation has been used widely in the field of health (Brown, 2011). This
further modelling exercises. Applications in the area of health planning have included
morbidity prevalence estimates (Clark et al., 2014; Shulman et al., 2015), the
prevalence of obesity (Edwards et al., 2011), people who smoke (Smith et al., 2011)
and care needs (Lymer et al., 2009).
Immediately the value of the census tabulations becomes apparent in that they
are able to provide the constraint count tables. These counts are very accurate
estimates for small areas and are flexible in the range of multi-dimensional
cross-tabulations that are possible. Hermes and Poulsen (2012) recommend using such
multi-dimensional tables as constraints in spatial microsimulations and the Detailed
Characteristics and Local Characteristics tables from the 2011 Census are ideally
suited to this purpose.
Attention then turns to a source for the individual microdata to be sampled. The
microdata outputs from the 2011 Census are not suitable since they do not add any
extra information. There are, however, some government surveys that may be of
value. These include the Health Survey for England (HSfE) (Joint Health Surveys Unit,
2012) and the English Longitudinal Study of Ageing (ELSA) (Institute for Fiscal
Studies, 2015). The HSfE is able to provide a detailed picture of the health of the
English population and also trends in various health related activities, e.g. smoking,
drinking, gambling and physical activity. Since the HSfE is a general health survey, it
is not able to give particular prominence to sub-sections of the population, although
there are occasional one-off survey boosts to the survey to highlight for example, the
health of ethnic minorities, young people or the elderly. Of particular concern to a study
of the elderly population is that the HSfE does not include in its sample residents in
communal establishments such as residential or nursing homes. Outputs from the
2011 Census show that, particularly for the very old, such residents are a substantial
part of the elderly population.
The ELSA is a survey that is particularly geared to gaining an insight into the
lives of the elderly population of England. The purpose of the survey is to examine the
life histories of the ageing population of England in order to better understand the
impact of both ageing and the passage of time on health. ELSA data are not limited to
physical and psychological health outcomes but include a wide range of objective and
pensions, income and assets, housing and social participation. ELSA participants are
aged 50 or older and at each biennial survey wave attempts are made to contact the
same individuals. The ELSA asks the same range of questions at each wave and
questions about morbidities associated with an elderly population are given particular
prominence. The feature of the ELSA that makes it particularly suitable as a sample
population is that it surveys individuals who have moved into a communal residential
setting.
Candidate constraints
Anderson (2007) sets out four criteria for the selection of suitable constraints for a
spatial microsimulation:
1. compatibility of definition in the constraint and sample populations;
2. availability for the unit of analysis (in his case, households, but here individuals); 3. reasonable predictive power at the small area level; and
4. good predictive power at the unit of analysis level.
Here, a joint consideration of criteria two and three is used to identify a long list of
candidate constraint variables, which is then refined in light of the first and fourth
criteria. Examination of the literature suggests that there are differences in health
outcomes by age, with ill health becoming more common at older ages. Gender can
also influence health outcomes. It is likely that the presence of a morbidity condition
will cause a person to assess his/her own health as either “not good” or as “limiting
their activities”. Individuals from certain ethnic groups have differing health profiles for
some morbidity conditions. Someone who is cohabiting or in a relationship has better
health outcomes compared to someone who has always lived alone or who is
separated or widowed. The socio-economic status of the individual needs also to be
taken account of. This can be measured directly using the individual’s socio-economic
status classification (NS-SeC) (Rose et al., 2005) or indirectly using information on the
tenure of the household in which they live (as a proxy for wealth), the level of highest
qualification (as a proxy for both wealth and income) or through the level of vehicle
ownership (as a proxy for both income and mobility). These variables therefore
emerge as candidate constraints under criteria two and three. A detailed examination
of the 2011 Census and the ELSA wave 5 variables demonstrates that variables with
criterion, leaving the final criterion, the performance of the variable in predicting the
outcome of interest, to be considered.
Anderson tackled the fourth criterion using an incremental series of nested
binary logistic regressions with a succession of candidate explanatory variables. Here
a similar approach is used by estimating three hazard models, a form of logistic
regression (Singer and Willet, 2003), one each for the presence of cardio vascular
disease (CVD), diabetes or high blood sugar (DHBS) and respiratory illness (RI), and
testing the suitability of each constraint variable. In order of importance, the hazard
models identified the presence of a limiting long term illness, age, gender and ethnicity
as important socio-demographic influences on the incidence of the three morbidities
(ethnicity was particularly influential on diabetes). Of the candidate socio-economic
variables, living arrangements, car ownership and NS-SeC were influential for the
morbidities. The influences of tenure, education qualification and the amount of care
giving were found to be poor. The results of the hazard modelling suggest that the
2011 Census tables shown in Table 23.1 could be used as possible constraints.
Tables DC1117 (age and gender), DC2101 (ethnicity) and DC6114 (NS-SeC)
are based on the usual resident population, which is the population under study.
Tables LC3101 (disability), DC1108 (living arrangements), DC4109 (vehicle
ownership) are based on those resident in households, which is a subset of the usually
resident population. The remaining table DC3402 (disability) is based on those who
are resident in communal establishments. It is desirable to have a consistent
population in all the constraint tables; here the residential population of the area. (This
is possible with 2011 Census counts since they have not been subject to post-tabular
disclosure control, see Stillwell and Duke-Williams, 2007, for its impact on 2001
Census outputs). This consistent population is achieved by identifying a ‘residual’
population in each local authority district (LAD) in the household and communal
establishment residential populations about whom nothing is known other than their ‘otherness’ in regard to the substantive population of the table. Thus, if the level of household vehicle ownership is known for 1,000 residents in households in the LAD
disability status is known in table DC3402, a category of ‘household’ is created in this table with a count of 1,000. Since these residual categories now exist in the tables, it
is necessary to provide individuals in the sample population with these residual
characteristics who can be sampled. So for example, this is achieved by associating
the level of vehicle ownership for a sample individual who is resident in a communal establishment as ‘residual’ (i.e. unknown).
Table 23.1 Census 2011 tables which are candidates to serve as constraints for the
microsimulation model
Table Age
bands Categories
DC1117 (Age structure) Single years of age Not applicable LC3101 (Disability) * 50-54 55-59 60-64 65-69 70-74 75-79 80-84 85 and older
Limited, not limited
DC2101 (Ethnicity)
English/Welsh/Scottish/Northern Irish/British, Irish, Gypsy or Irish Traveller, Other White, White and Black Caribbean, White and Black African, White and Asian, Other Mixed, Indian, Pakistani, Bangladeshi, Chinese, Other Asian, African Caribbean, Other Black, Arab, Any other ethnic group
DC1108 (Living
Arrangements) *
Married couple, Cohabiting, Single, Married (not a couple), Separated, Divorced, Widowed
DC4109
(Vehicle ownership or use) *
No vehicle, one vehicle, two or more vehicles
DC6114 (NS-SeC)
50-64 65 and
older
1.1 Large employers and higher managerial and administrative occupations, 1.2 Higher professional occupations, 2. Lower managerial, administrative and professional occupations, 3. Intermediate occupations, 4. Small employers and own account workers, 5. Lower supervisory and technical occupations, 6. Semi-routine occupations, 7. Routine occupations, 8. Never worked and long-term unemployed, L14.1 Never worked, L14.2 Long-term unemployed, L15 Full-time students
DC3402 (Disability) +
65 to 74 75 to 84 85 and
older
Limited a lot, limited a little, not limited, staff member, family member
Notes:
* The population base is residents in households.
+ The population base is residents in institutional establishments.
The Flexible Modelling Framework (FMF) software package is used to derive
microsimulation uses the combinatorial optimisation approach (Voas and Williamson,
2000). In this approach, an objective function is defined that measures how well the
weighted aggregate counts in the sample population agree with the constraint counts
in each constraint table. Commonly, the Total Absolute Error (TAE), which measures
the absolute value of the difference between the weighted aggregate counts and the
census tabulated counts, is chosen as both the objective function and a measure of
goodness-of-fit. Rather than use all seven constraint tables in the weight estimation
process, only five are used, with vehicle ownership and NS-SeC held back for
validation purposes.
To derive the spatial weights for a population of just over 18 million people, the
FMF takes 12 hours on a quad core i5-2300 PC with 4GB of RAM running Windows
7. The outputs of the FMF are contained in two files: a sample weights file that contains
pairs of zone identifiers (the LAD codes) and sample member identifiers (ELSA
participant codes) and a statistical fit file that reports the TAE at the end of each
annealing stage for each LAD. The average final TAE value is just 39 and the largest
is 272 for Birmingham. This means that just 272 of the 292,565 individuals aged 50
and older living in Birmingham (0.093%) have been miss-allocated to one of the
constraints across all five constraint tables.
Prevalence estimates for 2011
As well as the constraint variables that correspond with 2011 Census variables, the
ELSA also contains information about the individual that has no equivalent in the
census, such as the morbidity status of the individual. Using the LAD specific spatial
weights estimated by the FMF and knowledge of which individuals in the sampling
population have a morbidity condition at wave 5, it is possible to estimate the number
of individuals in each LAD with a morbidity condition and also the prevalence rate.
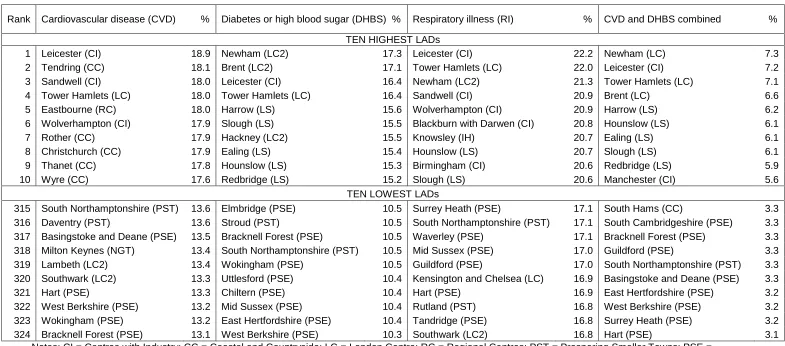
Table 23.2 reports the 10 LADs with the highest estimated prevalence rates and the
10 LADs with the lowest, along with their 2001 ONS area classification type (ONS,
2003).
For those LADs with high CVD prevalence rates, there is a range of LAD types.
Some LADs will have a population which is generally in poorer health, the causes of
which could be employment history or lifestyle factors (e.g. Tendring, a depressed
coastal district). Another explanation could be the ethnic makeup of the area, with
some ethnic groups tending to have a higher prevalence of the conditions that
contribute to CVD (e.g. Tower Hamlets with a large Bangladeshi population). A final
explanation could be related to a generally aged population living in the area, with the
incidences of CVD accumulating in an older age structure (e.g. Eastbourne). For
DHBS, the most important defining characteristic is the ethnic composition of the LAD,
with all the top 10 LADs having a high proportion of their population from the black and
minority ethnic (BME) community, in particular from the south Asian groups, which
tend to have higher rates of diabetes than the general population. With RI, there
appears to be both an ethnic and deprivation dimension to those LADs in the top 10,
indicating that this morbidity affects individuals differently depending on their ethnicity
or deprivation. The LADs with the highest prevalence for the comorbidity of CVD and
DHBS appear to be those most impacted by DHBS prevalence, with very similar LADs
featuring in the top 10 for both DHBS and CVD and DHBS.
The spatial pattern for the 10 LADs with the lowest prevalence rates appears
clearer than for the 10 highest. The vast majority of LADs are prosperous authorities
located in southern England, but there are also some London boroughs reporting low
prevalence rates. The very diverse and cosmopolitan nature of these boroughs can
lead to divergence in the expected outcomes for some morbidity conditions. A case in
point is the London borough of Southwark which has the lowest estimated prevalence
rate for RI and a low prevalence for CVD. Southwark is an authority with a large black
African and Caribbean population (in the 2011 Census, these ethnic groups make up
17% of the 50 and older population). The HSCIC report (2005) shows that illnesses of
the heart and circulatory and respiratory systems are lower for these ethnic groups
than for the general population. In other Cosmopolitan London boroughs with a very
different ethnic mix (say a larger south Asian population), a different prevalence profile
is relevant and this is borne out by an inspection of the top 10 prevalence rates in
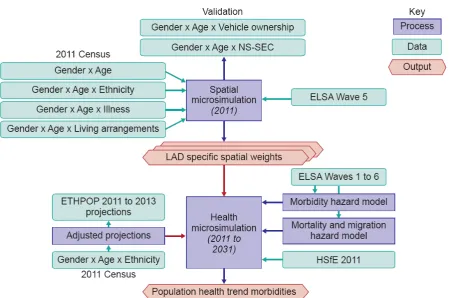
23.5 Prediction framework
The framework for producing predictions of these prevalence rates is shown in Figure
23.1. The top half of this figure, the spatial microsimulation to estimate a base 2011
[image:12.595.74.525.197.495.2]population of individuals in each English LAD, has already been described.
Figure 23.1 The framework for predicting future numbers of people with particular
morbidities
Future ethnic composition
In projecting the morbidity status of the population into the future, it is necessary to
take account of the demographic composition of the population. The composition of
the 50 and older population in each LAD will be influenced by those turning 50 years
of age each year, those who die and those who migrate in and out of the LAD. In this
framework these population dynamics are captured by use of an external population
projection. The ONS provides population projections that estimate the size of the
population in each LAD by gender and single year of age but include no other
projections that provide an additional ethnic breakdown of these populations (Rees et
al., 2011; 2012; 2013). These ETHPOP projections are based on information collected
in the 2001 Census and subsequent vital statistics on births, death and migration up
to 2008, but crucially the projections preceded the 2011 Census. When 2011 Census
counts were published, a comparison of the ETHPOP projected population for 2011
with the 2011 Census population indicated a need for revision of the projections (Rees
et al., forthcoming). For this study, the ETHPOP projections were updated using a
methodology based on that described in Rees and Clark (2014). The steps were:
Step 1. Re-base projections to 2011 Census counts. Step 2. Utilise subsequent ETHPOP cohort projections.
Step 3. Incorporate a projection adjustment factor based on 2001 to 2011 performance.
Step 4. Constrain the population by gender and age to ONS 2012 subnational mid-year population projections.
The annual projection adjustment factor is calculated from:
Yearly adjustment = 2011 Census2001 Census 2011 ETHPOP 2001 ETHPOP
1 10
(23.1)
where ‘2001 Census’ is the ethnic specific count of the older population in the LAD
from the 2001 Census (Table S101); ‘2011 Census’ is the ethnic specific count of the
older population in the LAD from the 2011 Census (Table DC2101); ‘2001 ETHPOP’
is the mean of the TREND-EF and UPTAP-ER 2001 projections of the older population
in the LAD from ETHPOP; and ‘2011 ETHPOP‘ is the mean of the TREND-EF and
UPTAP-ER 2011 projection of the older population in the LAD from ETHPOP.
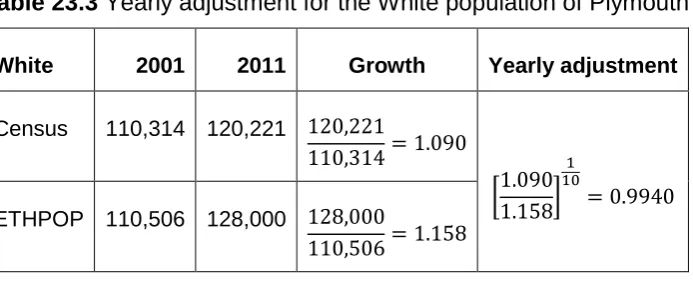
This annual adjustment factor captures how the ETHPOP projection needs to
be adjusted to reproduce the 2011 outcome (see Table 23.3 for an example). Where
the counts are small numbers (which is possible for LADs with small ethnic minority
populations), the range of this adjustment is controlled to lie within an empirically
derived credible interval calculated on the annual projection adjustments used in other
Table 23.3 Yearly adjustment for the White population of Plymouth
White 2001 2011 Growth Yearly adjustment
Census 110,314 120,221
ETHPOP 110,506 128,000
Sources:2001 Census data from table S101; 2011 Census data from table DC2101; ETHPOP data from www.ethpop.org
Dynamic microsimulation
Given an estimated 2011 based population for each LAD and an indication of the
future composition of its population in terms of gender, age and ethnicity, the next
stage is to evolve this population over the medium term, here to 2031. This is achieved
through the following processes:
(i) Age the population by two years. The dynamic microsimulation works in steps of
two years (the time interval between ELSA waves).
(ii) Replenish the population at younger ages. As the population ages, the lower age
range in each LAD will increase. This necessitates the creation of a population of ‘replenishers’ at ages 50 and 51 at each time step.
(iii) Update the morbidity status of individuals. This is achieved using hazard models
estimated using ELSA data to predict if an individual will develop a morbidity based
on their gender, age, ethnicity, smoking status, presence of a co-morbidity, place
of residence and time. This probability of occurrence is converted into an actual
occurrence using a Monte Carlo approach.
(iv) The structure of the population is adapted to conform to the revised ETHPOP
projections for the LAD.
The result of this dynamic microsimulation in terms of the prevalence counts
and rates for the English population is shown in Table 23.4. For CVD, the count of
those with the morbidity falls by 1 million over the 20-year time period and
consequently the prevalence rate halves. This result is driven by changes in lifestyle,
occupation and medical advances, e.g. the use of statins to lower cholesterol (Law et
the rate increases by 2%. The main drivers behind this are poor diet, lack of exercise
(which impacts on obesity) and an ageing of the (now) middle aged south Asian
population into our 50 year and older age range. With respiratory illness, the count
remains largely static over time but because of a larger population at risk, the rate
decreases. The reason for this is almost certainly the reduced prevalence of smoking
in the population in future years but may also be influenced by changes in occupations.
The number with the comorbidity of CVD and DHBS falls by a modest 200,000 and
the prevalence rate reduces by half, a consequence of the fall in the prevalence of
CVD.
Table 23.4 The numbers and percentages of people aged 50 and older with CVD,
DHBS, RI and CVD and DBHS combined, England, 2011 to 2031
The national trends shown in Table 23.4 are simply aggregates of the results
for each English LAD. The results for each English LAD in 2031 are shown in Figure
23.2. This figure represents the prevalence counts as circles, with the area of the circle
being proportional to the number of people estimated to have the morbidity, whilst the
shading indicates the prevalence rate for the LAD. One distinct pattern in the DHBS
map is high prevalence rates in LADs located in West Yorkshire, Greater Manchester,
the West Midlands and London plus Derby, Nottingham and Leicester. These are all
authorities with large BME communities in 2011 and the size of 50 and older population
Figure 23.2 Prevalence and number of individuals with morbidities, LADs, England,
2031
23.6 Conclusions
Access to the 2011 Census tabulations has provided a vital component in the dynamic
simulation used to project to 2031 the prevalence counts and rates for three important
co-variates associated with these morbidities at a useful geographic scale. However, they
are not sufficient. A further data set, the ELSA, is needed to provide additional details
on specific health outcomes, in this instance the case study morbidities. The census
counts from 2001 and 2011 are also useful to provide a trend in the changing size and
composition of the elderly population, particularly in terms of its ethnicity.
Looking at the outcomes of this study, the predicted downward trend in the
morbidity for CVD agrees with recent experience (McCulloch, 2012). The hotspots for
DHBS prevalence are located in areas where the ethnic composition of the population
is such that high prevalence rates would be expected. Changes in smoking behaviour
and exposure to toxins in the workplace are stabilising numbers with respiratory illness
leading a fall in the prevalence rates.
This framework for analysis and prediction is transferable to other countries that
have access to the same types of data, i.e. census or administrative data to provide
the detail about the whole population and a sample survey to provide the detail for the
domain of interest, such as health.
Acknowledgements
The funding for this study has been provided by the Economic and Social Science
Research Council as part of the National Centre for Research Methods initiative. ELSA
was developed by a team of researchers based at the National Centre for Social
Research, University College London and the Institute for Fiscal Studies. The data
were collected by the National Centre for Social Research. The funding is provided by
the National Institute of Aging in the United States, and a consortium of UK
government departments coordinated by the Office for National Statistics. The data
were made available through the UK Data Archive. The developers and funders of
ELSA and the Archive do not bear any responsibility for the analyses or interpretations
presented here. All Census materials are Crown copyright and reproduced with the
permission of the Controller of HMSO.
References
Alemayehu, B. and Warner, K.E. (2004) The lifetime distribution of health care costs. Health Service Research, 39(3): 627-642.
University of Essex. Available at http://opendepot.org/166/1/CWP-2007-07-Income-Deprivation-England.pdf
Brailsford, S.C. (2007) Tutorial: Advances and challenges in healthcare simulation modelling. In Biller, S.G., Hsieh, B., Shortle, M.H., Tew, JD and Barton, R.R. (eds.) Proceedings of the 2007 Winter Simulation Conference, Curran Associates Inc., Washington DC. Available at:
http://ieeexplore.ieee.org/stamp/stamp.jsp?arnumber=4419754
Brailsford, S.C., Harper, P.R., Patel, B. and Pitt, M. (2009) An analysis of the academic literature on simulation and modelling in health care. Journal of Simulation, 3: 130-140.
Brown, L. (2011) Editorial Special Issue on 'Health and Microsimulation'. International Journal of Microsimulation, 4(3): 1-2.
Christensen, K., Doblhammer, G., Rau, R. and Vaupel, J.W. (2009) Ageing populations: The challenges ahead. Lancet, 374: 1196-1208.
Clark, S.D. Birkin, M. and Heppenstall, A.J. (2014) Sub-regional estimates of morbidities in the English elderly population. Health and Place, 27: 176-185.
Craig, R. and Mindell, J. (2005) Health Survey for England. The health of older people
Summary of key findings. Available at:
http://www.ic.nhs.uk/webfiles/publications/hseolder/HSESummary.pdf.
Denton, FT, Gafni, A and Spencer, BG (2002). Exploring the effects of population change on the costs of physician services. Journal of Health Economics, Vol 21, pp781–803
Edwards, K.L., Clarke, G.P., Thomas, J. and Forman, D. (2011) Internal and external validation of spatial microsimulation models: Small area estimates of adult obesity. Applied Spatial Analysis and Policy, 4(4): 281-300.
European Commission (2014) The 2015 Ageing Report. Underlying Assumptions and Projection Methodologies. European Economy 8. Available at http://ec.europa.eu/economy_finance/publications/european_economy/2014/pdf/e e8_en.pdf
Harland, K. (2013). Microsimulation model user guide. Flexible Modelling Framework. National Centre for Research Methods Working Paper 06/13. Available at: http://eprints.ncrm.ac.uk/3177/2/microsimulation_model.pdf
HSCIC (2005) Health Survey for England 2004: The Health of Minority Ethnic Groups – Headline Tables. Health and Social Care Information Centre. Available at: http://digital.nhs.uk/catalogue/PUB01209/heal-surv-hea-eth-min-hea-tab-eng-2004-rep.pdf
Hermes, K. and Poulsen, M. (2012) A review of current methods to generate synthetic spatial microdata using reweighting and future directions. Computers, Environment and Urban Systems, 36: 281-290.
House of Lords (2013) Ready for Ageing? House of Lords Select Committee Report. Available at: http://www.parliament.uk/business/committees/committees-a-z/lords-select/public-services-committee/report-ready-for-ageing/
Joint Health Surveys Unit (2012) Health Survey for England – Trend Tables. Available
at:
https://catalogue.ic.nhs.uk/publications/public-health/surveys/heal-survey-eng-2011-tren-tabl/HSE2011-Trend-commentary.pdf
Laurence, J. (2002) Why an ageing population is the greatest threat to society. The Independent. Wednesday 10th April.. Available at: http://www.independent.co.uk/news/uk/home-news/why-an-ageing-population-is-the-greatest-threat-to-society-5361944.html
Law, M.R., Wald, N.J. and Rudnicka, A.R. (2003) Quantifying effect of statins on low density lipoprotein cholesterol, ischaemic heart disease, and stroke: systematic review and meta-analysis. British Medical Journal, 326: 1423-1429.
Lymer, S., Brown, L., Harding, A. and Yap, M. (2009). Predicting the need for aged care services at the small area level: The CAREMOD spatial microsimulation model. International Journal of Microsimulation, 2(2): 27-42.
Lubitz, J, Cai, L, Kramarow, E and Lentzner, H (2003) Health, life expectancy and health care spending among the elderly. New England Journal of Medicine, 349(11): 1048-1055.
McCulloch, A. (2011) Health Service funding. Available at: https://web.archive.org/web/20140830000806/http://www.significancemagazine.or
g/details/webexclusive/1385441/Health-Service-funding.html
McCulloch, A. (2012) Standardising death. Available at: https://web.archive.org/web/20140830000930/http://www.significancemagazine.or
g/details/webexclusive/1501135/Standardising-Death.html
de Meijer C., Koopmanschapa, M., d'Uvac, T.B. and van Doorslaera, E. (2011) Determinants of long-term care spending: Age, time to death or disability? Journal of Health Economics, 30(2): 425-438.
ONS (2003) National Statistics 2001 Area Classification. Office for National Statistics. Available at: http://www.ons.gov.uk/ons/guide-method/geography/products/area-classifications/ns-area-classifications/index/index.html
ONS (2010) Final recommended questions for the 2011 Census in England and Wales Health. Office for National Statistics. Available at: http://www.ons.gov.uk/ons/guide-
method/census/2011/the-2011-census/2011-census-questionnaire- content/question-and-content-recommendations/final-recommended-questions-2011---health.pdf
ONS (2014a) Deaths Registered in England and Wales (Series DR), 2013. Statistical Bulletin. Available at : http://www.ons.gov.uk/ons/dcp171778_381807.pdf and see http://www.ons.gov.uk/ons/rel/vsob1/mortality-statistics--deaths-registered-in-
england-and-wales--series-dr-/2013/stb-deaths-registered-in-england-and-wales-in-2013-by-cause.html for the associated data.
ONS (2014b) Methodology: 2012-based Sub national Population Projection. Office for National Statistics. Available at: http://www.ons.gov.uk/ons/rel/snpp/sub-national-
population-projections/2012-based-projections/rpt-snpp-2012-based-methodology-report.html
http://www.ons.gov.uk/ons/rel/npp/national- population-projections/2014-based-projections/stb-npp-2014-based-projections.html
Rechel, B., Doyle, Y., Grundy, E. and McKee, M. (2009) How can health systems respond to population ageing? Health Systems and Policy Analysis. World Health Organization, on behalf of the European Observatory on Health Systems and
Policies. Available at:
http://www.observatorysummerschool.org/materiale2011/113/policy_brief_10_agin g_web.pdf.
Rees, P. and Clark, S. (2014) The Projection of Ethnic Group Populations Aged 18 and Over for Westminster Parliamentary Constituencies in Great Britain for Election Years 2015, 2020, 2025, 2030 and 2035. A Report to the Policy Exchange, London.
Rees, P., Wohland, P., Norman, P. and Boden, P. (2011). A local analysis of ethnic group population trends and projections for the UK. Journal of Population Research, 28(2-3): 149-183.
Rees, P., Wohland, P., Norman, P. and Boden, P. (2012) Ethnic population projections for the UK, 2001-2051, Journal of Population Research, 29(1): 45-89.
Rees, P., Wohland, P. and Norman, P. (2013) The demographic drivers of future ethnic group populations for UK local Areas 2001-2051. Geographical Journal, 179(1): 44-60.
Rees, P., Wohland, P., and Norman, P. (forthcoming) The United Kingdom’s multi -ethnic future: how fast is it arriving? In Lombard, J., Stern, E. and Clarke G.P. (ed.) Applied Spatial Modelling and Planning, Routledge, London.
Rose, D., Pevalin, D.J. and O‘Reilly, K. (2005) The National Statistics Socio-economic Classification: Origins, Development and Use. Institute for Social and Economic Research University of Essex. Available at: http://www.ons.gov.uk/ons/guide- method/classifications/archived-standard-classifications/soc-and-sec-archive/the- national-statistics-socio-economic-classification--origins--development-and-use.pdf.
Rutherford, T. (2011) Population ageing: statistics. House of Commons Library Standard Note: SN/SG/3228. Available at: www.parliament.uk/briefing-papers/SN03228.pdf
Seshamani, M and Gray, A (2004). Ageing and health-care expenditure: the red herring argument revisited. Health Economics, Vol 13, pp303-314.
Shulman, H., Birkin, M., Clarke, G.P. (2015) A comparison of small-area hospitalisation rates, estimated morbidity and hospital access. Health & Place, 36: 134-144.
Singer, J.D. and Willett, J.B. (2003) Applied Longitudinal Data Analysis. Oxford: Oxford University Press.
Smith, D., Pearce, J.R. and Harland, K. (2011). Can a deterministic spatial microsimulation model provide reliable small-area estimates of health behaviours? An example of smoking prevalence in New Zealand. Health and Place, 17: 618-624.
comparison with 1991. Journal of the Royal Statistical Society: Series A, 170(2): 425-445.
Voas, D. and Williamson, P. (2000) An evaluation of the combinatorial optimisation approach to the creation of synthetic microdata, International Journal of Population Geography, 6(5): 349-366.
Wanless, D. (2004) Securing our Future Health: Taking a Long-Term View. Final
Report. HM Treasury, London. Available at:
http://webarchive.nationalarchives.gov.uk/+/http://www.hm-treasury.gov.uk/consult_wanless_final.htm.
Table 23.2Highest and lowest LADs for prevalence of CVD, DHBS, RI or CVD and RI combined, England, 2011
Rank Cardiovascular disease (CVD) % Diabetes or high blood sugar (DHBS) % Respiratory illness (RI) % CVD and DHBS combined %
TEN HIGHEST LADs
1 Leicester (CI) 18.9 Newham (LC2) 17.3 Leicester (CI) 22.2 Newham (LC) 7.3
2 Tendring (CC) 18.1 Brent (LC2) 17.1 Tower Hamlets (LC) 22.0 Leicester (CI) 7.2
3 Sandwell (CI) 18.0 Leicester (CI) 16.4 Newham (LC2) 21.3 Tower Hamlets (LC) 7.1
4 Tower Hamlets (LC) 18.0 Tower Hamlets (LC) 16.4 Sandwell (CI) 20.9 Brent (LC) 6.6
5 Eastbourne (RC) 18.0 Harrow (LS) 15.6 Wolverhampton (CI) 20.9 Harrow (LS) 6.2
6 Wolverhampton (CI) 17.9 Slough (LS) 15.5 Blackburn with Darwen (CI) 20.8 Hounslow (LS) 6.1
7 Rother (CC) 17.9 Hackney (LC2) 15.5 Knowsley (IH) 20.7 Ealing (LS) 6.1
8 Christchurch (CC) 17.9 Ealing (LS) 15.4 Hounslow (LS) 20.7 Slough (LS) 6.1
9 Thanet (CC) 17.8 Hounslow (LS) 15.3 Birmingham (CI) 20.6 Redbridge (LS) 5.9
10 Wyre (CC) 17.6 Redbridge (LS) 15.2 Slough (LS) 20.6 Manchester (CI) 5.6
TEN LOWEST LADs
315 South Northamptonshire (PST) 13.6 Elmbridge (PSE) 10.5 Surrey Heath (PSE) 17.1 South Hams (CC) 3.3
316 Daventry (PST) 13.6 Stroud (PST) 10.5 South Northamptonshire (PST) 17.1 South Cambridgeshire (PSE) 3.3
317 Basingstoke and Deane (PSE) 13.5 Bracknell Forest (PSE) 10.5 Waverley (PSE) 17.1 Bracknell Forest (PSE) 3.3
318 Milton Keynes (NGT) 13.4 South Northamptonshire (PST) 10.5 Mid Sussex (PSE) 17.0 Guildford (PSE) 3.3
319 Lambeth (LC2) 13.4 Wokingham (PSE) 10.5 Guildford (PSE) 17.0 South Northamptonshire (PST) 3.3
320 Southwark (LC2) 13.3 Uttlesford (PSE) 10.4 Kensington and Chelsea (LC) 16.9 Basingstoke and Deane (PSE) 3.3
321 Hart (PSE) 13.3 Chiltern (PSE) 10.4 Hart (PSE) 16.9 East Hertfordshire (PSE) 3.2
322 West Berkshire (PSE) 13.2 Mid Sussex (PSE) 10.4 Rutland (PST) 16.8 West Berkshire (PSE) 3.2
323 Wokingham (PSE) 13.2 East Hertfordshire (PSE) 10.4 Tandridge (PSE) 16.8 Surrey Heath (PSE) 3.2
324 Bracknell Forest (PSE) 13.1 West Berkshire (PSE) 10.3 Southwark (LC2) 16.8 Hart (PSE) 3.1
Notes: CI = Centres with Industry; CC = Coastal and Countryside; LC = London Centre; RC = Regional Centres; PST = Prospering Smaller Towns; PSE = Prospering Southern England; NGT = New and Growing Towns; LC2 = London Cosmopolitan; LS = London Suburbs; IH = Industrial Hinterlands
Table 23.4 The numbers and percentages of people aged 50 and older with CVD, DHBS, RI and CVD & DBHS combined, England,
2011 to 2031
Year Population aged 50 and older
Cardiovascular disease (CVD)
Diabetes or high blood sugar (DHBS)
Respiratory illness (RI)
CVD & DHBS combined
Number Number % Number % Number % Number %
2011 18,229,893 2,873,694 15.8 2,189,938 12.0 3,408,810 18.7 748,821 4.1
2013 18,964,704 2,803,706 14.8 2,424,851 12.8 3,396,242 17.9 746,541 3.9
2015 19,689,593 2,737,698 13.9 2,656,947 13.5 3,469,615 17.6 751,172 3.8
2017 20,400,332 2,634,641 12.9 2,834,345 13.9 3,495,865 17.1 733,176 3.6
2019 21,083,429 2,531,619 12.0 2,979,780 14.1 3,490,010 16.6 708,491 3.4
2021 21,732,680 2,451,228 11.3 3,128,636 14.4 3,562,378 16.4 696,057 3.2
2023 22,304,919 2,292,377 10.3 3,191,523 14.3 3,477,186 15.6 648,791 2.9
2025 22,755,033 2,207,095 9.7 3,300,025 14.5 3,482,338 15.3 630,625 2.8
2027 23,129,460 2,076,336 9.0 3,358,974 14.5 3,439,145 14.9 592,600 2.6
2029 23,539,913 1,943,832 8.3 3,386,244 14.4 3,366,595 14.3 552,603 2.3