This is a repository copy of
Control of the porous structure of polystyrene particles
obtained by nonsolvent induced phase separation
.
White Rose Research Online URL for this paper:
http://eprints.whiterose.ac.uk/123865/
Version: Accepted Version
Article:
Bianco, A. orcid.org/0000-0002-6125-6339, Burg, S.L., Parnell, A.J.
orcid.org/0000-0001-8606-8644 et al. (7 more authors) (2017) Control of the porous
structure of polystyrene particles obtained by nonsolvent induced phase separation.
Langmuir. ISSN 0743-7463
https://doi.org/10.1021/acs.langmuir.7b02802
This document is the Accepted Manuscript version of a Published Work that appeared in
final form in Langmuir, copyright © American Chemical Society after peer review and
technical editing by the publisher. To access the final edited and published work see
http://pubs.acs.org/doi/10.1021/acs.langmuir.7b02802
eprints@whiterose.ac.uk https://eprints.whiterose.ac.uk/
Reuse
Items deposited in White Rose Research Online are protected by copyright, with all rights reserved unless indicated otherwise. They may be downloaded and/or printed for private study, or other acts as permitted by national copyright laws. The publisher or other rights holders may allow further reproduction and re-use of the full text version. This is indicated by the licence information on the White Rose Research Online record for the item.
Takedown
If you consider content in White Rose Research Online to be in breach of UK law, please notify us by
1
CONTROL
OF
THE
POROUS
STRUCTURE
OF
POLYSTYRENE
PARTICLES
OBTAINED
BY
NON-SOLVENT INDUCED PHASE SEPARATION
Antonino Bianco
1,2, Stephanie L. Burg
3, Andrew J. Parnell
3, Christine M. Fernyhough
2,
Adam L. Washington
3, Christopher J. Hill
4, Patrick J. Smith
2, David M. Whittaker
3,
Oleksandr O. Mykhaylyk
1, J. Patrick. A. Fairclough
2.
[1] Department of Chemistry, The University of Sheffield, S3 7HF, UK.
[2] Department of Mechanical Engineering, The University of Sheffield, S3 7HQ, UK. [3] Department of Physics and Astronomy, The University of Sheffield, S3 7RH, UK.
[4] Department of Biomedical Science, The University of Sheffield, S10 2TN, UK.
KEY WORDS.
Non-solvent induced phase separation, porous particles, zero shear viscosity, polystyrene.
ABSTRACT. Porous polystyrene micro-spheres were produced by a process of non-solvent induced phase
separation (NIPS) from ternary polymer-solvent-non solvent (polystyrene-toluene-ethanol) systems and
characterised by scanning electron microscopy (SEM) and small angle X-ray scattering (SAXS) techniques.
This study provides evidence for a link between the structural morphology of the porous polystyrene particles
and the polystyrene concentration in the initial solutions. A reciprocal relationship between pore diameter
and polymer concentration was observed for the systems with the polymer amount below the critical chain
overlap concentration, C*. Above C* this relationship breaks down. The reciprocal relationship between
porosity and polymer concentration can be used to facilitate the fine control of the voids size. We
demonstrate that the observed reciprocal relationship between pore diameter and polymer concentration
correlates well with the relative amount of non-solvent present in the system at the onset of the phase
separation process. The pore size can be reduced and, consequently, the pore surface area can be increased
either by reducing the polymer concentration in the initial solution or by decreasing the polymer molecular
2
INTRODUCTION.Porous polymer structures are of great interest due to their application in many industrial areas, from the
preparation of filtration systems,1,2 to their use as tissue scaffolds,3,4,5 carriers for catalysts,6 adsorbents for
heavy metal removal from aqueous solutions7 and for controlled drug release,8 to cite a few.
Porosity may be achieved in different classes of structures, such as large monoliths,1 thin membranes9 or
micro-spheres.10 There are a number of synthetic methods for producing organic porous materials.11,2 In
particular, porous polymers can be obtained by exploiting the process of phase separation of an initially
homogeneous polymer solution.12 Phase separation takes place when there is an increase in the Gibbs free
energy of the system. This favours the de-mixing of the polymer solution, which can be induced by a change
in temperature (thermally induced phase separation, TIPS) or by the introduction of a non-solvent
(non-solvent induced phase separation, NIPS).13,14 The latter is the focus of this study.
Research on polycarbonate NIPS to manufacture porous monoliths, highlighted the impact of different
molecular weights and polymer concentrations on the final morphology achieved.1 Polycarbonate polymers of
different molecular weights were dissolved in chloroform, with cyclohexane acting as the non-solvent to
induce phase separation.1
This study showed empirical correlations in the pore size from increasing polymer molecular weight, the
non-solvent ratio, reduction in temperature, all causing a decrease in the pore size. The authors explained
this dependence with the viscosity of the systems, as they suggested that the viscosity would strongly affect
the phase separation process and the resulting void size.1
The importance of the specific solvent for achieving a set pore morphology has also been examined.15 Two
NIPS systems based on poly-(methyl methacrylate), with either N,N-dimethylformamide (DMF) or acetone
as the solvent, and water as the non-solvent, were studied.15
The DMF system corresponded to a rapid de-mixing of the polymer solution, due to the water having high
affinity for DMF. In the acetone system a delayed de-mixing occurred, due to water having a lower affinity for
3
As a result of the different affinities between solvent and non-solvent, and therefore different exchange ratesbetween them, different pore morphologies were observed: elongated pores were achieved for membranes
produced with DMF, while spherical pores were observed in membranes with acetone.15
A combination of both TIPS and NIPS has been used to produce porous micro-granules of polystyrene.7 In
this instance the polymer was dissolved in cyclohexane and heated to a temperature in the range of 50-60 °C.
An emulsion of this solution was formed by dispersing the solution in water, and stabilised by a surfactant.
This emulsion was then mixed with the non-solvent ethanol at 0 °C. The concentration of polystyrene in
solution, affecting the viscosity of the system and the solvent-non solvent exchange rate, was found to have a
major impact on the morphology of the polystyrene structures.7
Low concentration solutions of polystyrene favoured the formation of polymer nuclei with low porosity. An
intermediate polystyrene concentration favoured a continuous network morphology within the particles,
whilst high polystyrene concentrations produced spherical micro-granules with large internal cavities.7
Due to the broad range of porous structures that can be achieved, phase separation of a homogeneous
polymer solutions is a widely studied process which can be understood thermodynamically.13 However, the
kinetics of the process also plays an important role.
The Gibbs energy of mixing in a polymer-solvent system is described by the Flory-Huggins equation:13
ln ln ) (1)
where is the gas constant, is the temperature, is the number of moles of polymer, is the number of
moles of the solvent, is the volume fraction of the polymer, is the volume fraction of the solvent, is
the Flory-Huggins interaction parameter between the polymer and the solvent which can be approximated
as:13
(2)
where is the reference molar volume, usually of the solvent, and are the solubility parameters for
4
Upon the introduction of a third component, the non-solvent, the equation (1), corresponding to a binarysystem, is modified with extra terms describing the effect of the non-solvent in order to express the Gibbs
energy of mixing of the ternary system comprising polymer, solvent and non-solvent:13
ln ln ln ) (3)
where refers to the number of moles of the non-solvent, to the volume fraction of the non-solvent,
is the interaction parameter for the solvent-non solvent and is the interaction parameter for the
polymer-non solvent.13 Thus the thermodynamic driving force during NIPS is related to the interaction parameters and
the component concentrations.
The phase separation of the homogeneous polymer solution takes place when the free energy of a two-phase
system is lower than the free energy of the corresponding single-phase system. The de-mixing produces
polymer-rich and polymer-poor phases that result in a polymer matrix with internal porosity.1213 In practice
the thermodynamics of phase separation is intrinsically linked with the kinetics of solvent exchange. As the
solvent is replaced by the non-solvent, a concentration wave sweeps through the system. At one side the
system is thermodynamically stable, at the other the system undergoes phase separation.16 At some point in
the phase separation the structure within the system is pinned and motion is arrested. This arrest of motion
can be due to a glass transition temperature, crystallisation or hydrogen bonding. This arrest ultimately
controls the final structure observed experimentally. The rate of solvent mixing is high because of the high
mobility of the solvent molecules in the polymer matrix (analogous to cyclist in traffic): the majority of the
small solvent molecules are not constrained and can move freely in the swollen polymer. However, the
polymer is restricted by interactions with itself or other polymer molecules.
Thus, every ternary system has a characteristic phase separation behaviour that is related to factors such as
the Flory-Huggins interaction parameter, the polymer molecular weight and polymer concentration, solvent
5
A numerical method was developed for the construction of ternary phase diagrams based on theFlory-Huggins theory.17,18 By taking into consideration binary interaction parameters, ternary phase diagrams
describing the behaviour of polymer-solvent-non solvent systems at a given temperature were constructed.17
One of the ternary systems investigated was a cellulose acetate, dioxane, water system. The theoretical
position for the binodal line was compared to the experimentally determined binodal, obtained by cloud
point measurements of the system at different polymer concentrations and temperatures.
It was found that the experimentally determined binodals for cellulose acetate with Mw between 9 and 30 kg
mol-1 obtained by cloud point measurements at 20 °C and at 60 °C were in reasonably good agreement with
the theoretical binodal predicted by the numerical model.17
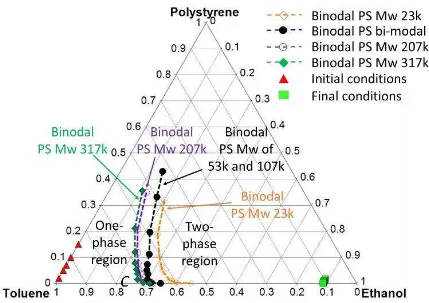
[image:6.595.105.483.355.628.2]The behaviour of a ternary system can be generalised by a comprehensive phase diagram (Figure 1).19
Figure 1. A generic ternary phase diagram describing the behaviour of a polymer-solvent-non solvent system at a
given temperature. The binodal line marks the boundary between the one-phase region, where the system is a
homogenous solution, and the two-phase region, where the system transforms into a liquid-liquid mixture and
further into a solid-liquid mixture as progressively more non-solvent is added. The upper limit of the binodal is
referred to as the critical point C. The spinodal line, which is the boundary between metastable and unstable zones
6
temperature of the polymer is lower than the temperature of the system. Beyond the B-point phase separationstops and particles morphology is retained. (Re-drawn from Wang et al. 19).
At a given temperature, when non-solvent is added to the polymer solution, the system transitions from the
one-phase region across the binodal line to the two-phase region. This results in the formation of
polymer-poor and polymer-rich regions within the polymer mixture.12 With continuing progress into the non-solvent
quenching regime, either spinodal decomposition or nucleation and growth processes take place and they
arrest at the Berghman s Point B, where the glass transition temperature of the polymer intersects the
temperature of the system.19 The morphology achieved at this stage is thus fixed and observed
experimentally.
In polymer solutions with concentrations above the critical chain overlap concentration C*,20 the mobility
within the system is drastically reduced due to polymer chain entanglement, resulting into a significant
increase in viscosity which may have a pronounced effect on the phase separation of the system prior to
reaching the Berghman s Point20
The main goal of the current study was to investigate the relationship between the initial polymer solution
concentration and the final morphology of the resultant multi-voided polymer particles. Due to its wide
availability, low cost and extensive existing literature, polystyrene was chosen as a model polymer for this
study. Different molecular weights were investigated, including uni-modals and a bi-modal molecular weight
distribution. Polystyrene multi-voided particles were produced by the NIPS process using toluene as the
solvent and ethanol as the non-solvent.
An emulsion process was employed in order to increase the control over particles shape and size, as this
affects the rate of solvent ingress by diffusion. Different morphologies were achieved by varying the
molecular weight of polystyrene and the concentration of the polymer solutions.
The final porous structures achieved were characterised by a combination of scanning electron microscopy
7
MATERIALS AND METHODS.Polystyrene samples with lower, intermediate and higher molecular weights Mw 23, 207 and 317 kg mol-1,
were purchased either from Polymer Source (Montreal, Canada) and Sigma Aldrich (Gillingham, England).
An additional bi-modal polystyrene blend with Mw 53 and 107 kg mol-1 was purchased from Sigma Aldrich,
where it was incorrectly labelled as a 35 kg mol-1 sample. Toluene (Chromasolv HPLC grade 99.9%) and
non-ionic surfactant Sorbitane monooleate (Span 80) were also purchased from Sigma Aldrich; Ethanol (Analar
Normapur) was purchased from VWR Prolabo Chemicals (Hunter Boulevard, England) and deionised water
was obtained from a Milli-Q Millipore water system. All materials were used without further purification.
Multi-voided polystyrene particles were fabricated by an emulsion NIPS process, as illustrated in Figure 2.
Polystyrene pellets were dissolved in toluene at room temperature in order to produce polymer solutions of
the desired weight/weight percentage concentrations (2, 5, 7, 10 and 15% w/w). An amount (2% w/w) of Span
80 non-ionic surfactant was added to the polymer solution and dispersed by magnetic stirring. Water was
added in ratio 2 : 1 w/w to the polymer solution and the mixture was stirred at 1000 rpm for 15 minutes to
form a stable oil in water emulsion. The emulsion was then transferred to a 60 ml syringe connected to a
syringe pump. The flow rate was set to 100 ml/hr in order to deliver the emulsion to a stirring bath of the
non-solvent ethanol. The ratio of emulsion to non-solvent was kept close to 1 : 10 w/w for all the samples (this
ratio refers to the final state of the system, when all the emulsion has been transferred to the non-solvent
bath). The precipitated polystyrene micro-spheres were isolated from the mixture by vacuum filtration and
left to dry in a fume cupboard to remove solvent. The samples prepared are named in terms of the
polystyrene molecular weights and polystyrene concentrations in the polymer solutions. For example, the
products prepared with polystyrene Mw 23 kg mol-1 at 2% w/w concentration and Mw 207 kg mol-1 at 5% w/w
8
Figure 2. The process of non-solvent induced phase separation (NIPS). Polystyrene in the form of pellets isdissolved in toluene at room temperature in order to produce a polymer solution of desired concentration.
Non-ionic surfactant Span 80 and water are added to the polymer solution in order to form an emulsion upon stirring:
the polymer solution is dispersed in the form of droplets in a continuous phase of water. The emulsion is delivered
dropwise to a bath of ethanol non-solvent. The polystyrene precipitates in the form of porous micro-particles. The
particles are isolated by vacuum filtration and left to dry to remove solvent.
The molecular weight of the various polystyrenes studied was measured by Gel Permeation Chromatography
(GPC) using triple detection with light scattering. The analysis provided a molecular weight Mw of 207,179 g
mol-1 with a polydispersity index of 2.095 for the Mw 207 kg mol-1 sample (Sigma Aldrich, Lot. number
02726DE) and a Mw of 316,573 g mol-1 with a polydispersity index of 2.944 for the Mw 317 kg mol-1 sample
(Sigma Aldrich, Lot. number MKBP1175V). The bi-modal sample (Sigma Aldrich, Lot. number MKBS6957V)
showed two populations of polymer chains with molecular weights Mw of 53,309 and 106,970 g mol-1. The
lower Mw sample, 23 kg mol-1 (Polymer Source, Lot. Number P9397-S) was analysed with a GPC set-up
comprised of two m Mixed-C columns a WellChrom K-2301 refractive index detector operating at 950
nm, THF eluent containing 2% v/v triethylamine and 0.05% w/v butylhydroxytoluene (BHT) with a flow rate
of 1.0 mL min-1, calibrated with standards from Polymer Laboratories (Church Stretton Salop, England). The
analysis provided a molecular weight Mw of 23,092 g mol -1
with a polydispersity index of 1.244. For more
[image:9.595.122.473.76.347.2]9
The droplet size of the emulsions of polystyrene solutions dispersed in water was measured by Dynamic LightScattering (DLS), using a Malvern Zetasizer Nano-S series instrument with 1 ml cuvettes. The instrument was
operated under the following conditions: temperature of 25 °C, detector angle at 90°, incident laser
wavelength of 633 nm. DLS has shown that oil-phase droplet size in the emulsions for all the prepared
samples was in the size range 20-70 µm.
Cloud points measurements for polystyrene, toluene and ethanol systems were determined by turbidimetric
titration method at 25 °C. Ethanol, as non-solvent, was delivered from a burette into continuously stirred
solutions of polystyrene in toluene and the turbidity (cloudiness) of the solutions was visually assessed
throughout the addition.
The viscoelastic properties of polystyrene, toluene and ethanol systems were measured using a rotational
stress-controlled rheometer (Anton Paar, MCR 502) equipped with a cone-and-plate geometry (diameter 50
mm and cone angle 2°) at 25 °C using the continuous shear mode. The dependence of viscosity ( ) on shear
rate ( ) was measured within intervals from 1 to 100 rad s . This range was selected in order to obtain
reliable values of zero shear rate viscosity for solutions at low polystyrene concentration. The viscosity in
this range was independent of shear rate. The zero shear viscosity 0 was extrapolated to = 0. Time sweeps
performed before each run have shown that the effect of solvent evaporation was negligible for the
measurements time used.
Structural morphology of polystyrene multi-voided particles was characterised by SEM, using a Philips XL-20
instrument operating at a voltage of 15 kV. Samples were fractured between microscope glass slides in order
to image their cross-sections, representing internal structural morphology. The samples were then coated
with gold using an Edwards S150B sputter coater. In order to estimate the pore size distribution, the SEM
images were analysed using Image J software (version 1.50d).21,22
SAXS measurements were either performed at a synchrotron source (ESRF, beamline ID02, Grenoble, France)
or using a laboratory SAXS instrument (Xeuss 2.0, Xenocs, France) equipped with liquid gallium MetalJet
10
respectively) and 2D detector (Rayonix MX-170HS CCD or Dectris Pilatus 1M pixel detector, respectively)were used for these experiments. The SAXS camera length was set to cover the q range from 0.01 nm-1 to 1.0
nm-1, where q = 4 sin / is the modulus of the scattering vector and is half of the scattering angle. Glass
capillaries (approximate diameter of 2 mm) were used as a sample holder for the dried polystyrene particles.
X-ray scattering data were reduced (integration and normalization) using standard routines from the
beamline or the software package Foxtrot for the laboratory SAXS instrument. Irena SAS macros23 for Igor
Pro software were utilized for background subtraction and analysed using the Unified fit method.24
RESULTS AND DISCUSSION.
Phase diagram of polystyrene-toluene-ethanol ternary systems.
A ternary phase diagram for the polystyrene, toluene and ethanol systems studied was constructed from
cloud point measurements (Figure 3). Cloud points were determined by turbidimetric titration at 25 °C.
The volume of ethanol required to achieve cloudiness in solutions of different concentrations of polystyrene
were converted into weights. Each point on the ternary diagram (Figure 3) is expressed in weight percentage
of polystyrene, toluene and ethanol.
Linking the cloud points provides information on the position of the binodal, the boundary line that
separates the one-phase region, where the mixture is homogeneous, from the two-phase region, where the
mixture separates into liquid-liquid polymer-rich and polymer-poor regions. With continuing addition of the
non-solvent, the polystyrene precipitates.
The initial condition of the systems, for polystyrene toluene solutions at concentrations of 2, 5, 7, 10 and 15%
w/w lie on the polystyrene-toluene axis of the diagram (Figure 3, filled triangles). Upon the addition of the
non-solvent, the system transfers through the binodal line to the two-phase region, initiating phase
separation. The diagram shows the final configuration of the system (Figure 3, filled squares) where ethanol
is the dominant component and polystyrene is precipitated in the form of solid porous micro-spheres. The
11
weight increases. The obtained phase diagram (Figure 3) is consistent with a generic ternary diagram [image:12.595.72.501.116.419.2]expected for such a system (Figure 1).
Figure 3. A ternary phase diagram showing the evolution of polystyrene-toluene-ethanol systems at 25 °C. From the
initial conditions of polystyrene toluene solutions at PS concentrations of 2, 5, 7, 10 and 15% w/w (triangles) the
system transitions to the final state (squares) upon the addition of ethanol non-solvent. Experimentally determined
binodal lines, obtained from cloud points, are shown for polystyrene molecular weights of 23 (open diamonds), 207
(open circles), 317 (full diamonds) and bi-modal blend of 53 and 107 (full circles) kg mol-1, marking the boundary
between one-phase and two-phase regions. The cloud points were measured up to 40% w/w for PS Mw 23, 207, 317
kg mol-1 and 50% w/w for PS bi-modal blend. Beyond these concentrations the solutions were too viscous to
perform the analysis. Phase separation occurs when the binodal line is crossed, initially producing a liquid-liquid
mixture with polymer-rich and polymer-poor regions and upon further addition of ethanol a solid-liquid mixture
occurs where polystyrene precipitates.
Critical chain overlap concentration.
The chain overlap concentration C* of a homogeneous polymer solution is defined as the critical
concentration at which polymer coils begin to overlap.25
It is expected that above the critical chain overlap concentration, the mobility of polystyrene systems is
12
The critical chain overlap concentration can be defined as:25(4)
where is the molecular weight of the polymer, is the mean squared radius of gyration of polystyrene in
toluene and is the Avogadro s number.
In order to calculate C* for the polystyrene-toluene systems the values for the radius of gyration Rg of
polystyrene in toluene is required.26 In this respect two approaches have been used (Table 1 and Table 2). The
first approach was based on the values reported in the literature26 (Table 1). The values of Rg chosen for the
calculations were those that were the closest to the molecular weights of the studied polystyrene. It was
found that for the 23 kg mol-1 series the 15% w/w concentration is the only system above C*. For the 207 kg
mol-1 series the 2% w/w concentration is the only system below C* and the 317 kg mol-1 series is entirely above
C*. The bi-modal system is below C* at 2, 5 and 7% and above C* at 15%, while at 10% the short and long
[image:13.595.98.474.558.694.2]chains are below and above C* respectively (Table 1).
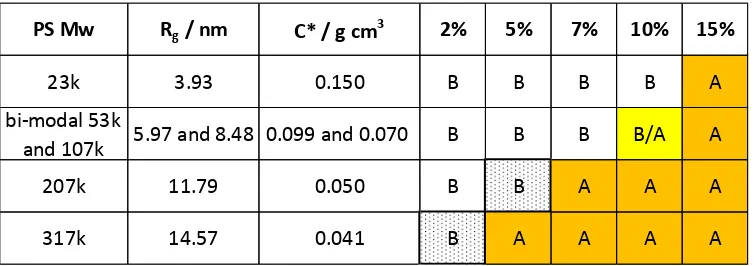
Table 1. Calculations of C* using eq. 4 and experimental values of Rg from literature.26 The systems
with the concentrations above C*, where the phase separation process is kinetically controlled, are
highlighted in orange. B = Below C*, A = Above C*.
The second approach used for the C* calculation is based on the values obtained from the Kuhn length of
polystyrene in a theta-solvent.
PS Mw
R
g/ nm
C* / g cm
32%
5%
7%
10%
15%
23k
4.58
0.096
B
B
B
B
A
bi-modal 53k
and 107k
5.36 and 8.20 0.136 and 0.077
B
B
B
B/A
A
207k
13.40
0.034
B
A
A
A
A
13
In this case is calculated from the relation between the contour length and the Kuhn length:27,28(5)
where is the mean squared radius of gyration of polystyrene, is the Kuhn length of polystyrene (1.67 nm,
as reported in literature28) and is the contour length of polystyrene, defined as:
cos (6)
where is the carbon-carbon bond length of the polystyrene skeleton (0.154 nm), is the tetrahedron angle
(70.53°) and is the number of repeat units in the polymer chain, calculated as molecular weight Mw of
polystyrene divided by the molecular weight Mu of the monomer styrene unit (104.15 g mol-1). Thus, Rg
calculated from equation 5 was used for the C* calculations (equation 4). The results show (Table 1 and Table
2) that both approaches predict a similar behaviour for the studied systems. There is a slight difference
observed for the high molecular weight solutions (Table 2, compositions highlighted by patterned boxes).
Results of the first approach (Table 1) based on literature values were used in the further analysis.
Table 2. C* estimation using the values of Rg calculated from the Kuhn length and the contour
length of polystyrene.28 In the orange boxes the systems with concentrations above the critical chain
overlap concentration, where the phase separation process is kinetically controlled. The
composition demonstrating slight deviations of C* from the previous method (Table 2) are
highlighted by the patterned boxes. B = Below C*, A = Above C*.
PS Mw
R
g/ nm
C* / g cm
32%
5%
7%
10%
15%
23k
3.93
0.150
B
B
B
B
A
bi-modal 53k
and 107k
5.97 and 8.48 0.099 and 0.070
B
B
B
B/A
A
207k
11.79
0.050
B
B
A
A
A
[image:14.595.106.483.611.744.2]14
Viscosity of polystyrene-toluene-ethanol ternary systems:Solutions of polystyrene in toluene at the initial concentrations of 2, 5, 7, 10 and 15% w/w were prepared for
15
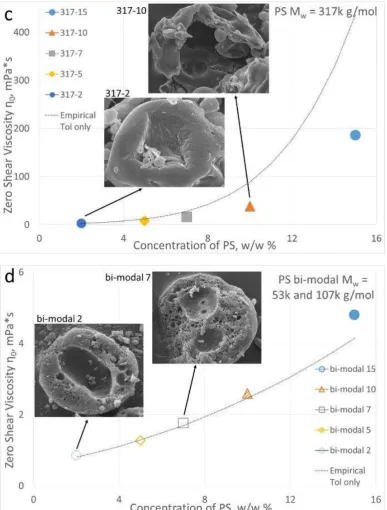
Figure 4. Zero shear viscosity 0 versus polystyrene concentration measured for polymer solutions with Mw = 23 kgmol-1 (a), 207 kg mol-1 (b), 317 kg mol-1 (c) and bi-modal 53 and 107 kg mol-1 (d). Filled symbols represent
concentration above C* where polymer chains entanglement occurs and the phase separation is kinetically
controlled. Open symbols represent concentrations below C*. The hatched symbol for bi-modal indicates that
only the long chains of the bi-modal sample are above C*. The dotted line was obtained using an empirical
16
polystyrene-toluene systems from literature (equation 7)29. The relationship predicts the zero shear viscosity ofpolymer-solvent solutions. Inserts show representative SEM cross-section images of polystyrene particles obtained
from these solutions.
A dotted-line overlapping the experimental data was generated by using an empirical equation from
literature29 that relates the zero shear viscosity
0 of polystyrene-toluene systems to polystyrene molecular
weight Mw and polystyrene concentration C:
(7)
The predicted viscosity is in good agreement with the experimental data for the low molecular weight
polymer and for the high molecular weight polymer at low concentrations. Deviations are observed for the
high molecular weights at higher concentrations.
Structural characterisation of the polystyrene particles by SAXS.
The polystyrene multi-voided particles were characterized by small angle X-ray scattering (SAXS). This
allowed us to determine the mean pore diameter for a large number of particles and pores and as such is
complementary to SEM. Scattered intensity of nanoscale structural objects at large q should follow a power
law dependence:30
(8)
where P is the power-law exponent. In the particular case, when P = 4, eq. 8 corresponds to Porod's law,
describing scattering from a two-phase system with sharp interfaces. It is expected that the studied
polystyrene multi-voided particles in air correspond to a typical two-phase polymer-air system having sharp
distinct interfaces. Indeed it was found that SAXS patterns of these particles obey Porod's law at large q
17
(9)
where I is the relative scattered intensity, Iv is the absolute scattered intensity, V is the sample volume
irradiated by X-rays, SLD is the contrast corresponding to a difference between scattering length densities
of the two phases, Sv is the total surface area per unit volume and Bv is Porod s constant per unit volume of
the material. Another parameter to be considered in SAXS analysis of the system is the invariant. When
expressed on an absolute scale the invariant is defined as the total scattering power of the sample per unit
volume, calculated by integrating the absolute scattered intensity over the entire reciprocal space:30 31
(10)
with being the volume fraction occupied by the air.
A relative Porod's constant B (eq 9) and the relative invariant Q (eq 10) can be used to calculate Sv:30 31
(11)
It should be noted that absolute intensity calibration of scattering patterns is not required for this calculation
as only the ratio B/Q, excluding irradiated sample volume, is used in eq 11.
The air volume fraction (dominated by the pore volume fraction of the voided polystyrene particles) can be
estimated knowing the density of polystyrene s, the density of air p and the packing density of the particles
in the sample volume sam, measured as mass of the sample divided by the volume occupied:30
(12)
The volume fraction occupied by polystyrene is the remaining volume:30
18
Using the values for the surface area Sv and the pore and structural volume fractions and of thesamples, it is possible to determine the pore chord lp defined as the average length of the void domains:
30
(14)
The B/Q ratio required for Sv and chord length calculations were obtained from SAXS patterns (Figure 5)
using a one-level model of the unified approach24 implemented in Irena SAXS macros.23
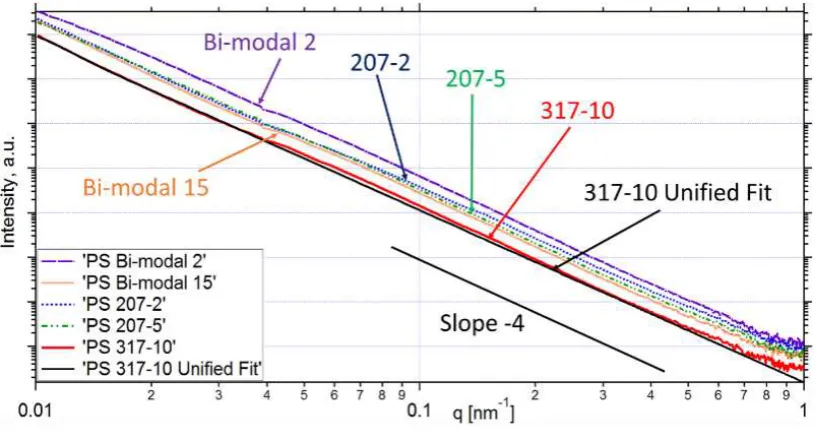
Figure 5. Representative SAXS patterns of polystyrene multi-voided particles, displayed in a double logarithmic
format,acquired at the ID02 beamline. The patterns were fitted using a one-level model of the unified approach
implemented in Irena SAXS macros for Igor Pro software. It was assumed for the model that at high q, I(q) q-4.
The solid black line shows an ideal fit using the unified approach. The slope -4 line is given for guidance.
The results of SAXS analysis (Table 3) show that the surface area of the polystyrene particles ranges from 5.32
m2/cm3 for the sample - with lowest molecular weight (23 kg mol-1) and lowest polystyrene
concentration in toluene (2% w/w) to 0.97 m2/cm3 for the sample - with the highest molecular weight
(317 kg mol-1) and the highest polystyrene concentration in toluene (10% w/w). The results of SAXS analysis
have shown that the pore size lpranges from nm for - to nm for - and the voids volume
[image:19.595.85.494.291.507.2]19
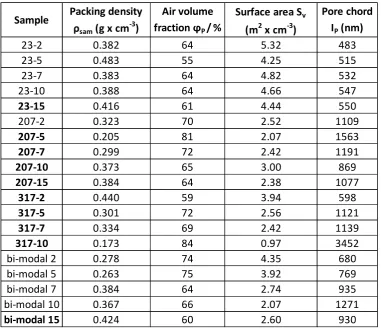
Table 3. Results of the SAXS data analysis: sample packing density ( sam), air volume faction ( p),interface surface area per unit volume (Sv) and pore chord length (lp). The samples above C* are
indicated in bold.
For low molecular weight systems (23 kg mol-1 and bi-modal 53, 107 kg mol-1) below the chain overlap
concentration C*, a correlation between the polymer concentration in the solvent and pore chord can be
identified: an increase in concentration corresponds to an increase in the average diameters of the void
domains and a reduction in surface area.
Sample
Packing density
sam
(g x cm
-3
)
Air volume
fraction
P/
%
Surface area S
v(m
2x cm
-3)
Pore chord
I
P(nm)
23-2
0.382
64
5.32
483
23-5
0.483
55
4.25
515
23-7
0.383
64
4.82
532
23-10
0.388
64
4.66
547
23-15
0.416
61
4.44
550
207-2
0.323
70
2.52
1109
207-5
0.205
81
2.07
1563
207-7
0.299
72
2.42
1191
207-10
0.373
65
3.00
869
207-15
0.384
64
2.38
1077
317-2
0.440
59
3.94
598
317-5
0.301
72
2.56
1121
317-7
0.334
69
2.42
1139
317-10
0.173
84
0.97
3452
bi-modal 2
0.278
74
4.35
680
bi-modal 5
0.263
75
3.92
769
bi-modal 7
0.384
64
2.74
935
bi-modal 10
0.367
66
2.07
1271
[image:20.595.99.481.242.571.2]20
In the systems with higher molecular weight (207 and 317 kg mol-1) this trend is not observed, which is likelyto the fact that the chain entanglement in these samples determines a kinetic dominance of the phase
separation process.
Scanning Electron Microscopy of polystyrene particles.
Polystyrene particles were imaged using SEM and these are shown in Figures 6.
The particles display a spherical shape as they are formed from spherical droplets of polystyrene in toluene
solutions dispersed as an oil-phase within the aqueous emulsions. Their size was comparable with the
droplets size measured by DLS.
The particles presented a smooth external skin with closed internal pores, the result of nucleation and
growth processes during the phase separation. A distribution of pore size within the particles was observed,
with smaller pores located in proximity of the external regions and a large cavity towards the centre. This
pore distribution is a consequence of the phase separation mechanism that starts from the external regions of
the droplets forming the particles smooth skin. Since the surface is quickly frozen by the loss of solvent and
less mobile than the central region, during the solvent loss polystyrene will migrate from the centre to
conserve density. This results in a large central cavity, as shown in the cross section of the sample 23-5
(Figure 6a).
A similar configuration is observed in the cross-section of the sample bi-modal 7 Figure 6b), with small
pores near the outer surface and larger cavities towards the centre. It should be noted that the two
populations of pores observed by SEM were not considered in the SAXS analysis. However, we expect the
effect of these large cavities on the surface area derived from modelling the SAXS to be small. Assuming that
the diameter of the cavities is about 20 times larger than the diameter of small pores (Figure 6a) and that the
volume fraction of both the cavities and the small pores is equal, the cavities would contribute 5% of the total
surface area corresponding to these two populations.
Particles produced by systems with significantly higher molecular weight (317 kg mol-1) and concentration
21
within a relatively thin porous shell This type of structure is clearly observable in the - sample inFigure 6c, where the cross section of the sphere reveals a large empty volume encompassed within a thin layer
of polystyrene. The porosity observed within the thin shell of this particle, presenting a morphology that
22
Figure 6 (a). A cross-section of a polystyrene micro-sphere produced by using PS Mw of 23 kg mol-1
and 5% w/w PS
concentration (sample 23-5), below C*. (b) bi-modal PS Mw of 53, 107 kg mol-1 and 7% w/w PS concentration
(sample bi-modal 7), below C*. (c) PS Mw of 317 kg mol-1 and 10% w/w PS concentration (sample 317-10), above C*.
Smaller pores are located in proximity of the external regions and a large cavity in the centre is present. The scale
bars are shown on the images.
In order to estimate the pore size distribution within the samples and to compare the information obtained
by SEM with the values for the average void size measured by SAXS (Table 3) the obtained images were
processed using Image J21 image analysis software.
The images selected were close-ups of the external regions of the particles, where most of the porosity was
observed.
This analysis presented several limitations. Firstly, only small areas of the particles were considered.
Therefore the images may not be representative of the entire sample. The image processing relied on the
ability of the software to discriminate between pores (dark areas) and polymeric structure (light areas) by
chromatic contrast. However, when this contrast was not particularly sharp, errors in determining pore size
may be introduced. The assumption that pores were perfectly spherical was made and pore diameters were
calculated from the area of the two-dimensional circular cross-sections. When a particle is fractured,
spherical pores may be randomly cut at any section of the pore. Since the probability to be sliced in two
perfect hemispheres is low, it is very likely that the almost entirety of the observed pores in the SEM images
[image:23.595.132.466.70.292.2]23
In order to account for this under-estimation of the pore diameters, a statistical correction was introduced.The equatorial diameter D of a spherical void is related to the diameter d measured from the SEM image by a
parameter h, which represents the distance of d from the centre of the sphere.32 The relationship between
these parameters is given by the equation:32
(15)
Since the sectioning of a spherical pore can take place at any random distance h, the average probability
value of h is equal to D/2. Solving equation 15 by replacing h with D/2 shows that the equatorial diameter D
of a pore is given by .32 This correction was applied to convert all the measured diameters d
into the equatorial diameters D.
Despite the number of assumptions made for SEM analysis, the pore size distributions of most of the samples
estimated by this method was in a reasonably good agreement with the averaged void size obtained by SAXS
analysis (Figure 7). The SAXS values fall within the pore-size distributions estimated by scanning electron
microscopy, supporting the accuracy and complementary of the two different structural characterization
24
Figure 7. Histograms of the number of air voids (frequency) versus their diameter, showing pore size distributionsobtained from 2D SEM images for cross section regions of the crushed samples 23- a bi-modal b and bi
-modal c )n the top corner of each diagram a representative SEM image that generated the distribution is
25
Correlation between polymer concentration of polystyrene-toluene solutions and structuralmorphology of the particles.
Analysis of the structural information on particles pore size obtained by SAXS measurements and supported
by SEM imaging, together with the polymer concentration of the polystyrene-toluene solutions, has shown a
strong correlation between these parameters (Figure 8). It was found that there is a linear dependence
between 1/pore diameter and polystyrene concentration for the systems below C*.
The linear trend is clearly observed for the 23 kg mol-1 and for the bi-modal polystyrene systems where most
of the polymer solutions have concentrations below C* (Table 1 and Table 2).
The samples that deviates from the linear trend are the samples prepared from 15% w/w polystyrene
solutions. These are above C*, where polymer chain entanglement takes place. For systems with
concentrations above C*, the proportionality relationship is no longer observed. The data points are scattered
across the plot without an obvious trend.
Figure 8. 1/pore diameter vs polystyrene concentration in polymer solutions plot for the 23 kg mol-1 (circles),
[image:26.595.85.508.418.698.2]26
symbols correspond to samples obtained from polystyrene-toluene solutions with polymer concentrations below C*where the phase separation is thermodynamically controlled. Solid symbols represent polystyrene-toluene
solutions with concentration above C*, where the phase separation is kinetically controlled. The pattern-filled symbol for bi-modal shows that only the long chains of the bi-modal sample are above C*. The diagram clearly highlights a linear correlation between 1/pore diameter and polystyrene concentration when C < C* in the 23 kg
mol-1 and in the bi-modal systems. The correlation is no longer observable for 207 kg mol-1 and 317 kg mol-1 where C
> C*.
Since the viscosity of the polymer solutions used to fabricate the particles is proportional to the
concentration of polystyrene in solution, an analogous linear trend is also observable between the zero-shear
viscosity 0 of the polystyrene solutions and 1/pore diameter when C < C* (Figure 9).
Figure 9. 1/pore diameter vs zero-shear viscosity 0 plot for the 23 kg mol-1 (circles), bi-modal 53, 107 kg mol-1
(triangles), 207 kg mol-1 (squares) and 317 kg mol-1 (diamonds) polystyrene systems. The open symbols correspond
to samples obtained from polystyrene-toluene solutions with polymer concentrations below C*, solid symbols
represent polystyrene-toluene solutions with concentration above C*, where the phase separation is kinetically
controlled. The pattern-filled symbol for bi-modal shows that only the long chains of the bi-modal sample are
above C*. The diagram clearly highlights a linear correlation between 1/pore diameter and zero-shear viscosity 0
when C < C* in the 23 kg mol-1 and in the bi-modal systems. The correlation is no longer observable for 207 kg mol-1
[image:27.595.87.510.312.567.2]27
The observed reciprocal relationship between the polymer concentration and pore diameter, forpolystyrene-toluene-ethanol systems when the concentration of the system is lower than the critical chain overlap
concentration C*, may have a practical application and could be used to produce porous polystyrene
micro-spheres with tunable size voids.
Moreover, the correlation between pore diameter and zero shear viscosity demonstrated in this study could
be used as a relatively simple tool to control the properties of the polystyrene-toluene-ethanol systems.
It could be predicted that when the glass transition temperature of the polymer intersects the temperature of
the system upon the addition of the non-solvent, the phase separation arrests19 and the morphology achieved
at this stage is fixed. Since the glass transition temperature of a polymer in solution increases with increasing
polymer concentration,33 a polymer solution at high concentration of polystyrene is expected to intersect the
temperature of the system in a shorter interval of time than a solution at low concentration of polystyrene. As
a consequence, in a high concentration solution, phase separation would arrest earlier and produce pores of
smaller size than in a low concentration solution. For systems with a fixed pore nucleation density, it would
be expected to observe smaller pores (and consequently smaller surface area) in particles generated with high
concentration solutions, and progressively larger pores (and larger surface area) in particles generated with
low concentration solutions.
This trend of high concentration-small pores, is observed in polycarbonate in chloroform,1 where increasing
the polymer concentration produced monoliths with smaller pores.
However, the results obtained in the current study demonstrate the opposite trend, where polystyrene
solutions with increasingly higher concentrations produced porous particles with increasingly larger pores
(Figure 8). The glass transition behaviour alone is insufficient to justify the trend, but a deeper analysis of the
phase diagram provides further insights about the processes taking place in these ternary systems, which
could be helpful for the interpretation of the results.
A section of the ternary phase diagram (Figure 3) can be enlarged to highlight the region of interest (Figure
10). As a representative example the behaviour of only two polymer systems corresponding to Mw 23 kg mol-1
and the bi-modal polystyrene at the initial concentrations of 2% and 7% w/w of polystyrene are considered.
In this case, the starting conditions of the sample preparation (polystyrene in toluene solutions plotted on
28
(squares) and the transition from the one-phase to the two-phase region (arrows) are clearly represented,along with the binodal boundaries.
The phase separation starts on crossing the binodal line: for the bi-modal systems this occurs in point A for
the bi-modal-7 solution and in point C for the bi-modal-2 solution. Similarly it takes place in point B for the
[image:29.595.95.502.240.376.2]23-7 solution and in point D for the 23-2 solution.
Figure 10. Section of the ternary phase diagram of Figure 3. The initial conditions are represented by the triangles
on the toluene-polystyrene axis. The final conditions are represented by the squares. The binodal boundaries for
the bi-modal and the 23 kg mol-1 polystyrene are shown by dotted lines. The arrows represent the transition of the
systems with initial polystyrene concentrations of 2% and 7% w/w from the one-phase to the two-phase region. The
points A and C mark the starting points of phase separation of the bi-modal samples. The points B and D mark the
starting points of phase separation for the 23 kg mol-1 samples.
The compositions of the systems at these points are reported in Table 4 in the form of weight percentage of
polystyrene, toluene and ethanol. The ratio of non-solvent to solvent (ethanol to toluene, ) is higher for
low concentration polymer solutions [ (C) > (A) and (D) > (B)]. At the same initial
concentration, the solutions with lower molecular weight show a higher ethanol to toluene ratio [ (B) >
(A) and (D) > (C)].
Table 4. Composition of the systems at the points A, B, C and D (Figure 10) expressed in polystyrene,
toluene and ethanol weight percentage. Ethanol to Toluene ratio ( ), surface area of the
particles generated by using these polymer solutions and the average pore diameters are also
29
It could be concluded that a greater amount of non-solvent present in the system at the beginning of thephase separation process induces phase separation in a larger number of sites within the emulsion droplets:
this results in a larger number of smaller pores in the particles generated by systems with higher ethanol to
toluene ratio. This hypothesis is supported by SAXS results obtained for the particles surface area: larger
corresponds to larger , suggesting that a larger number of voids is present within these particles. As
a result, the samples with larger surface area have voids with smaller average diameters. The ternary diagram
(Figure 10) suggests that the relative concentration of non-solvent ethanol at the point of phase separation
reduces either with the increase of polystyrene concentration or with the increase of polymer molecular
weight. Thus, it should be expected that the pore surface area has to be reduced (and, consequently, the pore
size has to be increased) either with an increase of molecular weight at a constant concentration of polymer
(Table 4, compare samples bi-modal 2 and 23-2 or bi-modal 7 and 23-7) or with an increase of concentration
for the same molecular weight (Table 4, compare samples 23-2 and 23-7 or bi-modal 2 and bi-modal 7). It
should be noted that this conclusion is only valid for the porous particles obtained from solutions with
polymer concentrations below C*.
CONCLUSIONS.
This work explored the fabrication of porous polystyrene micro-spheres from ternary systems of
polystyrene-toluene-ethanol by a process of non-solvent induced phase separation. A ternary phase diagram for the
system was constructed and the boundaries between one-phase and two-phase regions were experimentally
determined by turbidimetric titration for polystyrene within a wide range of molecular weights from 23 to 317
kg mol-1.
Critical chain overlap concentrations C* were estimated employing two different approaches, where the
values for the radius of gyration of polystyrene were obtained from literature and also via the Kuhn length
Sample Point PS wt% Tol wt% EtOH wt% 3 1
Surface Area (m2 x cm-3)
Pore size (nm)
bi-modal 7 A 5.1 67.2 27.7 0.41 2.74 935
23-7 B 4.7 62.1 33.2 0.53 4.82 532
bi-modal 2 C 1.4 68.8 29.8 0.43 4.35 680
30
and the contour length of a polystyrene chain in a theta solvent. These two approaches gave good agreement.The viscosities of polystyrene-toluene-ethanol mixtures were measured and the values of zero shear viscosity
determined. The polystyrene micro-spheres were characterised by scanning electron microscopy and small
angle X-ray scattering techniques, providing comparable information on the size of the internal voids.
It was found that the average size of the voids present in the porous structures is linked to the concentration
of polymer in the polystyrene-toluene systems by a reciprocal correlation between pore diameter and
polymer concentration. This reciprocal correlation is only valid for ternary systems with polymer
concentrations below the critical chain overlap concentration C*. Above C* this relationship breaks down.
The reciprocal dependence between pore diameter and polymer concentration established for systems below
C* can be used to control void size during the production of porous polystyrene micro-spheres.
We also clarify that the observed relationship between 1/pore diameter and polymer concentration correlates
well with the relative amount of non-solvent present in a system at the beginning of the phase separation
process, as this induces more nucleation sites. The pore size can be reduced and, consequently, the pore
surface area can be increased either by reducing polymer concentration in the initial solution or by
decreasing polymer molecular weight in the sample composition.
ACKNOWLEDGMENTS:
The SAXS experiments were performed on beamline ID02 at the European Synchrotron Radiation Facility
(ESRF), Grenoble, France. We are grateful to Dr Sylvain Prevost at the ESRF for providing assistance in using
beamline ID02.
We thank Prof. Lian Hutchings group at Durham University and Dr Elizabeth Jones of Prof. Armes group in
Sheffield for their help with GPC analysis.
This work was supported by the Technology Strategy Board (grant number: 33692 - 239251).
CONFLICTS OF INTEREST:
31
REFERENCES:
(1) Xin, Y.; Fujimoto, T.; Uyama, H. Facile Fabrication of Polycarbonate Monolith by Non-Solvent Induced
Phase Separation Method. Polym. (United Kingdom)2012, 53, 2847 2853.
(2) Wang, D. M.; Lai, J. Y. Recent Advances in Preparation and Morphology Control of Polymeric Membranes
Formed by Nonsolvent Induced Phase Separation. Curr. Opin. Chem. Eng.2013, 2, 229 237.
(3) Kim, J.; Yaszemski, M. J.; Lu, L. Three-Dimensional Porous Biodegradable Polymeric Scaffolds Fabricated
with Biodegradable Hydrogel Porogens. Tissue Eng. Part C. Methods2009, 15 (4), 583 594.
(4) Rezabeigi, E.; Wood-Adams, P. M.; Drew, R. A. L. Production of Porous Polylactic Acid Monoliths via
Nonsolvent Induced Phase Separation. Polym. (United Kingdom)2014, 55 (26), 6743 6753.
(5) Johnson, D. W.; Langford, C. R.; Didsbury, M. P.; Lipp, B.; Przyborski, S. A.; Cameron, N. R. Fully
Biodegradable and Biocompatible Emulsion Templated Polymer Scaffolds by Thiol-Acrylate Polymerization
of Polycaprolactone Macromonomers. Polym. Chem.2015, 6 (41), 7256 7263.
(6) Jinhua, L.; Dongliang, L.; Honghua, W.; Guangyuan, Z. Porous Polyethylene Spheres with Nanofiber
Structure from Ziegler-Natta Catalyst Supported on Porous Polymer Particles. Polymer (Guildf).2011, 52 (3),
602 605.
(7) Wang, Z.; Bai, R. Preparing Microgranules from Waste Polystyrene through a Novel Temperature- and
Nonsolvent-Induced Phase Separation Method for Potential Adsorbent. Ind. Eng. Chem. Res.2005, 44 (4),
825 831.
(8) Ahuja, G.; Pathak, K. Porous Carriers for Controlled/modulated Drug Delivery. Indian J. Pharm. Sci.2009,
71 (6), 599 607.
(9) Chang, H. H.; Chen, S. C.; Lin, D. J.; Cheng, L. P. Preparation of Bi-Continuous Nylon-66 Porous
Membranes by Coagulation of Incipient Dopes in Soft Non-Solvent Baths. Desalination2013, 313, 77 86.
(10) Hong, Yi; Gao, Changyou; Shi, Yanchao; Shen, J. Preparation of Porous Polylactide Microspheres by
Emulsion-Solvent Evaporation Based on Solution Induced Phase Separation. Polym. Adv. Technol.2005,
No. 16, 622 627.
32
Nonsolvent Induced Phase Separation: A Review. Ind. Eng. Chem. Res.2011, 50, 3798 3817.(12) Silverstein, M. S.; Cameron, N. R.; Hillmyer, M. Porous Polymers; 2011.
(13) Ehsan Rezabeigi, Paula M. Wood-Adams, R. A. L. D. Isothermal Ternary Phase Diagram of the Polylactic
Acid-Dichloromethane-Hexane System. Polymer (Guildf).2014, 55 (14), 3100 3106.
(14) Yang, J.; Li, D. W.; Lin, Y. K.; Wang, X. L.; Tian, F.; Wang, Z. Formation of a Bicontinuous Structure
Membrane of Polyvinylidene Fluoride in Diphenyl Ketone Diluent via Thermally Induced Phase Separation.
J. Appl. Polym. Sci.2008, 110 (1), 341 347.
(15) Karimi, Mohammad; Kish, M. H. Poly(methyl Methacrylate) Membrane: Dynamic Measurement of
Concentrations During Water-Induced Phase Separation. Macromol. Symp.2009, 279, 210 220.
(16) Tanaka, H. Viscoelastic Phase Separation. J. Phys. Condens. Matter2000, 12 (15), R207 R264.
(17) Altena, F. W.; Smolders, C. A. Calculation of Liquid-Liquid Phase Separation in a Ternary System of a
Polymer in a Mixture of a Solvent and a Nonsolvent. Macromolecules1982, 15 (6), 1491 1497.
(18) C. C. Hsul and J. M. Prausnitz. Thermodynamics of Polymer Compatibility in Ternary Systems.
Macromolecules1974, 7 (3), 320 324.
(19) Wang, Lawrence K.; Chen, Jiaping Paul; Hung, Yung-Tse; Shammas, N. K. Membrane and Desalination
Technologies; Humana Press Inc.: Totowa, NJ, 2011.
(20) Mark, J. E. Physical Properties of Polymers Handbook; 1997; Vol. 44.
(21) Abràmoff, M. D.; Magalhães, P. J.; Ram, S. J. Image Processing with imageJ. Biophotonics International.
2004, pp 36 41.
(22) Schneider, C. a; Rasband, W. S.; Eliceiri, K. W. NIH Image to ImageJ: 25 Years of Image Analysis. Nat.
Methods2012, 9 (7), 671 675.
(23) Ilavsky, J.; Jemian, P. R. Irena: Tool Suite for Modeling and Analysis of Small-Angle Scattering. J. Appl.
Crystallogr.2009, 42 (2), 347 353.
(24) Beaucage. Approximations Leading to a Unified Exponential/Power-Law Approach to Small-Angle
Scattering. J. Appl. Crystallogr.1995, 28, 717 728.
33
Macromolecules1984, 17, 1055 1059.
(26) Fetters, L. J.; Hadjichristidis, N.; Lindner, J. S.; Mays, J. W. Molecular Weight Dependence of Hydrodynamic
and Thermodynamic Properties for Well-Defined Linear Polymers in Solution. J. Phys. Chem. Ref. Data
1994, 23 (4), 619 640.
(27) Brandrup, J.; Immergut, E.; Grulke, E. A. Polymer Handbook. John Wiley Sons, Inc1990, 12 (3), 265.
(28) Van Krevelen, D. W.; Te Nijenhuis, K. Properties of Polymers; 2009.
(29) Kniewske, W. M. K. and R. The Shear Viscosity Dependence on Concentration, Molecular Weight, and
Shear Rate of Polystyrene Solutions. Rheol. Acta1984, 23 (1), 75 83.
(30) Hu, N.; Borkar, N.; Kohls, D.; Schaefer, D. W. Characterization of Porous Materials Using Combined
Small-Angle X-Ray and Neutron Scattering Techniques. J. Memb. Sci.2011, 379, 138 145.
(31) Lindner, P.; Zemb, T. Neutron, X-Rays and Light. Scattering Methods Applied to Soft Condensed Matter;
2002; Vol. 5.
(32) Barbetta, A.; Cameron, N. R. Morphology and Surface Area of Emulsion-Derived (PolyHIPE) Solid Foams
Prepared with Oil-Phase Soluble Porogenic Solvents: Three-Component Surfactant System.
Macromolecules2004, 37 (9), 3202 3213.