White Rose Research Online URL for this paper: http://eprints.whiterose.ac.uk/138096/
Version: Accepted Version
Article:
Gao, J, Kirkby, M and Holden, J orcid.org/0000-0002-1108-4831 (2018) The effect of interactions between rainfall patterns and land-cover change on flood peaks in upland peatlands. Journal of Hydrology, 567. pp. 549-559. ISSN 0022-1694
https://doi.org/10.1016/j.jhydrol.2018.10.039
© 2018 Elsevier B.V. Licensed under the Creative Commons Attribution-Non Commercial No Derivatives 4.0 International License
(https://creativecommons.org/licenses/by-nc-nd/4.0/).
[email protected] https://eprints.whiterose.ac.uk/
Reuse
This article is distributed under the terms of the Creative Commons Attribution-NonCommercial-NoDerivs (CC BY-NC-ND) licence. This licence only allows you to download this work and share it with others as long as you credit the authors, but you can’t change the article in any way or use it commercially. More
information and the full terms of the licence here: https://creativecommons.org/licenses/
Takedown
If you consider content in White Rose Research Online to be in breach of UK law, please notify us by
The effect of interactions between rainfall patterns and
1land cover change on flood peaks in upland peatlands
2Jihui Gao1, 2, 3 *, Mike Kirkby2, Joseph Holden2 3
1. State Key Laboratory of Hydraulics and Mountain River Engineering, 4
Sichuan University, Chengdu, 610065, China 5
2. water@leeds, School of Geography, University of Leeds, Leeds, LS2 9JT, 6
UK 7
3. School of Water Resource & Hydropower, Sichuan University, Chengdu 8
610065, China 9
Abstract
10
Flood processes in catchments are driven by a combination of rainfall and 11
landscape characteristics. Upland peatlands are source areas of flooding but 12
there is lack of understanding of how different rainfall intensities and 13
temporal patterns may interact with land-cover configurations to influence 14
flood peaks. Using spatially distributed (SD-) TOPMODEL we investigated 15
these interactions for a case study peatland catchment. For each of four 16
rainfall depths ranging from 20 mm to 50 mm, four storm rainfall patterns 17
were applied (rainfall that was uniform, rainfall with an early peak intensity 18
during the storm, middle peak and late peak). Late peak rainfall resulted in 19
the highest river flow peaks at the catchment outlet studied, followed by 20
middle and early rainfall peak patterns, while uniform rainfall through time 21
gave the lowest flow peaks. A key factor was synchroneity of overland flow 22
movement and concentration. The impact on river flow peaks of land-cover 23
change on riparian zones and on gentle gradient slopes was larger than that 24
for other parts of the catchment under different rainfall intensities and 25
patterns. The impacts of land-cover change on proportional change in flood 26
peaks in these sensitive areas became smaller when rainfall intensity 27
increased, but absolute changes in flow peaks became larger. Land-cover 28
change in sensitive areas under middle and late peak rainfall had a larger 29
impact on river flow peaks than for early peak rainfall. It was possible to 30
identify the ‘worst’ rainfall patterns for a particular case of land-cover change 31
which may be useful for practitioners to help manage expectations of flood 32
Keywords: rainfall characteristics, land management, peak flow, overland 34
flow, nature-based solutions, TOPMODEL. 35
1 Introduction
36
Runoff processes in natural catchments are driven by a combination of 37
rainfall patterns and landscape characteristics. Every rainfall event has a 38
unique temporal rainfall distribution, but sometimes patterns of this 39
distribution in a particular catchment can be generalized from historic rainfall 40
data (e.g. Dolsak et al., 2016; Huff, 1967; Willems, 2000). Changes in 41
temporal rainfall distributions in a region are due to both climatic change and 42
climatic variability (Yilmaz et al., 2014). Temporal rainfall distributions can 43
impact overland flow and flood processes. Generally, with the same total 44
amount of rainfall, non-uniform temporal patterns are considered to produce 45
higher flow peaks than those with uniform patterns. A storm with rainfall of 46
higher intensity near the end of the storm (late rainfall peak) rather than at 47
the start or middle of the storm is believed to generate a higher flow peak 48
than a storm with the same total rainfall but which has greatest rainfall 49
intensity near the start of the event (Dunkerley, 2012; Dunkerley, 2014). 50
Some studies have shown that this could be related to soil surface sealing 51
arising in response to the higher intensity part of the storm (Flanagan et al. 52
(1988). Other research has attributed the effect to reductions in soil 53
infiltration capacity during late rainfall compared with earlier in the rainfall 54
event (Dunkerley, 2012; Xue and Gavin, 2007). 55
Peatlands cover around 423 million ha (Xu et al., 2018) and store more than 56
half of the world’s soil carbon (Yu et al., 2010). Peatlands often occur in 57
upland areas in temperate and boreal zones where there is a high rainfall 58
excess (Gallego-Sala and Prentice, 2013). Blanket peat exists on open and 59
rolling landscapes, typically in oceanic regions which are wet and cool in 60
climate (Evans and Warburton, 2007). Vascular plants and bryophytes such 61
as Sphagnum are usually form dominant vegetation cover in blanket 62
peatlands (Holden et al., 2015). Around 15 % of the UK is covered by 63
blanket peat, where it is mainly found in upland headwater catchments. 64
Upland blanket peatlands, normally with shallow water tables, produce 65
minimal baseflow but are quickly saturated during rainfall events (Evans et 66
al., 1999; Price, 1992). Typically, upland blanket peatlands in the UK are 67
subject to light frontal rainfall (<10 mm hr-1) but very occasionally storm 68
intensities of 20-50 mm hr-1 can occur which may lead to downstream 69
contributions to the river channel hydrograph in upland blanket peat, even 71
during light rainfall events (Holden and Burt, 2002; Holden and Burt, 2003). 72
Hence, upland peatlands are flashy hydrological systems and sensitive to 73
precipitation characteristics and land-cover modifications. For such systems, 74
reductions of soil infiltration capacity during storms and sealing of the 75
surface due to rain drops may be of minimal importance in determining the 76
river flow peak response to rainfall. Rather, the prime impacts of rainfall 77
pattern on flow peaks in blanket peatlands could be related to overland flow 78
delivery and concentration on hillslopes. However, this has never been 79
tested. Different temporal profiles of precipitation could generate varying 80
overland flow depths and velocities for every point on hillslopes, which 81
results in different spatial distributions of overland flow in the catchment for 82
every time point in a flood event. Thus the synchroneity of overland flow 83
concentration driven by temporal rainfall patterns could be a key determinant 84
for river flood formation from peat catchments (Gao et al., 2016). Changes in 85
such overland flow velocities and patterns may produce different river flow 86
peak timings and magnitudes. 87
88
In recent years, ‘natural flood management’ also known as ‘nature-based 89
solutions’ has been advocated as a sustainable measure to reduce flood risk 90
and as a complementary measure to traditional flood management (SEPA, 91
2011). Natural flood management deals with the sources and pathways of 92
floodwaters and manipulates river flow at the catchment scale (Holstead et 93
al., 2017; SEPA, 2011). It includes altering, restoring or using landscape 94
features to manage flood risk, with practices such as exclusion of grazing 95
animals, vegetation restoration, creating porous surfaces, or use of small 96
storage ponds and scrapes to create landscape roughness and water 97
storage. However, there is a paucity of evidence for evaluating such nature-98
based solutions for their flood-attenuation performance under a range of 99
rainfall patterns (Dadson et al., 2017; Rogger et al., 2017). For upland 100
blanket peatlands, as overland flow is common, even when peat has been 101
disturbed by drainage (Holden et al., 2006), then potentially one of the most 102
effective ways of delaying streamflow using natural flood management is to 103
create a rough, well-vegetated surface (Ballard et al., 2011; Gao et al., 2016; 104
Gao et al., 2017; Lane and Milledge, 2013). Such rough revegetation most 105
commonly occurs for disturbed peatlands where mosses are encouraged to 106
re-establish in bare areas or to act as an understorey to existing sedge and 107
that re-establishment of mosses on peatlands is seen to provide other 109
functional benefits including enhanced carbon capture and attenuation of 110
methane release (Larmola et al., 2010). 111
112
The modelling studies by Gao et al. (2016) and Gao et al. (2017) indicated 113
that the same land-cover change in ‘sensitive’ areas of upland peat 114
catchments (e.g. riparian zones and gentle slope areas) could have three 115
times the impact on river flow peaks as those same land-cover changes in 116
‘insensitive’ areas such as headwater regions and steep slopes. However,
117
these modelling studies used only simple designs of moderate rainfall events 118
(i.e. 1-hour rainfall pulses with uniform rates of 15 mm hr-1, 20 mm hr-1, and 119
30 mm hr-1). Larger intensities of rainfall were not studied. Furthermore, 120
even if the total rainfall depths of storms are kept identical, varying rainfall 121
profiles (i.e. different temporal distributions of precipitation) could still change 122
the spatial distribution of overland flow production and synchroneity of 123
overland flow concentration on hillslopes resulting in differences in river 124
hydrographs. Therefore, we do not know whether the sensitive parts of 125
upland catchments recognized in the study of Gao et al. (2016) are still the 126
most sensitive for different rainfall intensities and patterns. We also do not 127
know how land-cover change in these areas affects flood peaks for different 128
distributions of rainfall events. This interaction information would be 129
important to support expectations by natural flood management practitioners 130
on the consistencies or inconsistencies of performance of land-cover change 131
solutions in upland systems to rainfall events. Accordingly, using numerical 132
modelling methods, this paper aims to investigate the impacts of rainfall 133
characteristics on river flow peaks during flood events in an upland blanket 134
peat catchment, and to study the interactions between rainfall characteristics 135
and land-cover change. 136
137
2 Methodology
138
2.1 Study site 139
The Trout Beck catchment (5441’ N, 223’ W) is located in the Moor House 140
National Nature Reserve and covers an area of 11.4 km2 with an elevation 141
ranging from 842 m to 533 m in the North Pennine region of northern 142
England (see Figure 1). It is a headwater tributary of the River Tees, and 143
(Evans et al., 1999). Large areas of the catchment have re-vegetated with 145
Sphagnum and Eriophorum in recent decades after the peat suffered 146
widespread erosion in the 1950s-1970s (Grayson et al., 2010). The 147
catchment is mainly covered by a Calluna-Eriophorum vegetation 148
association with a slowly increasing Sphagnum abundance in the 149
understory. Over 630 m, Calluna is absent and Eriophorum is dominant
150
(Evans et al., 1999). The climate of the catchment is sub-arctic oceanic 151
(Manley, 1942) and there is a mean annual rainfall of 2012 mm based on 152
rainfall records from 1951 to 1980 and 1991 to 2006 (Holden and Rose, 153
2011). 154
155
2.2 SD-TOPMODEL 156
The original TOPMODEL was a lumped or semi-distributed model of 157
catchment hydrology when developed by Beven and Kirkby (1979). Gao et 158
al. (2015) developed a spatially-distributed version - SD-TOPMODEL - which 159
retains the key catchment scale equations of runoff production from the 160
original TOPMODEL (see Kirkby, 1997) but downscales those equations to 161
cell scale (using grid cells as computational units). A new overland flow 162
module was constructed in SD-TOPMODEL by Gao et al. (2015) to 163
represent overland flow delivery and routing. The overland flow module 164
employed the multiple-direction flow theory of Quinn et al. (1991) and an 165
empirically-derived form of the Darcy-Weisbach equation (Holden et al., 166
2008). Thus, the SD-TOPMODEL takes topography, surface roughness and 167
water depth into account to represent overland flow movement in 168
catchments. In SD-TOPMODEL, there is a dynamic interaction between 169
overland flow and subsurface flow for each computational cell, and overland 170
flow from upslope cells can infiltrate into soil in downslope cells in a 171
catchment. There are major advantages of SD-TOPMODEL for our study. 172
The model can explicitly simulate the locations of overland flow generation, 173
the rates of overland flow production, the depths of overland flow, the 174
pathways of overland flow movement, and the locations of overland flow 175
infiltrating into soil or entering river channels in any time step during and 176
after a storm with time-varying precipitation intensities. SD-TOPMODEL also 177
represents the variation of overland flow velocity according to the surface 178
roughness presented by the land cover, taking gradient and flow depth into 179
account. 180
There are three key parameters for peatland catchment modelling in SD-182
TOPMODEL as defined by Gao et al. (2015): K is the hydraulic conductivity 183
of the soil; m is a scaling parameter representing the active water storage in 184
soil; and kv is an overland flow velocity parameter related to surface
185
roughness. The model was calibrated and validated by using the GLUE 186
(generalized likelihood uncertainty estimation) method (Beven and Binley, 187
1992) of which details can be found in Gao et al. (2015). Values of 188
m=0.0055 m and near-surface K=100 m hr-1 had good performance (i.e. 189
Nash-Sutcliffe efficiency > 0.8 in both the model calibration and validation in 190
the Trout Beck catchment). This well-performing parameter set was used to 191
run the model for all scenarios, in order to retain consistency in comparing 192
the scenarios. The results of scenario modelling could be impacted by the 193
uncertainty of this single parameter set, but the large consumption of 194
computational time for the GLUE method was not possible for direct 195
application in this study. However, uncertainties in the model have 196
previously been investigated by Gao et al. (2016). In this study using the 197
GLUE framework, 50 parameter sets, in which each set included three 198
parameters (i.e. m, K, kv), were randomly selected for three different study
199
catchments (including Trout Beck catchment) in its representative parameter 200
space and used to run the model in the calibration period 50 times. The top 201
five parameter sets with the highest Nash-Sutcliffe efficiencies (all >0.82) 202
were obtained for each catchment that they studied (the five sets performed 203
well also in validation periods). They were then used in land cover scenario 204
runs (only kv was changed in the land cover change areas of the land cover
205
scenarios). The results were entirely consistent with the results that were 206
obtained by using one parameter set (see the supplementary material). 207
Thus, based on GLUE results obtained by Gao et al. (2016) using SD-208
TOPMODEL, the one well-performing parameter set chosen was 209
appropriate. 210
The velocity parameter of overland flow was derived from an empirical study 211
of Holden et al. (2008) in a UK blanket peatland catchment, in which 212
overland flow was investigated for different vegetation types, slopes and flow 213
depths. It was found that mean velocity of overland flow and Darcy-214
Weisbach roughness could be based on a single parameter for each typical 215
land-surface cover (see Section 2.4). 216
2.3 Designed rainfall events and land-cover scenarios 218
To investigate impacts of rainfall intensities on hydrographs in flood events, 219
20 mm, 30 mm, 40 mm and 50 mm storm events (1 hr duration) were 220
applied as the modelled inputs of precipitation. These values were based on 221
an investigation of extreme events which were realistic for the study region. 222
A 1-hr 20 mm hr-1 rainfall event is approximately equivalent to a 10-year 223
return period event estimated from the empirical frequency of summer 224
rainfall events in the study catchment (from 1993 to 2009). The 1-hr 50 mm 225
event is the largest 1-hr rainfall observed in the period for which rainfall data 226
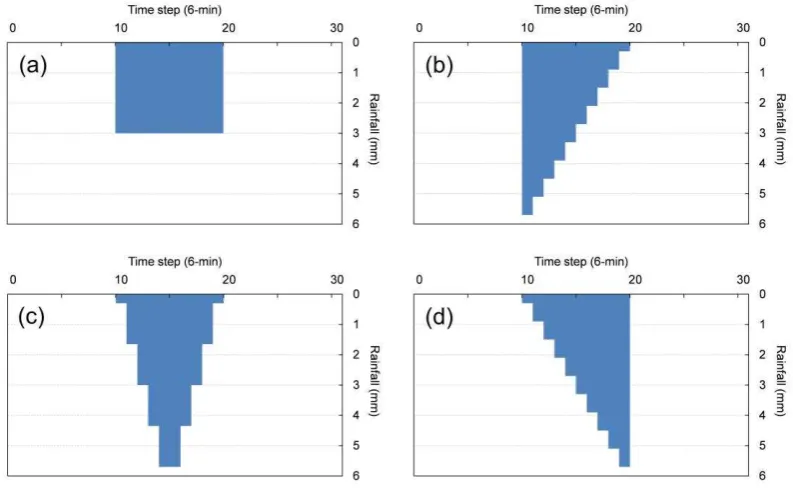
are available in the catchment. For each rainfall depth, a series of temporal 227
precipitation patterns were designed, i.e. uniform profile, late peak profile 228
(more intense toward the end of the storm), early peak profile (more intense 229
at the start of the storm) and middle peak profile (Figure 2). 230
231
Land-cover scenarios employed in the modelling experiments included a 232
baseline scenario, two sets of land-cover change scenarios, and a set of 233
bare peat soil and revegetation scenarios. The baseline land-cover scenario 234
assumed that all of the catchment was covered by Eriophorum which, in fact, 235
dominates the vegetation cover of the Trout Beck catchment. 236
237
The three scenario sets of land-cover change - the slope position scenarios, 238
the riparian zone scenarios and the steep-gentle slope scenarios (see Figure 239
3 a to g) - were selected to provide a range of different spatial configurations 240
and to test commonly held assumptions about the spatial sensitivity of 241
catchment cover for flood risk. These three main sets of scenarios were 242
investigated in the modelling study of Gao et al. (2016) under a 20 mm storm 243
event. Hence, by adopting the same main land-cover change scenarios we 244
can compare our results to those in that earlier study. For the riparian zone 245
scenarios, the river channel networks were defined with three different 246
thresholds of accumulative upslope areas (i.e. 250 cells, 1000 cells, and 247
3000 cells). In a peatland catchment, the network of river channels can be 248
complicated by headwater gullies with only intermittent flow. The channel 249
network can be defined with different thresholds of accumulative upslope 250
areas. A high threshold will produce a short downstream channel network 251
and a low threshold will define an extended and upslope-connected channel 252
network. Considering the resolution of the DEM data (20 m x 20 m) used in 253
covered by riparian zones, 1.2 km2 (3000 cell), 0.4 km2 (1000 cell), and 0.1 255
km2 (250 cell) cumulative upslope areas were selected as thresholds to 256
organize the riparian zone scenarios. The steepest 10 % of the catchment 257
area and the flattest 10 % of the catchment were selected for land-cover 258
change in the steep or gentle slope scenarios. The final land-cover change 259
scenario – revegetation of bare peat areas - involved data from a field 260
survey in 2012 by North Pennines Area of Outstanding Natural Beauty 261
Partnership (Figure 3h) which mapped areas of bare peat that the 262
Partnership seek to revegetate. In practice these maps overestimate bare 263
peat coverage, as they broadly define areas with high concentrations of bare 264
peat, rather than wholly unvegetated areas. 265
266
Two land-cover types, bare soil and Sphagnum, were used to replace the 267
Eriophorum cover respectively on the target sites of the catchment in each 268
scenario to represent possible vegetation loss and restoration. This is a 269
realistic approach as many upland blanket peatlands have become eroded 270
and bare (Evans and Warburton, 2007) and restoration agencies seek to 271
revegetate these systems, often by encouraging Sphagnum regeneration 272
(Parry et al., 2014). For the revegetation of bare peat scenario, change for 273
these areas in our model involved revegetation with either Eriophorum or 274
Sphagnum. In all land-cover scenarios, the parameter of overland flow 275
velocity (kv) was set to five times greater on bare peat areas than on
276
Eriophorum while the velocity parameter on Sphagnum areas was half that 277
of the Eriophorum areas. This relationship between the overland flow 278
velocity parameters (an inverse roughness parameter) of Sphagnum,
279
Eriophorum, and bare peat is based on the field study of (Holden et al., 280
2008). 281
282
For each land-cover scenario, except the revegetation of bare peat scenario, 283
land-cover change area was set to be 10 % of the catchment. For the real 284
bare peat scenario, 9.7 % of the catchment was mapped as bare and 285
therefore this 9.7 % of the catchment was modified in the associated 286
revegetation scenarios. For the baseline land-cover scenario, all four rainfall 287
patterns for each rainfall depth were used as the input in model runs. 288
However, to save computing time, all four rainfall patterns, for the 30 mm 289
rainfall depth only, were employed for all land-cover change scenario 290
292
2.4 Modelling runs 293
The DEM grid cell used in the study was 20m x 20m. The time step used in 294
the scenario modelling runs was 0.1 hr in order to help identify minor 295
differences in peak timings and size between scenario results. For each 296
scenario, it was assumed that there was no overland flow on hillslopes at the 297
first time step but that 90% of cells were saturated. At the start of each run 298
there was a model warming-up stage of 10 time steps (i.e. 1 hour). This was 299
sufficient as the moisture deficit of every cell is derived from the starting 300
runoff at the catchment outlet based on its topographic index. The model 301
was set up with awet antecedent condition at the beginning of the warming-302
up stage, with 90% of the catchment being saturated and no overland flow 303
occurring on hillslopes. Therefore 10 time steps were enough to produce an 304
equilibrium condition for rainfall-runoff simulation. Then one of the designed 305
rainfalls (10 time steps long) began followed by another 80 time steps 306
without any rainfall. However, the example figures presented in the results 307
section below focus on the key flood responses during the first 60 time steps 308
rather than all additional time-steps of the recession limb. 309
310
3 Results
311
3.1 River flow peaks with land-cover change under different rainfall 312
intensities (uniform profile) 313
Under different rainfall intensities, the bare peat scenarios had earlier and 314
increased flow peaks in the river channel compared with the baseline 315
scenario; conversely the scenarios with dense vegetation cover (i.e. 316
Sphagnum) delayed and reduced river flow peaks (Table 1). 317
Riparian strips 318
In terms of strip position on hillslopes, the riparian bare peat strips created 319
the earliest and highest river flow peaks compared with mid-slope and 320
headwater bare peat strips (see Table 1) in the different rainfall events (20 321
mm hr-1 to 50 mm hr-1). Sphagnum cover on the riparian strips created later 322
and lower flow peaks than on mid-slope and headwater strips. For riparian 323
strips located based on different thresholds of accumulative upslope 324
drainage area, bare peat surrounding river channels defined by low 325
riparian strips surrounding high-threshold river channels (3000 cells, 1.2 327
km2). Sphagnum cover on thinner riparian strips created later and lower river 328
flow peaks than on thicker strips covering the same proportion of the 329
catchment. Figure 4 presents the distribution maps of overland flow velocity 330
and depth for the baseline scenario, the 250-cell bare peat riparian strip 331
scenario, and the 250-cell Sphagnum riparian strip scenario at time step 21 332
after 30 mm uniform rainfall. There was larger overland flow velocity on the 333
bare peat riparian regions than on the two vegetation covers; while more 334
water was retained alongside water courses for the Sphagnum riparian strip 335
scenario than the other scenarios. 336
Gentle and steep slopes 337
For the scenario sets of land-cover change on gentle slope areas or steep 338
slope areas, the results showed that bare peat on gentle slopes induced 339
higher and earlier flow peaks than bare peat on steep slopes while 340
Sphagnum on gentle slopes produced lower and later peaks than those on 341
steep slopes (Table 1). 342
Revegetation of bare peat patches 343
Revegetating current bare peat areas reduced and delayed river flow peaks 344
under each rainfall intensity, while revegetation with Sphagnum reduced 345
peak flow more than with Eriophorum (Table 1). 346
Rainfall intensity 347
For most scenario sets under higher rainfall intensities, the relative (%) 348
differences between peak flow rates for different land-cover change 349
scenarios (relative to the peaks of the baseline scenario) were smaller than 350
under lighter rainfall intensities (Table 1). For example, bare peat on the 351
riparian strips along channels defined by 3000 upslope drainage cells 352
increased flood peaks by 7.5% at 20 mm hr-1 but only 2.3 % at 50 mm hr-1; 353
Sphagnum cover on the same strips reduced flood peaks by 6.3 % at 20 mm 354
hr-1 rainfalls to 3.3% at 50 mm hr-1 rainfalls. However, the absolute difference 355
of the flow peaks between the land-cover change scenarios and the baseline 356
scenarios increased (non-linearly) as rainfall intensity became greater. 357
Decreases in flow peaks were 2.6 m3 s-1 for 3000 cell Sphagnum strips 358
compared with baseline at 20 mm hr-1 rainfall but 4.7 m3 s-1 at 50 mm hr-1 359
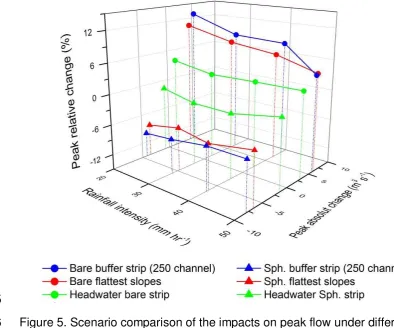
rainfall. Figure 5 presents a scenario comparison including the 250-cell 360
riparian scenario (Figure 3c), the gentle slope scenario (Figure 3g), and the 361
headwater scenario (Figure 3e) to show the impacts on peak flow under 362
364
3.2 River flow peaks under non-uniform rainfall events 365
For the baseline land-cover scenario, all rainfall patterns with non-uniform 366
profiles increased river flow peaks and changed peak timings compared with 367
the corresponding uniform-profile events with the same total rainfall. The 368
resulting hydrographs are shown in Figure 6. The early rainfall peak profile 369
resulted in an earlier but lower river flow peak compared with the middle and 370
late peak profiles in each rainfall depth scenario. The flow peak of the middle 371
peak profile was later than the early rainfall peak profile but earlier than the 372
late peak profile in each scenario. The late peak profiles created higher river 373
flow peaks than the middle profiles under all rainfall events, even though 374
results were close for the 50 mm rainfall event. Taking the 20 mm set as an 375
example (Figure 6a), non-uniform rainfall patterns increased flow peaks by 376
1.4%, 5.9% and 7.5% respectively for the early peak profile, the middle peak 377
profile, and the late peak profile, compared with the uniform rainfall profile. 378
The relative differences of river flow peaks under uniform and non-uniform 379
rainfalls were greater with increased precipitation intensity. For example, 380
during the 50 mm rainfall event (Figure 6d), the late, middle, and early 381
rainfall profiles had 3.9%, 19.0% and 19.6% higher river flow peaks than the 382
uniform rainfall profile, which are much larger differences than for lesser 383
rainfall depths. 384
385
3.3 River flow peaks with land-cover change under non-uniform 386
rainfall events 387
Land-cover change under storms with non-uniform temporal precipitation 388
profiles generally resulted in larger impacts on river flow peaks compared 389
with those storms with uniform rainfall. 390
Riparian strips 391
Under rainfalls with different temporal patterns, the riparian bare peat strip 392
created earlier and higher river flow peaks than the mid-slope and 393
headwater bare peat strips. Conversely, Sphagnum cover on the riparian 394
strips resulted in later and lower flow peaks than on the mid-slope strips and 395
the headwater strips. However, the flow peaks produced by having mid-396
slope strips of land-cover change were quite similar to the peaks of riparian 397
strips under the non-uniform profile rainfalls. For example, under the early 398
Sphagnum mid-slope strip peaks (compared with the peak of the baseline 400
scenario) were 4.7% (3.51 m3 s-1) and 3.4% (2.56 m3 s-1) (Table 2). 401
For the different riparian strip scenarios, land-cover change on the 250-cell 402
riparian strip had a larger impact on river flow peaks than the 1000-cell and 403
3000-cell riparian strips (Table 2). For example, under the late peak rainfall, 404
bare peat on the 250-cell riparian strip increased the river flow peak by 405
11.4% (9.58 m3 s-1), while the 1000-cell and 3000-cell riparian strips were 406
associated with 9.1% (7.67 m3 s-1) and 4.2% (3.51 m3 s-1) flow peak 407
increases. Changing to Sphagnum cover on the 250-cell riparian strip 408
created an 11.7% (9.90 m3 s-1) reduction of river flow peak, which was more 409
than the 11.0% (9.26 m3 s-1) reduction for the 1000-cell riparian strip and the 410
7.6% (6.39 m3 s-1) reduction for the 3000-cell riparian strip. 411
412
Gentle and steep slopes 413
Under all non-uniform rainfall events, bare peat on the gentle slope areas 414
gave much higher river flow peaks than that on steep slopes; conversely 415
Sphagnum on gentle slopes made lower flow peaks than steeps slopes 416
(Figure 7). River flow peaks were increased by bare peat on steep slopes 417
and gentle slopes by 3.9% (2.87 m3 s-1) and 8.6% (6.39 m3 s-1) under the 418
early peak storm, by 3.1% (2.56 m3 s-1) and 10.9% (8.94 m3 s-1) under the 419
middle peak storm, and by 1.1% (0.96 m3 s-1) and 8.0% (6.71 m3 s-1) 420
respectively under the late peak storm compared with the baseline scenario 421
in each case. Sphagnum cover on steep slopes and gentle slopes 422
decreased river flow peaks by 1.7% (1.28 m3 s-1) and 8.1% (6.07 m3 s-1) 423
under the early peak storm, by 1.2% (0.96 m3 s-1) and 9.0% (7.36 m3 s-1) 424
under the middle peak storm, and by 5.7%(4.79 m3 s-1) and 11.4% (9.58 m3 425
s-1) under the late peak storm respectively. 426
427
Revegetation on real bare peat areas 428
Revegetation on the real bare peat areas decreased river flow peaks under 429
storms for all precipitation profiles. The flow peaks were reduced by 430
Eriophorum cover (3.7 %, 2.87 m3 s-1) and Sphagnum cover (7.4 %, 5.75 m3 431
s-1) under the early peak rainfall compared with the baseline bare peat 432
cover. Under the middle peak rainfall the Sphagnum-induced peak flow 433
and 0.8 % (0.64 m3 s-1) and 5.3 % (4.47 m3 s-1) respectively under the late 435
peak rainfall (Table 2). 436
437
A scenario comparison of the impacts on peak flow with different rainfall 438
patterns is illustrated in Figure 8. Bare peat in the riparian areas and the 439
flattest areas under the 30 mm late peak rainfall increased river flow peaks 440
more than the other rainfall patterns; while revegetation in these areas with 441
sphagnum under the 30 mm late peak rainfall made more river flow peak 442
reduction than the other rainfall patterns. 443
444
4 Discussion
445
4.1 Impacts of land-cover change on river flow peaks under varying 446
rainfall intensities 447
4.1.1 Relative and absolute change in flow peaks
448
As rainfall intensity increased from 20 mm hr-1 to 50 mm hr-1, the relative 449
changes of the river flow peaks decreased for most of the land-cover change 450
scenarios compared with the baseline scenario but the absolute changes of 451
those peaks became larger (especially for rainfall increasing from 20 mm to 452
40 mm), which matters for flooding. Interestingly, the absolute change in 453
peaks between land-cover scenarios for 50 mm rainfall events were 454
sometimes similar to those for 40 mm rainfall events (Table 1), potentially 455
suggesting there is an upper limit for rainfall event size in enhancing land-456
cover change impacts on flood peaks. However, as the results showed that 457
loss of vegetation cover can increase flood peaks by a larger absolute value 458
in heavier rainfall events than in smaller storms, and conversely revegetation 459
can also reduce flood peaks by a larger absolute amount in heavier storms 460
than in smaller ones, revegetation still benefits flood risk attenuation even 461
under extreme storm events. This finding is not in line with research on non-462
wetland soils where forest impacts on floods have been studied (e.g. 463
Bathurst et al., 2011a; Bathurst et al., 2011b). These forest studies 464
suggested that effects on flood peaks of either afforestation or deforestation 465
were most evident for small to moderate rainfall events but not for extreme 466
events. It may be that in forest soils enhanced soil water storage effects are 467
the dominant factor for small and medium storms but this storage becomes 468
overwhelmed in large storms. For blanket peatlands, there is very little soil 469
key effect is from slowing the velocity of overland flow. A dense carpet of 471
Sphagnum often > 10 cm thick, can effectively slow flows across the entire 472
hillslope being important even for the largest storms with deepest sheetflow. 473
474
Land-cover change on riparian zones (hilltoe areas) had more impact on 475
stream flow peaks than cover change on other areas of hillslopes (e.g. mid-476
slope and headwater areas) under all rainfall intensities tested. However, the 477
impact of land-cover change on headwater regions almost approached that 478
of the 3000 cell-defined riparian regions under the 50 mm storm. This is 479
likely to be due to the slightly reduced effect of surface roughness on 480
overland flow movement under large overland flow depths. 481
482
4.1.2 Riparian strips
483
Riparian strip impacts on river flow peaks were close to those of the mid-484
slope and headwater buffer strips under the largest rainfall intensity tested. 485
Gao et al. (2016) indicated that the impact of the converging shape of 486
natural catchments, and the accompanying overland flow concentration, 487
makes riparian zones and hilltoe areas more efficient for affecting overland 488
flow movement. However, under higher rainfall intensity, overland flow 489
accumulation on the lower areas of hillslopes could lead to large overland 490
flow depths, which may weaken the efficiency of the surface roughness 491
effect on overland flow movement in riparian areas. Thus, the peak flow 492
differences between the riparian strip scenarios and the other scenarios 493
became small under high rainfall intensities. 494
Considering that riparian buffer strips surround stream channels with 495
different thresholds of accumulation area, land-cover change on the thin but 496
branching riparian buffer strips (based on channels with low accumulative 497
area threshold) had a larger impact on river flow peaks even under high 498
rainfall intensities (50 mm hr-1 in this study). This result supports the finding 499
of Gao et al. (2016), in which it was indicated that thicker riparian strips 500
contain outer cells that are away from stream channel, and have lower 501
efficiency in affecting river flow than that of thinner riparian strips. In storm 502
events with high precipitation intensities, revegetation on the branching 503
riparian strips still produced more benefits for flood risk control than 504
revegetation on thicker riparian strips or on other areas in the catchment. For 505
example, Sphagnum cover on the 250-cell channel riparian strip in the Trout 506
mm hr-1 and 50 mm hr-1 rainfall events (6.4% and 5.6% reductions). This 508
may be because, even for the rainfall intensity of 50 mm hr-1, the impact of 509
land-cover change in upstream riparian areas on low-depth overland flow is 510
still efficient compared with that of the downstream riparian zones where 511
flow depths will be greater. 512
513
4.1.3 Slope
514
Land-cover change on flat slopes influence flow peaks more than on steep 515
locations in this catchment under all rainfall intensities tested. Impacts of 516
land-cover change on flat slopes on river flow peaks are strong even under 517
high rainfall intensities. This indicates that revegetation on gentle slopes can 518
provide reliable benefits to flood attenuation no matter what the temporal 519
rainfall pattern is. In practice, there could be a high priority towards 520
revegetation on gentle slope areas in target catchments. 521
522
4.1.4 Revegetation
523
Reduction of river flow peaks induced by revegetation on real bare peat 524
areas in the study catchment was quite limited and decreased (for both the 525
absolute and relative changes) with rainfall intensity. This is because most of 526
the bare patches were not on the sensitive areas of the catchment that 527
impact overland flow movement and concentration efficiently (e.g. riparian 528
areas and flat slopes). Revegetation simply on bare soil patches without 529
spatial planning could have little value for flood peak attenuation in extreme 530
storm events. 531
532
4.2 Impacts of temporal rainfall patterns on river flow peaks 533
Temporal rainfall patterns have impacts on downstream flood peaks in the 534
Trout Beck peatland catchment. The time differences of the flow peaks 535
under different rainfall patterns (with identical total rainfall depth) were 536
expected but the changes of the flow peak sizes were also considerable. 537
Previous studies (presented in section 1 of this paper) suggested that the 538
decay of soil infiltration capacity and/or the formation of soil surface sealing 539
during storm events lead to peak flow rate differences under different rainfall 540
patterns. Early peak rainfall, by first filling the pore spaces in the soil, could 541
produce less overland flow to form a lower flow peak at the outlet of the 542
occur after the saturation has already been established in the initial part of 544
the storm. However, these mechanisms are not the case in a peatland 545
catchment which is well covered by vegetation and dominated by rapid 546
development of saturation-excess overland flow. The soil moisture deficit of 547
the whole catchment in this study was set to be very small at the start of the 548
model runs (less than 0.1 mm depth for the whole catchment). The 549
difference between the flood peaks was much larger than this deficit. For 550
example, the peak difference was 0.5 mm per 6 min under 40 mm rainfall 551
and 0.8 mm per 6 min under 50 mm rainfall. Thus the soil moisture deficit 552
cannot explain the magnitude of difference between flood peaks. 553
Furthermore, flow peaks for the middle peak rainfall patterns were also lower 554
than those of the late peak rainfall patterns. 555
556
Changes to precipitation time series induce changes in overland flow 557
production at every location in the catchment, and consequently overland 558
flow movement on hillslopes could also be altered to change river flow 559
peaks. For the early peak rainfall pattern, precipitation with a high intensity at 560
the beginning of the rainfall event generated overland flow which had a large 561
flow depth and transport velocity on hillslopes, so surface water travels 562
downslope relatively fast. Additional precipitation falling onto the surface 563
water increased water depth and accelerated overland flow delivery on 564
hillslopes. However, this acceleration of overland flow movement on 565
hillslopes (particularly on headwater areas) becomes weaker for smaller 566
rainfall intensities in proceeding time steps after the peak rainfall has 567
occurred. In downslope areas, however, the delivery and concentration of 568
overland flow is still quite fast in these follow-up time steps due to the 569
overland flow which was produced in the early time steps by intensive 570
precipitation. Thus, there seemed to be a split of overland flow movement on 571
hillslopes when the early peak rainfall pattern tended to generate obtuse and 572
wide hydrographs at the catchment outlet. In contrast, for the late peak 573
rainfall patterns, initially low precipitation produced shallow surface water 574
and slow overland flow; while in the following time steps the increasing 575
precipitation produced deep and fast overland flow which was ‘chasing’ the
576
downslope overland flow generated earlier. Therefore, it seems that late 577
peak rainfall patterns were more likely to create sharp and thin river flow 578
peaks than the early peak rainfall distributions. For the middle peak patterns, 579
river flow peaks were quite close to the flow peaks under the late peak 580
concentration of rainfall around the rainfall peak of the middle peak pattern 582
was larger than that of the early peak pattern (e.g. for the 50 mm events the 583
rainfall depth of the four middle steps in the middle rainfall pattern was 33.5 584
mm and the depth of the early four steps in the early rainfall pattern was 32 585
mm). The ‘chasing’ effects in overland flow movement (same for the late 586
peak rainfall patterns above) were shorter but faster than those under the 587
late peak rainfall patterns in the first half of the rainfall period due to the 588
rapider increase in rainfall intensity during the first half than during rainfall 589
with the late peak pattern (Figure 2). Even though rainfall intensity 590
decreased in the second half of the period, river flow peaks under the middle 591
peak patterns were still high and the difference between river flow peaks of 592
the early and middle peak rainfall patterns was greater than that between the 593
middle and late peak rainfall patterns. 594
4.3 Impacts of land cover change on river flow peaks under different 595
temporal rainfall patterns 596
Temporal rainfall patterns affected impacts of land-cover change on river 597
flow peaks. Non-uniform rainfall patterns magnified the impact of land-cover 598
change on river flow peaks (for both absolute and relative changes) 599
compared with the uniform rainfall pattern with identical total precipitation 600
depth. Such changes were particularly magnified for land-cover change on 601
sensitive areas (i.e. riparian zones and flat slopes). Among the non-uniform 602
rainfall patterns, land-cover change on the sensitive areas under the middle 603
and late peak rainfalls had greater impacts on river flow peaks (for both 604
relative and absolute differences compared with the baseline land cover) 605
than the early peak rainfall. Under a particular timed pattern of precipitation, 606
there is a particular variation of the overland flow vector field in the 607
catchment including spatial and temporal change of surface water delivery. It 608
could be inferred that the sensitive areas are the key areas for overland flow 609
delivery under the middle and late peak rainfall patterns. This means that 610
protection and restoration of vegetation cover on these areas could bring 611
greater reduction of flood risk under these rainfall patterns. 612
613
4.4 Sensitivity of locations in a catchment to river flow peaks under 614
varying rainfall characteristics 615
The sensitivity of manipulating a location in a catchment to drive change in 616
river flow peaks varies with rainfall characteristics. For instance, bare peat 617
river flow peak under the 30 mm early peak rainfall profile, than bare peat on 619
riparian regions. Further, the ‘most’ sensitive regions for impacting river flow 620
peaks also change under different rainfall depths and patterns. For example, 621
the mid-slope bare strip increased river flow peak by 6.8% which was 622
greater than bare peat on the 3000-cell riparian strip (5.1%). Thus, a new 623
algorithm will be needed to directly locate the most sensitive areas in a 624
catchment under different rainfall characteristics. These most sensitive 625
locations would inform a new understanding of flood risk and its attenuation 626
at a catchment scale. There would be a type of ‘worst case scenario’ rainfall 627
pattern, given a certain rainfall depth for a particular catchment, which could 628
potently interact with the topography and land-cover of the catchment. Under 629
the worst rainfall patterns, vegetation degradation and loss could bring 630
higher river flow peaks and larger flood risk than for other rainfall patterns 631
with same total rainfall; while revegetation would result in a greater reduction 632
to river flow peaks. Hence, a new method is needed to identify generalized 633
sensitive regions with good consideration of the characteristics of the local 634
storm events based on the historical record or future climate scenarios for 635
rainfall in the target catchment. 636
The results of our sensitivity study were based on a small scale catchment, 637
in which hillslope overland flow responses to rainfall was the key component 638
impacted by land cover change. However, for a larger scale catchment, 639
channel flow routing components in the river network may be not negligible 640
(e.g. Bovolo and Bathurst, 2012) and should be considered in future larger 641
scale studies. 642
643
5 Conclusion
644
Using SD-TOPMODEL, our work focussed on a case study catchment 645
demonstrating that there are strong effects on flood peaks of rainfall intensity 646
distributions during a storm and strong interaction effects of these rainfall 647
patterns with spatial land cover configurations. In that sense we believe our 648
findings are generalizable, at least to the case of blanket peat covered 649
catchments that are dominated by shallow water tables and widespread 650
saturation-excess overland flow response. However, future studies could 651
examine the impact of different catchment sizes and topographic 652
configurations on these patterns. 653
Figure 9 summarises the effects on flood peaks that we found for the 655
interaction between rainfall intensity, rainfall pattern, and land cover location. 656
The interaction effects are strong with land-cover change effects being 657
mediated or enhanced by temporal rainfall patterns in non-linear ways. 658
Figure 9 illustrates how under the same rainfall depth, non-uniform rainfall 659
(including early, middle and late rainfall peak patterns) produced higher river 660
flow peaks than uniform rainfall. Late peak rainfall patterns resulted in the 661
highest river flow peaks, while middle peak patterns created larger river flow 662
peaks than early peak patterns. These differences occur because varying 663
rainfall patterns changed the conditions of overland flow delivery and 664
concentration on hillslopes. 665
666
With different rainfall characteristics, land-cover change impacts on river flow 667
peaks were generally in line with the findings of Gao et al. (2016) which was 668
conducted under a single uniform rainfall (i.e. the 1-hr 20 mm hr-1 rainfall). 669
However, the relative differences in effect on flood peaks between the land-670
cover change scenario and the baseline scenario became closer as rainfall 671
intensity increased (i.e. 20 mm hr-1 to 50 mm hr-1, keeping the rainfall 672
duration as 1 hour), while the absolute change became larger with increased 673
rainfall intensity. For non-uniform rainfall, land-cover change impacts on river 674
flow peaks were increased in terms of both absolute and relative changes 675
compared with the uniform rainfall patterns, especially for the cover change 676
on the most sensitive areas - riparian zones and gentle gradient slopes. 677
Moreover, land-cover change on sensitive areas under middle and late peak 678
rainfalls resulted in greater river flow peak changes relative to the land-cover 679
baseline than the flow peak changes under the early peak rainfall. For 680
vegetation restoration in upland peat catchments, the best action is to 681
provide good buffer strips along the waterways, taking particular care to treat 682
flatter areas and any bare patches, in which the more the better but a 10% 683
areal treatment is well worth doing. Under different rainfall characteristics 684
(e.g. intensities and temporal patterns), land-cover change on a same region 685
in a catchment may have very different impacts on river flow peaks. 686
Acknowledgements
688
We thank the Environment Agency of England for provision of discharge and 689
precipitation data for the model parameterization. We thank the North 690
Pennines AONB Partnership for their bare peat map. 691
692
References
693
694
Ballard, C.E., McIntyre, N., Wheater, H.S., Holden, J., Wallage, Z.E., 2011. 695
Hydrological modelling of drained blanket peatland. J. Hydrol., 407(1-696
4): 81-93. DOI:10.1016/j.jhydrol.2011.07.005 697
Bathurst, J.C. et al., 2011a. Forest impact on floods due to extreme rainfall 698
and snowmelt in four Latin American environments 2: Model analysis. 699
J. Hydrol., 400(3-4): 292-304. DOI:10.1016/j.jhydrol.2010.09.001 700
Bathurst, J.C. et al., 2011b. Forest impact on floods due to extreme rainfall 701
and snowmelt in four Latin American environments 1: Field data 702
analysis. J. Hydrol., 400(3-4): 281-291. 703
DOI:10.1016/j.jhydrol.2010.11.044 704
Beven, K., Binley, A., 1992. The future of distributed models - model 705
calibration and uncertainty prediction. Hydrol. Process., 6(3): 279-706
298. DOI:10.1002/hyp.3360060305 707
Beven, K.J., Kirkby, M.J., 1979. A physically-based variable contributing 708
area model of basin hydrology. Hydrol. Sci. Bull., 24: 43-69. 709
Bovolo, C.I., Bathurst, J.C., 2012. Modelling catchment-scale shallow 710
landslide occurrence and sediment yield as a function of rainfall return 711
period. Hydrol. Process., 26(4): 579-596. DOI:10.1002/hyp.8158 712
Dadson, S.J. et al., 2017. A restatement of the natural science evidence 713
concerning catchment-based 'natural' flood management in the UK. 714
Proceedings of the Royal Society a-Mathematical Physical and 715
Engineering Sciences, 473(2199): 19. DOI:10.1098/rspa.2016.0706 716
Dolsak, D., Bezak, N., Sraj, M., 2016. Temporal characteristics of rainfall 717
events under three climate types in Slovenia. J. Hydrol., 541: 1395-718
1405. DOI:10.1016/j.jhydrol.2016.08.047 719
Dunkerley, D., 2012. Effects of rainfall intensity fluctuations on infiltration and 720
runoff: rainfall simulation on dryland soils, Fowlers Gap, Australia. 721
Hydrol. Process., 26(15): 2211-2224. DOI:10.1002/hyp.8317 722
Dunkerley, D., 2014. Stemflow production and intrastorm rainfall intensity 723
variation: an experimental analysis using laboratory rainfall 724
simulation. Earth Surf. Processes Landforms, 39(13): 1741-1752. 725
DOI:10.1002/esp.3555 726
Evans, M., Warburton, J., 2007. The Geomorphology of Upland Peat: 727
Erosion, Form and Landscape Change. Blackwell Publishing, London. 728
Evans, M.G., Burt, T.P., Holden, J., Adamson, J.K., 1999. Runoff generation 729
and water table fluctuations in blanket peat: evidence from UK data 730
spanning the dry summer of 1995. J. Hydrol., 221(3-4): 141-160. 731
Flanagan, D.C., Foster, G.R., Moldenhauer, W.C., 1988. Storm pattern 733
effect on infiltration, runoff, and erosion. Transactions of the Asae, 734
31(2): 414-420. 735
Gallego-Sala, A.V., Prentice, I.C., 2013. Blanket peat biome endangered by 736
climate change. Nat. Clim. Change, 3(2): 152-155. 737
DOI:10.1038/nclimate1672 738
Gao, J., Holden, J., Kirkby, M., 2015. A distributed TOPMODEL for 739
modelling impacts of land-cover change on river flow in upland 740
peatland catchments. Hydrol. Process., 29(13): 2867-2879. 741
DOI:10.1002/hyp.10408 742
Gao, J., Holden, J., Kirkby, M., 2016. The impact of land-cover change on 743
flood peaks in peatland basins. Water Resour. Res., 52: 3477-3492. 744
DOI:10.1002/2015WR017667 745
Gao, J., Holden, J., Kirkby, M., 2017. Modelling impacts of agricultural 746
practice on flood peaks in upland catchments: an application of the 747
distributed TOPMODEL. Hydrol. Process., 31(23): 4206-4216. 748
DOI:10.1002/hyp.11355 749
Grayson, R., Holden, J., Rose, R., 2010. Long-term change in storm 750
hydrographs in response to peatland vegetation change. J. Hydrol., 751
389(3-4): 336-343. DOI:10.1016/j.jhydrol.2010.06.012 752
Holden, J., Burt, T.P., 2002. Infiltration, runoff and sediment production in 753
blanket peat catchments: implications of field rainfall simulation 754
experiments. Hydrol. Process., 16(13): 2537-2557. 755
DOI:10.1002/hyp.1014 756
Holden, J., Burt, T.P., 2003. Runoff production in blanket peat covered 757
catchments. Water Resour. Res., 39(7): 257-271. 758
DOI:10.1029/2002wr001956 759
Holden, J., Evans, M.G., Burt, T.P., Horton, M., 2006. Impact of land 760
drainage on peatland hydrology. J. Environ. Qual., 35(5): 1764-1778. 761
DOI:10.2134/jeq2005.0477 762
Holden, J. et al., 2008. Overland flow velocity and roughness properties in 763
peatlands. Water Resour. Res., 44(6): 663-671. 764
DOI:10.1029/2007wr006052 765
Holden, J. et al., 2015. Impact of prescribed burning on blanket peat 766
hydrology. Water Resour. Res., 51(8): 6472-6484. 767
DOI:10.1002/2014wr016782 768
Holden, J., Rose, R., 2011. Temperature and surface lapse rate change: a 769
study of the UK's longest upland instrumental record. Int. J. Climatol., 770
31(6): 907-919. DOI:10.1002/joc.2136 771
Holstead, K.L., Kenyon, W., Rouillard, J.J., Hopkins, J., Galan-Diaz, C., 772
2017. Natural flood management from the farmer's perspective: 773
criteria that affect uptake. J. Flood Risk Manage., 10(2): 205-218. 774
DOI:10.1111/jfr3.12129 775
Huff, F.A., 1967. Time distribution of rainfall in heavy storms. Water Resour. 776
Res., 3(4): 1007-1019. DOI:10.1029/WR003i004p01007 777
Immirzi, C.P., Maltby, E., Clymo, R.S., 1992. The global status of peatlands 778
and their role in carbon cycling, Dept Geography, University of Exeter. 779
Kirkby, M.J., 1997. TOPMODEL: A personal view. Hydrol. Process., 11(9): 780
1087-1097. DOI:10.1002/(sici)1099-1085(199707)11:9<1087::aid-781
Lane, S.N., Milledge, D.G., 2013. Impacts of upland open drains upon runoff 783
generation: a numerical assessment of catchment-scale impacts. 784
Hydrol. Process., 27(12): 1701-1726. DOI:10.1002/hyp.9285 785
Larmola, T. et al., 2010. The role of Sphagnum mosses in the methane 786
cycling of a boreal mire. Ecology, 91(8): 2356-2365. DOI:10.1890/09-787
1343.1 788
Manley, G., 1942. Meteorological observations on Dun Fell, a mountain 789
station in northern England. Q. J. R. Meteorolog. Soc., 68: 151-165. 790
Parry, L.E., Holden, J., Chapman, P.J., 2014. Restoration of blanket 791
peatlands. J. Environ. Manage., 133: 193-205. 792
DOI:http://dx.doi.org/10.1016/j.jenvman.2013.11.033 793
Price, J.S., 1992. Blanket bog in Newfoundland. Part 2. Hydrological 794
processes. J. Hydrol., 135(1-4): 103-119. DOI:10.1016/0022-795
1694(92)90083-8 796
Quinn, P., Beven, K., Chevallier, P., Planchon, O., 1991. The prediction of 797
hillslope flow paths for distributed hydrological modeling using digital 798
terrain models. Hydrol. Process., 5(1): 59-79. 799
DOI:10.1002/hyp.3360050106 800
Rogger, M. et al., 2017. Land use change impacts on floods at the 801
catchment scale: Challenges and opportunities for future research. 802
Water Resour. Res., 53(7): 5209-5219. DOI:10.1002/2017wr020723 803
SEPA, 2011. Natural Flood Management Handbook. Scottish Environmental 804
Protection Agency, Stirling. 805
Willems, P., 2000. Compound intensity/duration/frequency-relationships of 806
extreme precipitation for two seasons and two storm types. J. Hydrol., 807
233(1-4): 189-205. DOI:10.1016/s0022-1694(00)00233-x 808
Xu, J.R., Morris, P.J., Liu, J.G., Holden, J., 2018. PEATMAP: Refining 809
estimates of global peatland distribution based on a meta-analysis. 810
Catena, 160: 134-140. DOI:10.1016/j.catena.2017.09.010 811
Xue, J., Gavin, K., 2007. Effect of rainfall intensity on infiltration into partly 812
saturated slopes. Geotech. Geol. Eng., 26(2): 199-209. 813
DOI:10.1007/s10706-007-9157-0 814
Yilmaz, A.G., Hossain, I., Perera, B.J.C., 2014. Effect of climate change and 815
variability on extreme rainfall intensity-frequency-duration 816
relationships: a case study of Melbourne. Hydrol. Earth Syst. Sci., 817
18(10): 4065-4076. DOI:10.5194/hess-18-4065-2014 818
Yu, Z.C., Loisel, J., Brosseau, D.P., Beilman, D.W., Hunt, S.J., 2010. Global 819
peatland dynamics since the Last Glacial Maximum. Geophys. Res. 820
Lett., 37. DOI:10.1029/2010gl043584 821
822
Tables
[image:24.595.97.562.133.773.2]824
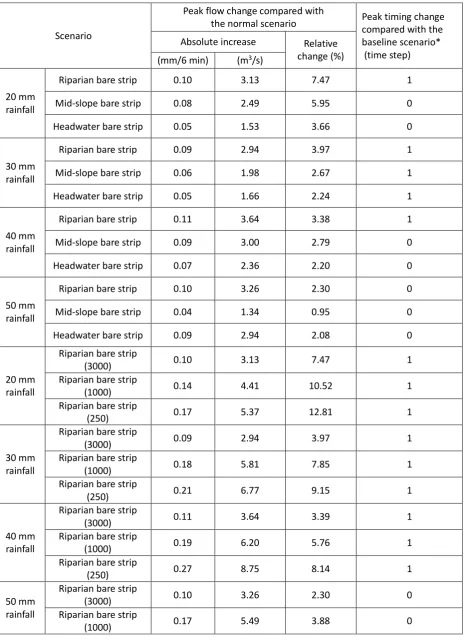
Table 1. Modelling results for land-cover scenario impacts on flood peak 825
under uniform rainfall. 826
S
P P
A R
R
M
H
R
M
H
R
M
H
R
M
H R
R
R
R
R
R
R
R
R
R
R
R S
M S
H S
R S
M S
H S
R S
M S
H S
R S
M S
H S
R S
R S
R S
R S
R S
R S
R S
R S
R S
R S
R S
R S
B
B
B
B
B
B
B
S
S
S
S
S
S
S
S
R
E
R
S
R
E
R
S
R
E
R
S
R
E
R
S
* Positive numbers indicate that the peak is earlier than the baseline scenario, while negative
827
numbers indicate the peak is later than the baseline scenario.
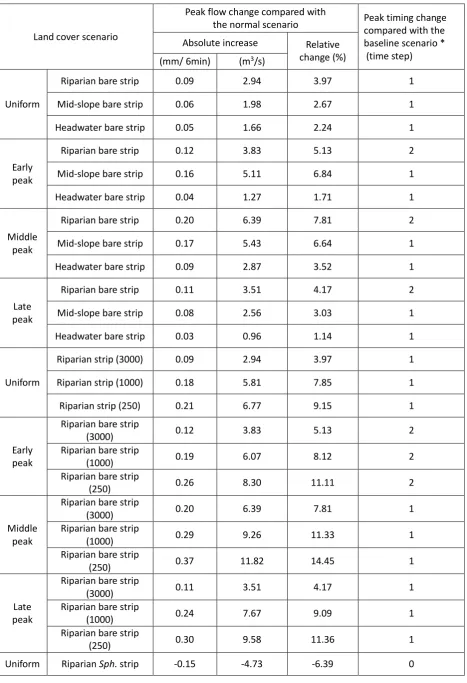
Table 2. Modelling results of land cover scenarios under 30 mm rainfall with 830
varying temporal patterns. 831
L
P P
A R
U
R
M
H
E
R
M
H
M
R
M
H
L
R
M
H
U
R
R
R
E
R
R
R
M
R
R
R
L
R
R
R
M S
H S
E
R S
M S
H S
M
R S
M S
H S
L
R S
M S
H S
U
R S
R S
R S
E
R S
R S
R S
M
R S
R S
R S
L
R S
R S
R S
U B
B
E B
B
M B
L B B
U S
S
E S
S
M S
S
L S
S
U
R
E
R
S
E R E
R
S
M R E
R
S
L R E
R
S
* Positive numbers indicate the peak is earlier than the baseline scenario, while negative numbers
832
indicate the peak is later than the baseline scenario.
833
Figures
835
[image:30.595.121.530.95.394.2]836
Figure 1. Location and map of the Trout Beck catchment. 837
838
Figure 2. Precipitation patterns of the 30 mm rainfall for scenario modelling 839
[image:30.595.130.527.425.670.2]841
Figure 3. The slope position scenarios, the riparian zone scenarios, the 842
steep-gentle slope scenarios and the real bare peat scenario in Trout 843
Beck; (a) riparian strip (3000-cell cumulative area draining to the 844
channel network), (b) riparian strip (1000-cell cumulative area draining 845
to the channel network), (c) riparian strip (250-cell cumulative area 846
draining to the channel network), (d) mid-hillslope strip, (e) headwater 847
strip, (f) steepest slope area, (g) gentlest slope area, (h) bare peat 848
850
Figure 4. Distribution maps of overland flow velocity (a, b, and c) and depth 851
(d, e, and f) for the baseline scenario, the 250-cell bare peat riparian 852
strip scenario, and the 250-cell Sphagnum riparian strip scenario after 853
30mm uniform rainfall (i.e. at time step 21). 854
855
Figure 5. Scenario comparison of the impacts on peak flow under different 856
[image:32.595.103.498.343.671.2]858
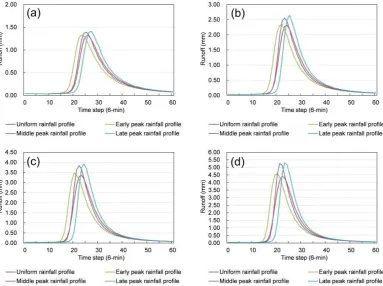
Figure 6. Hydrographs for the baseline land-cover scenario under different 859
precipitation profiles with varying total rainfall depths; (a) 20 mm, (b) 30 860
mm, (c) 40 mm, and (d) 50 mm. 861
862
863
865
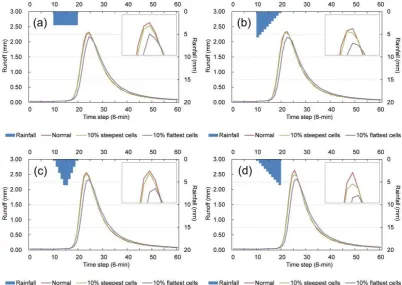
Figure 7. Hydrographs of the slope scenarios (Sphagnum on the 10% 866
steepest areas and on the 10% flattest areas of the catchment) under 867
30 mm rainfall events with different precipitation profiles; (a) uniform 868
rainfall profile, (b) early peak rainfall profile, (c) middle peak rainfall 869
profile, and (d) late rainfall peak profile. Note: the runoff scale of the 870
nested plot focusing on the hydrograph peaks on the upper right corner 871
873
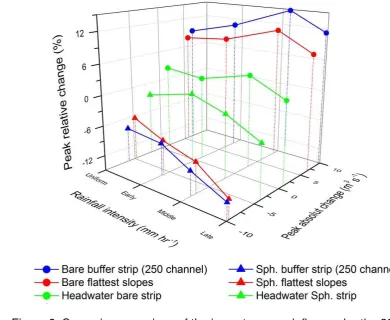
Figure 8. Scenario comparison of the impacts on peak flow under the 30 mm 874
876
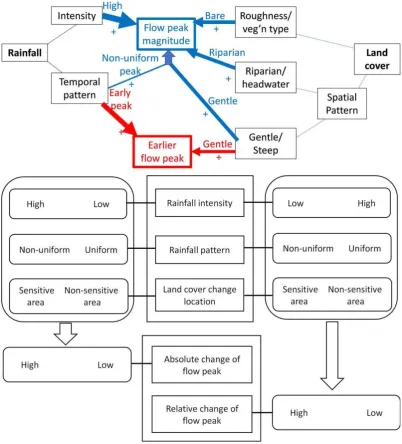
Figure 9. Conceptual diagrams showing the interaction effects of rainfall and 877
land-cover characteristics on peak river flow. 878