Mechanisms underlying extremely fast muscle V
̇
O
2on-kinetics in humans
Bernard Korzeniewski1, Harry B. Rossiter2,3& Jerzy A. Zoladz4 1 BioSimulation Center, Krakow, Poland
2 Rehabilitation Clinical Trials Center, Division of Pulmonary Critical Care Physiology and Medicine, Los Angeles Biomedical Research Institute at Harbor-UCLA Medical Center, Torrance, California
3 Faculty of Biological Sciences, University of Leeds, Leeds, United Kingdom
4 Department of Muscle Physiology, Chair of Physiology and Biochemistry, Faculty of Rehabilitation, University School of Physical Education, Krakow, Poland
Keywords
Computer model, oxygen uptake kinetics, physical exercise, physical training, skeletal muscle.
Correspondence
Bernard Korzeniewski, BioSimulation Center, ul. Filarecka 6/7, 30-110 Krakow, Poland. Tel: +48 501489061
E-mail: [email protected]
Funding Information
This work was supported by Biotechnology and Biological Science Research Council UK research grant (BR/l00162X/1) received by H. B. Rossiter. J. A. Zoladz was supported by the grant of the National Science Centre (NCN) Poland (Project Harmonia DEC-2013/ 08/M/NZ7/00787) and The statutory research project (70/BS/KFiB/2015).
Received: 25 June 2018; Accepted: 2 July 2018
doi: 10.14814/phy2.13808
Physiol Rep, 6 (16), 2018, e13808, https://doi.org/10.14814/phy2.13808
Abstract
The time constant of the primary phase of pulmonary V̇O2 on-kinetics (sp),
which reflects muscle V̇O2 kinetics during moderate-intensity exercise, is
about 30 s in young healthy untrained individuals, while it can be as low as 8 s in endurance-trained athletes. We aimed to determine the intramuscular factors that enable very low values of t0.63 to be achieved (analogous to sp,
t0.63 is the time to reach 63% of the V̇O2 amplitude). A computer model of
oxidative phosphorylation (OXPHOS) in skeletal muscle was used. Muscle t0.63was near-linearly proportional to the difference in phosphocreatine (PCr)
concentration between rest and work (DPCr). Of the two main factors that determine t0.63, a huge increase in either OXPHOS activity (six- to eightfold)
or each-step activation (ESA) of OXPHOS intensity (>3-fold) was needed to reduce muscle t0.63 from the reference value of 29 s (selected to represent
young untrained subjects) to below 10 s (observed in athletes) when altered separately. On the other hand, the effect of a simultaneous increase of both OXPHOS activity and ESA intensity required only a twofold elevation of each to decrease t0.63 below 10 s. Of note, the dependence of t0.63 on OXPHOS
activity and ESA intensity is hyperbolic, meaning that in trained individuals a large increase in OXPHOS activity and ESA intensity are required to elicit a small reduction insp. In summary, we postulate that the synergistic action of
elevated OXPHOS activity and ESA intensity is responsible for extremely low
sp(t0.63) observed in highly endurance-trained athletes.
Introduction
The exponential time constant s of phase 2 of oxygen consumption (V̇O2) on-kinetics in skeletal muscle (i.e.,
the time to reach 63% of the V̇O2 amplitude, termed sp
or t0.63) is the fundamental parameter characterizing the
muscle bioenergetic system (Grassi et al. 1996; Whipp and Rossiter 2005; Zoladz et al. 2014). During
moderate-intensity (i.e., below the lactate threshold) whole-body exercise such as cycling, muscle V̇O2 on-kinetics is well
reflected by the time constant of phase 2 pulmonary V̇O2
on-kinetics (sp) (Grassi et al. 1996). In young healthy
untrained individuals during moderate-intensity exercise
sp approximately ranges 25–40 s (Whipp and Rossiter
(Barstow and Mole 1991; Jones and Koppo 2005; Zoladz et al. 2005). In patients with cardiopulmonary diseases, both or either oxygen delivery and muscle oxygen extrac-tion may be compromised during the first minutes of exercise, with the result that pulmonary sp can exceed
60 s (Grassi et al. 2011). Pathologically slow kinetics is predictive of poor prognosis (Schalcher et al. 2003). Pul-monary phase 2 V̇O2 kinetics is also slow in
mitochon-drial diseases and McArdle’s disease (Grassi et al. 2009), where oxidative phosphorylation (OXPHOS) activity is compromised.
Several animal-based and human experiments have supported the notion that muscle V̇O2on-kinetics during
moderate-intensity exercise in healthy young subjects is not limited by convective or diffusive oxygen delivery (Grassi et al. 1998; Bangsbo et al. 2000; Grassi 2005; Nyberg et al. 2014; Richardson et al. 2015). Most of the available experimental evidence suggests that muscle V̇O2
on-kinetics is mainly controlled or limited by intramuscu-lar factors related to metabolic activation (Grassi et al. 2011; Rossiter 2011; W€ust et al. 2011; Poole and Jones 2012). However, the factors determining the value of musclespare not fully understood.
Previous theoretical studies demonstrated that two main factors determine muscle V̇O2 on-kinetics:
OXPHOS activity and each-step activation (ESA) inten-sity (Korzeniewski and Zoladz 2004). ESA was proposed as the main mechanism responsible for the regulation of OXPHOS during work transitions in skeletal muscle and heart (Korzeniewski 1998, 2007, 2017; Zoladz et al. 2013, 2014; Korzeniewski and Rossiter 2015). This mech-anism was first named “parallel activation” (Korze-niewski 1998), but afterwards renamed “each-step activation” in order to avoid confusion with other mechanisms involving simultaneous activation of ATP usage and ATP supply (Korzeniewski 2007; Korzeniewski and Rossiter 2015). A parallel activation of ATP usage and ATP supply block in general was first proposed by Hochachka (1994). On the basis of theoretical studies, ESA is characterized by direct activation of all OXPHOS complexes (complex I, complex III, complex IV, ATP synthase, ATP/ADP carrier, and Pi carrier), the NADH
supply block, and glycolysis, in parallel with the activa-tion of ATP usage during rest-to-work or low-to-high work transitions.
These computational simulations showed that muscle V̇O2 on-kinetics, using values typical of healthy young
subjects, could be reasonably predicted on the basis of the known biochemical properties and the difference between resting and exercising PCr concentration (DPCr) (Korze-niewski and Zoladz 2004). However, these simulations interrogated only a relatively narrow range of OXPHOS activity and ESA intensity, and only the independent
effects of either OXPHOS activity or ESA intensity were studied; not the synergistic effect of both these factors acting simultaneously.
Muscle mitochondrial volume (density) is about twofold greater in highly trained individuals (e.g., V̇O2max
70–80 mL min 1 kg 1) compared to average young healthy untrained individuals (V̇O2max 40–50 mL
min 1 kg 1) (Hoppeler et al. 1973). A more recent study (Larsen et al. 2012) found a ~3-fold range of muscle mitochondrial volume (density) by transmission electron microscopy, OXPHOS complex concentration by protein quantification, and OXPHOS activity by respirometry, in a group of individuals with V̇O2max ranging 30–
72 mL min 1kg 1.
We therefore studied the effect of large changes in OXPHOS activity and ESA intensity on DPCr and mus-cle t0.63 to determine the skeletal muscle bioenergetic
system characteristics required to elicit very low sp
val-ues observed in athletes. Both the separate effect of each factor and the synergistic effect of each acting simultane-ously were analyzed. It was hypothesized that a huge increase in either OXPHOS activity or ESA intensity sep-arately is necessary to decrease muscle t0.63 below 10 s,
while only a moderate increase is sufficient when the magnitudes of both factors are elevated simultaneously. It was also hypothesized that the dependence of muscle t0.63 on OXPHOS activity (kOX) and ESA intensity
(AOX) is hyperbolic rather than linear, and therefore t0.63
would be much more sensitive to changes in kOX and AOX at low kOX and AOX values, than at high kOX and
AOXvalues.
Theoretical Methods
Computer model
The well-tested computer model of OXPHOS and the entire bioenergetic system in intact skeletal muscle was used in the simulations carried out in this study (Korzeniewski and Zoladz 2001; Korzeniewski and Liguzinski 2004). This model comprises explicitly NADH supply block (TCA cycle, fatty-acid b-oxidation, MAS, etc.), particular OXPHOS complexes (complex I, complex III, complex IV, ATP synthase, ATP/ADP car-rier, and Pi carrier), proton leak through the inner
Computer simulations
The two main parameters used in this study can be defined as follows. Relative OXPHOS activity (kOX) is the unitless basal value of the rate constants of all OXPHOS complexes expressed relative to 1 in the refer-ence (standard) state. kOX is the relative OXPHOS activ-ity in the absence of ESA. ESA intensactiv-ity (AOX) is the
unitless fold increase in the values of the rate constants of all OXPHOS complexes during rest-to-work transition equal to 4.5 in the reference (standard) state. Therefore, kOX is the relative OXPHOS activity at rest and kOX9AOX is the relative OXPHOS activity during
work. Neither kOX, constituting the relative rate constant of OXPHOS at rest, nor kOX9 AOX, representing the
relative rate constant of OXPHOS during work, is equiva-lent to the absolute flux of muscle oxygen consumption (V̇O2, or its equivalent ATP synthesis flux) expressed in
mmol/L min 1. V̇O2 depends not only on absolute
OXPHOS activity (rate constant) but also on metabolite concentrations, for example, of ADP and Pi. kOX is, of
course, related to mitochondrial density as well as to the concentration and activity of OXPHOS complex enzymes. Moderate exercise was analyzed in this study, in which the activity of ATP usage was 30 times higher than at rest. This rate is anticipated to be approximately equivalent to about 30–35% of the muscle V̇O2max measured during
cycle ergometry. This corresponds to about 40% of the pulmonary V̇O2max during cycling. The exact work
inten-sity applied is of minor importance, asspdepends little on
work intensity in constant-power exercise (Poole and Jones 2005). The reference state used for the simulations corresponded to that of young healthy untrained people (with pulmonary V̇O2max =40–50 mL min 1kg 1 and
sp=29.2 s) (e.g., Hoppeler et al. 1973; Rossiter 2011).
The standard OXPHOS activity appearing in the model (the reference state) is indicated as “kOX * 1”, that is, onefold of the standard OXPHOS activity increase. In order to obtain muscle t0.63 equal to about 30 s during
moderate work for the reference state, an ESA intensity (AOX) equal to 4.5 was required. In this reference state the
muscle V̇O2 =3.62 mmol/L min 1, resting
PCr =27.74 mmol/L,DPCr =10.80 mmol/L, and muscle t0.63 =29.2 s.
In subsequent simulations either OXPHOS activity or ESA intensity was changed separately, or both were chan-ged simultaneously. An n-fold increase in the resting (without ESA) OXPHOS activity (kOX*n) was equivalent to an n-fold increase in resting rate constants of all OXPHOS complexes and NADH supply (kC1, kC3, kC4,
kSN, kEX, kPI, and kDH). The resting OXPHOS activity
was either increased (n >1) or decreased (n <1) in rela-tion to the reference state. Proton leak activity was not
changed, as it was assumed that the increase in the pro-ton leak activity related to the twofold greater mitochon-drial volume between the reference state (young healthy untrained) and the endurance-trained state (with pul-monary V̇O2max above 70 mL min 1 kg 1 and sp<10 s)
is compensated by a training-induced twofold decrease in proton leak intensity per mitochondrial volume. This assumption is partly based on experimental data illustrat-ing the magnitude of the endurance trainillustrat-ing-induced mitochondrial biogenesis and oxidative capacity, was accompanied by a decrease in mitochondrial uncoupling, including uncoupling protein-mediated proton leak stud-ied in rat skeletal muscle mitochondria (Zoladz et al. 2016). A particular value of ESA intensity (AOX) meant
that the rate constants of all OXPHOS complexes and NADH supply (kC1, kC3, kC4, kSN, kEX, kPI, and kDH) were
elevated AOX times during rest-to-work transitions. AOX
was either increased (AOX>4.5) or decreased
(AOX<4.5) in relation to the reference state.
Results of Simulations
This is a purely theoretical work and does not involve experiments on humans or animals.
Figure 1 demonstrates that muscle t0.63 had a
near-lin-ear dependence on the difference between PCr at rest and during exercise (DPCr). This relationship was indepen-dent of whether DPCr was changed through a change in the resting OXPHOS activity (kOX), that is, without ESA, or through a change in ESA intensity (AOX). However,
when the resting OXPHOS activity and ESA intensity were modified separately, a huge increase in these param-eter values was necessary in order to diminish musclet0.63
significantly from the reference state value of 29.2 s. Specifically, an approximate sixfold increase in resting OXPHOS activity was required in order to decrease mus-cle t0.63to 10 s and an eightfold increase was necessary to
reach muscle t0.63=8 s. Alternatively, it was necessary
to increase ESA intensity 3.1-fold (from AOX= 4.5 to
AOX=14) to diminish musclet0.63to 8 s.
Both resting (without ESA) OXPHOS activity and ESA intensity affect the overall OXPHOS activity during mus-cle work. However, resting OXPHOS activity affects the resting PCr concentration, while ESA intensity does not: AOX acts only during muscle work. This is why the
for-mer must be elevated eightfold and the latter only 3.1-fold in order to evoke the same decrease in muscle t0.63
(to 8 s). An increase in resting OXPHOS activity demands an elevation in resting PCr concentration. This in turn requires an increased DPCr and thus slows down muscle t0.63. Therefore, a relatively high increase in the
case of increasing ESA intensity, and therefore adjusting ESA intensity was more effective in decreasing t0.63 than
an adjustment in resting (without ESA) OXPHOS activ-ity.
The requirement for a huge increase in resting (without ESA) OXPHOS activity and, to a lesser extent, ESA inten-sity could be avoided by using the synergistic effect of a simultaneous increase in the magnitude of both factors together. This is demonstrated in Figure 2. A parallel twofold increase in resting (without ESA) OXPHOS activ-ity (kOX) and ESA intensactiv-ity (AOX) (increasing AOXfrom
4.5 to 9) leads to a decrease of muscle t0.63 from 29 s in
the reference state to 9 s in the “activated” state. There-fore, the synergistic effect of increasing both resting OXPHOS activity and ESA intensity was very effective in decreasing thet0.63of muscle V̇O2.
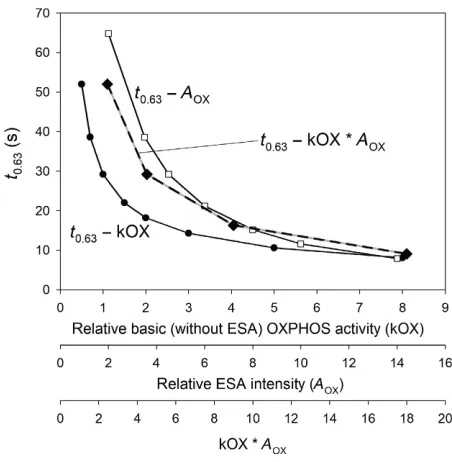
Simulated dependence of musclet0.63on relative
refer-ence OXPHOS activity (kOX), relative ESA intensity (AOX), and the product of kOX and AOX is essentially
hyperbolic. This is demonstrated in Figure 3. These dependencies are extracted from Figures 1 and 2.
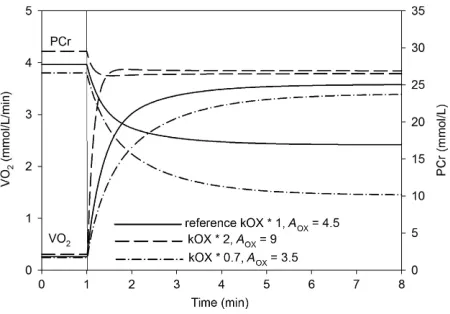
The fact that DPCr between rest and work is strictly related to muscle t0.63 is illustrated in Figure 4. One can
see that when both resting OXPHOS activity and ESA intensity are elevated in relation to the reference state,
DPCr is much smaller and V̇O2 kinetics is speeded
com-pared with the reference state. On the other hand, when the magnitudes of both factors are decreased,DPCr is sig-nificantly greater and V̇O2 kinetics is significantly slowed
in relation to the reference state.
Discussion
[image:4.612.320.546.68.240.2]This theoretical intramuscular study demonstrates that: (1) both an increase in resting (without ESA) OXPHOS activity and ESA intensity can significantly accelerate the muscle
[image:4.612.74.300.69.243.2]Figure 1. Simulated dependence of the time to reach 63% of the muscle V̇O2amplitude (t0.63) on the difference between PCr during work and rest (DPCr).DPCr was modified either by an increase/ decrease in resting OXPHOS activity (kOX) without a change in ESA intensity (AOX), or by an increase/decrease inAOXin relation to the reference state (young, healthy, untrained individuals).
[image:4.612.319.545.329.560.2]Figure 2.The simulated synergistic effect of a simultaneous increase/decrease in both resting (without ESA) OXPHOS activity and ESA intensity on the relationship between musclet0.63and DPCr. Resting OXPHOS activity (kOX) and ESA intensity (AOX) are changed in parallel in relation to the reference state (young, healthy, untrained individuals).
V̇O2on-kinetics (reducet0.63); (2) musclet0.63is
near-line-arly proportional to the difference in the PCr concentration between work and rest (DPCr); (3) the musclet0.63 DPCr
dependence is identical regardless of whetherDPCr is chan-ged through an increase in OXPHOS activity or through an increase in ESA intensity; (4) when the magnitudes of OXPHOS activity or in ESA intensity are increased sepa-rately, a huge increase in resting OXPHOS activity (six- to eightfold) or ESA intensity (>3-fold) is necessary to decrease the muscle t0.63 from 29 s in the reference state
(young healthy individuals) to 8 s (as observed in the extreme endurance-trained state); (5) the required increas-ing restincreas-ing OXPHOS activity of >6-fold to decrease the musclet0.63to<10 s exceeds greatly the observed increases
with endurance training in muscle mitochondrial volume (density) of two- to threefold; and (6) a synergistic effect of a simultaneous increase in resting OXPHOS activity and ESA intensity together requires only twofold increases in the magnitudes of these factors to decreaset0.63from 29 to
8 s. Therefore, we postulate that the very shortsp(t0.63) of
the muscle and pulmonary V̇O2on-kinetics encountered in
very highly endurance-trained athletes are due to a high mitochondrial volume (density) related to high (resting) OXPHOS activity as well as a high ESA intensity. Each can result from both genetic factors (interindividual differ-ences) and endurance training.
It is demonstrated that the dependence of the muscle t0.63 on OXPHOS activity and ESA intensity is essentially
hyperbolic, as shown in Figure 3. A hyperbolic relation-ship between t0.63 and whole-body V̇O2max in different
mammal species was previously described (Poole and Jones 2012). Here, we show that, in the context of muscle V̇O2, independent of oxygen delivery, this hyperbolic
rela-tionship is anticipated with training-induced increases in OXPHOS activity and ESA intensity alone, even in the absence of increased mitochondrial volume (density). This implies that a training-induced increase in mitochondrial biogenesis and/or ESA intensity above the reference state would decrease sp only moderately (e.g., Zoladz et al.
2013), while a decrease in OXPHOS activity and/or ESA intensity, related to, for example, muscular decondition-ing, enzyme deficiencies, or mitochondrial diseases, can lengthen sp very significantly. This theoretical prediction
confirms experimental data from single frog muscle cells over a wide range of OXPHOS capacities (W€ust et al. 2013) and from endurance-trained humans (Jones and Koppo 2005) or humans with metabolic mitochondrial myopathies (Grassi et al. 2009).
Mitochondrial volume (density) is about two- to three-fold different between untrained individuals with pul-monary V̇O2max of ~30 mL min 1 kg 1 (Larsen et al.
2012), average young healthy individuals within the refer-ence range used for this study (40–50 mL min 1kg 1; Hoppeler et al. 1973), and after endurance training or in elite athletes with pulmonary V̇O2max 70–80 mL
min 1kg 1 (Larsen et al. 2012). Zoladz et al. (2013) showed, based on muscle biopsy of the vastus lateralis, that moderate-intensity endurance training (85% of the total training performed below the LT, in this case ~50% V̇O2max, and only 15% at midway between the lactate
threshold and V̇O2max), lasting 5 weeks (four sessions of
cycling per week; 40 min per session), significantly accel-erates the primary phase of the pulmonary V̇O2
on-kinetics (by about 25%) in humans in the absence of any changes in the markers of mitochondrial biogenesis such as the level of peroxisome proliferator-activated receptor
c coactivator 1a (PGC1 a), mitochondrial DNA copy number, cytochrome c, and cytochrome oxidase subunit I contents. This presupposes that the alterations in the muscle biopsy reflect the action of the endurance training on the activated muscle during moderate-intensity cycling. If it does, it would support the postulate, based on computer simulations, that the training-induced accel-eration of the V̇O2on-kinetics observed during
moderate-intensity cycling, accompanied by no signs of elevated OXPHOS activity, could be explained by a training-induced intensification of ESA (Zoladz et al. 2013). In other words, physical training first induces the increase in ESA intensity (AOX), which is followed by mitochondrial
[image:5.612.67.292.68.225.2]biogenesis (providing an increase in OXPHOS activity, kOX). Similarly, prolonged moderate-intensity endurance training, lasting 20 weeks (four sessions per week; 40 min per session), which speeded phase 2 pulmonary V̇O2 Figure 4. Simulated time course of muscle V̇O2and PCr during a
rest-to-moderate work transition for the reference state (solid line), parallel twofold increase in the resting (without ESA) OXPHOS activity (kOX) and ESA intensity (AOX) (dashed line), and parallel decrease in the resting OXPHOS activity (to 70% of the reference value) and in ESA intensity (to 78% of the reference value) (dash-dot line). The reference values are for young, healthy, untrained individuals (pulmonary V̇O2max=40–50 mL min 1kg 1and
on-kinetics by about 19% was accompanied by no signifi-cant changes in the maximal COX activity in the muscle vastus lateralis (Zoladz et al. 2014). It was concluded based on the theoretical studies described therein (Zoladz et al. 2014) that the most likely explanation was a train-ing-induced intensification of each-step parallel activation (ESA) of OXPHOS that occurred before elevated mito-chondrial biogenesis.
Some studies have postulated a significant role of O2
delivery (Murias et al. 2014) and/or of the uniformity of matching between intramuscular O2 delivery and O2
uti-lization (Koga et al. 2014) in determining the rate of V̇O2
on-kinetics. However, several experimental studies in ani-mal models and humans have failed to show a limitation of oxygen transport to muscle for V̇O2on-kinetics during
transition to exercise, at least during exercise of moderate intensity (Grassi et al. 1998; Bangsbo et al. 2000; Grassi 2005; Nyberg et al. 2014; Richardson et al. 2015).
In our study, the rate of the muscle V̇O2 on-kinetics
during rest-to-work transition is expressed by the time to reach 63% of the V̇O2 amplitude (t0.63). This parameter
does not require the V̇O2 on-kinetics to be strictly
expo-nential, although the simulated V̇O2 on-kinetics is near
exponential (Fig. 4). It was argued previously (Korze-niewski and Zoladz 2006) that the behavior of the muscle V̇O2time course during the rest-to-work transition is not
perfectly exponential, as it is slightly faster at the very beginning of exercise due to ESA. Such a very fast increase in V̇O2 during first seconds of exercise can be
seen in some animal (Zoladz et al. 2008; W€ust et al. 2011) and human studies (Chung et al. 2005), which con-firms the ESA hypothesis. However, this effect is complex to interpret in pulmonary V̇O2 because of the action of
the phase 1 on-kinetics kinetics, which is manifest at the lung and not at the muscle. On the other hand, Hogan (2001) encountered a lag in the fall of intracellular PO2
after the onset of contractions in single Xenopus muscle fibers, suggesting a lag in the V̇O2 increase. It has been
demonstrated in simulation and by direct experiment that the phase 2 pulmonary V̇O2 time course also deviates
from a “pure” exponential response, albeit very subtly (Benson et al. 2013, 2017). Therefore, the muscle t0.63
variable reported here is very closely related, but not strictly identical, to the frequently used parameter describing the pulmonary V̇O2 on-kinetics, called time
constant of the phase 2 (or primary phase) of this kinetics (sp) (Barstow and Mole 1991; Scheuermann et al. 2001;
Whipp and Rossiter 2005). Pulmonary V̇O2 kinetics can
deviate significantly from the muscle V̇O2 kinetic
response due to the influence of the dynamics of the cir-culation and the intervening venous blood and pul-monary gas volumes between the muscle cell and the pulmonary V̇O2 measurement (Benson et al. 2013).
However, it should be stressed that any difference between t0.63 and s of muscle V̇O2 in our simulations is
disappearingly small and of little functional importance. Muscle t0.63 is nearly linearly proportional to DPCr
between work and rest, as demonstrated in Figure 1. This is in agreement with the results of the experiments by Barstow et al. (1994) and Phillips et al. (1995). Therefore, the rate of the V̇O2 on-kinetics reflects the magnitude of
disturbances in muscle metabolic stability during rest-to-work transition (compare also Fig. 4). The extremely fast pulmonary V̇O2 on-kinetics (sp<10 s) observed in top
class endurance athletes (Barstow and Mole 1991; Jones and Koppo 2005; Zoladz et al. 2005), reflecting very high metabolic stability (Korzeniewski and Zoladz 2004), should be considered as a sign of very high resistance to fatigue during high-intensity exercise (Murgatroyd et al. 2011; for review see Grassi et al. 2015; Keir et al., 2016).
A moderate work intensity (30–35% of the muscle V̇O2max, about 40% of the pulmonary V̇O2max) was used
in order to avoid the slow component of the V̇O2
on-kinetics. There is considerable evidence to support that O2 delivery is not limiting at this exercise intensity. In
constant-power exercise pulmonary sp depends little on
work intensity: pulmonary sp increases on average by
about 20% between moderate and heavy exercise (see Poole and Jones 2005; for review of over 20 experimental studies). Theoretical studies, concerning muscle sp (t0.63),
confirmed these experimental findings (Korzeniewski 2018). Computer simulations predicted that muscle t0.63
was approximately constant for different work intensities in constant-power exercise, and decreased noticeably only at lowest work intensities.
Of course, this theoretical study and the computer model used have several limitations. Every model consti-tutes, at best, only an approximation and simplification of the complex reality. We cannot prove that the mecha-nism proposed by us is entirely responsible for the extre-mely fast V̇O2 on-kinetics in top athletes, rather we
provide a quantitative argument for a plausible explana-tion. The role of other factors, for instance, limitations of O2transport and diffusion, cannot be excluded, although
they seem not to be important during moderate exercise in healthy individuals. The estimation of some variables is only approximate, for example, differences in mitochon-drial volume and OXPHOS activity between extreme indi-viduals and reference indiindi-viduals. Nevertheless, these restrictions do not seem to change the general conclu-sions of our simulations.
Conclusions
phase of the pulmonary and muscle V̇O2 on-kinetics,
encountered in highly endurance-trained athletes, repre-senting very high metabolic stability during exercise, results from the synergistic action of a high resting (with-out ESA) OXPHOS activity related to high mitochondrial volume (density) and high each-step activation (ESA) of OXPHOS intensity. The dependence of muscle sp on
OXPHOS activity and/or ESA intensity is hyperbolic. For this reason, it is difficult to further reduce spby training
in well-trained individuals, while spis greatly lengthened
when OXPHOS activity is compromised in mitochondrial diseases.
Conflict of Interest
None declared.
References
Bangsbo, J., P. Krustrup, J. Gonzalez-Alonso, R. Boushel, and
B. Saltin. 2000. Muscle oxygen kinetics at onset of intense dynamic exercise in humans.. Am. J. Physiol. Regul. Integr.
Comp. Physiol. 279:R899–R906.
Barstow, T. J., and P. A. Mole. 1991. Linear and nonlinear
characteristics of oxygen uptake kinetics during heavy
exercise. J. Appl. Physiol. 71:2099–2106.
Barstow, T. J., S. Buchthal, S. Zanconato, and D. M. Cooper. 1994. Muscle energetics and pulmonary oxygen uptake
kinetics during moderate exercise. J. Appl. Physiol. 77:1742–
1749.
Benson, A. P., B. Grassi, and H. B. Rossiter. 2013. A validated model of oxygen uptake and circulatory dynamic
interactions at exercise onset in humans. J. Appl. Physiol.
115:743–755. https://doi.org/10.1152/japplphysiol.00184.
2013.
Benson, A. P., T. S. Bowen, C. Ferguson, S. R. Murgatroyd, and H. B. Rossiter. 2017. Data collection, handling, and fitting strategies to optimize accuracy and precision of oxygen uptake kinetics estimation from breath-by-breath
measurements. J. Appl. Physiol. 123:227–242. https://doi.
org/10.1152/japplphysiol.00988.2016.
Chung, Y., P. A. Mole, N. Sailasuta, T. K. Tran, R. Hurd, and
T. Jue. 2005. Control of respiration and bioenergetics during
muscle contraction. Am. J. Physiol.-Cell Physiol. 288:C730–
C738.
Grassi, B. 2005. Delayed metabolic activation of oxidative phosphorylation in skeletal muscle at exercise onset. Med.
Sci. Sports Exerc. 37:1567–1573.
Grassi, B., D. C. Poole, R. S. Richardson, D. R. Knight, B. K.
Erickson, and P. D. Wagner. 1996. Muscle O2uptake
kinetics in humans: implications for metabolic control. J.
Appl. Physiol. 80:988–998.
Grassi, B., L. B. Gladden, M. Samaja, C. M. Stary, and M. C.
Hogan. 1998. Faster adjustment of O2delivery does not
affect V̇O2on-kinetics in isolated in situ canine muscle. J.
Appl. Physiol. 85:1394–1403.
Grassi, B., S. Porcelli, M. Marzorati, F. Lanfranconi, P. Vago, C. Marconi, et al. 2009. Metabolic myopathies: functional evaluation by analysis of oxygen uptake kinetics. Med. Sci.
Sports Exerc. 41:2120–2127. https://doi.org/10.1249/MSS.0b
013e3181aae96b.
Grassi, B., S. Porcelli, D. Salvadego, and J. A. Zoladz. 2011.
Slow V̇O₂kinetics during moderate-intensity exercise as
markers of lower metabolic stability and lower exercise
tolerance. Eur. J. Appl. Physiol. 111:345–355. https://doi.org/
10.1007/s00421-010-1609-1.
Grassi, B., H. B. Rossiter, and J. A. Zoladz. 2015. Skeletal muscle fatigue and decreased efficiency: two sides of the
same coin? Exerc. Sport Sci. Rev. 43:75–83. https://doi.org/
10.1249/JES.0000000000000043. Review.
Hochachka, P. 1994. Muscles as metabolic machines. CRC Press, Boca Raton.
Hogan, M. C. 2001. Fall in intracellular PO2at the onset of
contractions in Xenopus single skeletal muscle fibers. J.
Appl. Physiol. 90:1871–1876.
Hoppeler, H., P. L€uthi, H. Claassen, E. R. Weibel, and H.
Howald. 1973. The ultrastructure of the normal human skeletal muscle. A morphometric analysis on untrained men,
women and well-trained orienteers. Pflugers Arch. Eur. J.€
Physiol. 344:217–232.
Jones, A. M., and K. Koppo. 2005. Effect of training on V̇O2
kinetics and performance. Pp. 373–397 in A. M. Jones and
D. C. Poole, eds. Oxygen uptake kinetics in sport, exercise and medicine. Routledge Book Company (Taylor and Francis Group), London.
Keir, D. A., A. P. Benson, L. K. Love, T. C. Robertson, H. B. Rossiter, and J. M. Kowalchuk. 2016. Influence of muscle
metabolic heterogeneity in determining the V̇O2pkinetic
response to ramp-incremental exercise. J. Appl. Physiol.
120:503–513.
Koga, S., H. B. Rossiter, I. Heinonen, T. I. Musch, and D. C. Poole. 2014. Dynamic heterogeneity of exercising muscle
blood flow and O2utilization. Med. Sci. Sports Exerc.
46:860–876. https://doi.org/10.1249/MSS.0000000000000178.
Korzeniewski, B. 1998. Regulation of ATP supply during muscle contraction: theoretical studies. Biochem. J.
330:1189–1195.
Korzeniewski, B. 2007. Regulation of oxidative phosphorylation
through parallel activation. Biophys. Chem. 129:93–110.
Korzeniewski, B. 2017. Regulation of oxidative phosphorylation through each-step activation (ESA): evidences from computer modeling. Prog. Biophys. Mol.
Biol. 125:1–23. https://doi.org/10.1016/j.pbiomolbio.2016.12.
001.
Korzeniewski, B. 2018. Regulation of oxidative
Korzeniewski, B., and P. Liguzinski. 2004. Theoretical studies on the regulation of anaerobic glycolysis and its influence on oxidative phosphorylation in skeletal muscle. Biophys.
Chem. 110:147–169.
Korzeniewski, B., and H. B. Rossiter. 2015. Each-step activation of oxidative phosphorylation is necessary to explain muscle metabolite kinetic responses to exercise and
recovery in humans. J. Physiol. 593:5255–5268. https://doi.
org/10.1113/JP271299.
Korzeniewski, B., and J. A. Zoladz. 2001. A model of oxidative phosphorylation in mammalian skeletal muscle. Biophys.
Chem. 92:17–34.
Korzeniewski, B., and J. A. Zoladz. 2004. Factors determining
the oxygen consumption rate (V̇O2) on-kinetics in skeletal
muscle. Biochem. J. 379:703–710.
Korzeniewski, B., and J. A. Zoladz. 2006. Biochemical
background of the V̇O2on-kinetics in skeletal muscles. J.
Physiol. Sci. 56:1–12.
Larsen, S., J. Nielsen, C. N. Hansen, L. B. Nielsen, F. Wibrand, N. Stride, et al. 2012. Biomarkers of mitochondrial content in skeletal muscle of healthy young human subjects. J.
Physiol. 590:3349–3360. https://doi.org/10.1113/jphysiol.
2012.230185
Murgatroyd, S. R., C. Ferguson, S. A. Ward, B. J. Whipp, and
H. B. Rossiter. 2011. Pulmonary O2uptake kinetics as a
determinant of high-intensity exercise tolerance in humans.
J. Appl. Physiol. 110:1598–1606. https://doi.org/10.1152/ja
pplphysiol.01092.2010.
Murias, J. M., M. D. Spencer, and D. H. Paterson. 2014. The
critical role of O2provision in the dynamic adjustment of
oxidative phosphorylation. Exerc. Sport Sci. Rev. 42:4–11.
https://doi.org/10.1249/JES.0000000000000005.
Nyberg, M., P. M. Christensen, S. P. Mortensen, Y. Hellsten, and J. Bangsbo. 2014. Infusion of ATP increases leg oxygen delivery but not oxygen uptake in the initial phase of intense
knee-extensor exercise in humans. Exp. Physiol. 99:1399–
1408. https://doi.org/10.1113/expphysiol.2014.081141. Phillips, S. M., H. J. Green, M. J. MacDonald, and R. L.
Hughson. 1995. Progressive effect of endurance training on
V̇O2kinetics at the onset of submaximal exercise. J. Appl.
Physiol. 79:1914–1920.
Poole, D. C., and A. M. Jones. 2005. Towards an
understanding of the mechanistic bases of V̇O2kinetics. Pp.
294–328 in A. M. Jones and D. C. Poole, eds. Oxygen
uptake kinetics in sport, exercise and medicine. Routledge Book Company (Taylor and Francis Group), London. Poole, D. C., and A. M. Jones. 2012. Oxygen uptake kinetics.
Compr. Physiol. 2:933–996. https://doi.org/10.1002/cphy.c
100072.
Richardson, R. S., C. Wary, D. W. Wray, J. Hoff, H. B. Rossiter, G. Layec, et al. 2015. MRS Evidence of adequate
O₂supply in human skeletal muscle at the onset of exercise.
Med. Sci. Sports Exerc. 47:2299–2307. https://doi.org/10.
1249/mss.0000000000000675
Rossiter, H. B. 2011. Exercise: kinetic considerations for gas
exchange. Compr. Physiol. 1:203–244. https://doi.org/10.
1002/cphy.c090010.
Schalcher, C., H. Rickli, M. Brehm, D. Weilenmann, E. Oechslin, W. Kiowski, et al. 2003. Prolonged oxygen uptake kinetics during low-intensity exercise are related to poor prognosis in patients with mild-to-moderate congestive
heart failure. Chest 124:580–586.
Scheuermann, B. W., B. D. Hoelting, M. L. Noble, and T. J.
Barstow. 2001. The slow component of O2uptake is not
accompanied by changes in muscle EMG during repeated
bouts of heavy exercise in humans. J. Physiol. 531:245–256.
Whipp, B. J., and H. B. Rossiter. 2005. The kinetics of oxygen uptake. Physiological inferences from the parameters. Pp.
62–94 in A. M. Jones, D. C. Poole, eds. Oxygen uptake
kinetics in sport, exercise and medicine. Routledge Book Company (Taylor and Francis Group), London.
Wust, R. C., B. Grassi, M. C. Hogan, R. A. Howlett, L. B.€
Gladden, and H. B. Rossiter. 2011. Kinetic control of oxygen consumption during contractions in self-perfused
skeletal muscle. J. Physiol. 589:3995–4009. https://doi.org/10.
1113/jphysiol.2010.203422.
Wust, R. C. I., W. J. van der Laarse, and H. B. Rossiter. 2013.€
On-off asymmetries in oxygen consumption kinetics of
singleXenopus laevisskeletal muscle fibers suggest
higher-order control. J. Physiol. 591:731–744. https://doi.org/10.
1113/jphysiol.2012.241992.
Zoladz, J. A., Z. Szkutnik, K. Duda, J. Majerczak, and B. Korzeniewski. 2005. Preexercise metabolic alkalosis induced
via bicarbonate ingestion accelerates VO2kinetics at the
onset of a high-power-output exercise in humans. J. Appl.
Physiol. 1985:895–904.
Zoladz, J. A., L. B. Gladden, M. C. Hogan, Z. Nieckarz, and B. Grassi. 2008. Progressive recruitment of muscle fibers is not
necessary for the slow component of V̇O2kinetics. J. Appl.
Physiol. 1985:575–780. https://doi.org/10.1152/japplphysiol.
01129.2007.
Zoladz, J. A., B. Grassi, J. Majerczak, Z. Szkutnik, M.
Korostynski, J. Karasinski, et al. 2013. Training-induced
acceleration of O2uptake on-kinetics precedes muscle
mitochondrial biogenesis in humans. Exp. Physiol. 98:883–
898. https://doi.org/10.1113/expphysiol.2012.069443. Zoladz, J. A., B. Grassi, J. Majerczak, Z. Szkutnik, M.
Korostynski, M. Grandys, et al. 2014. Mechanisms
responsible for the acceleration of pulmonary V̇O2
on-kinetics in humans after prolonged endurance training. Am. J. Physiol.-Regul. Integr. Comp. Physiol. 307:
R1101–R1114. https://doi.org/10.1152/ajpregu.00046.
2014.
Zoladz, J. A., A. Koziel, A. Woyda-Ploszczyca, J. Celichowski, and W. Jarmuszkiewicz. 2016. Endurance training increases
the efficiency of rat skeletal muscle mitochondria. Pfl€ugers
Arch. Eur. J. Physiol. 468:1709–1724. https://doi.org/10.