This is a repository copy of Infiltration, runoff and sediment production in blanket peat catchments: implications of field rainfall simulation experiments.
White Rose Research Online URL for this paper: http://eprints.whiterose.ac.uk/482/
Article:
Holden, J. and Burt, T.P. (2002) Infiltration, runoff and sediment production in blanket peat catchments: implications of field rainfall simulation experiments. Hydrological Processes, 16 (13). pp. 2537-2557. ISSN 0885-6087
https://doi.org/10.1002/hyp.1014
[email protected] https://eprints.whiterose.ac.uk/ Reuse
See Attached
Takedown
If you consider content in White Rose Research Online to be in breach of UK law, please notify us by
White Rose Consortium ePrints Repository
http://eprints.whiterose.ac.uk/
This is an author produced version of an article published in Hydrological Processes:
Holden, J. and Burt, T.P. (2002) Infiltration, runoff and sediment production in blanket peat catchments: implications of field rainfall simulation experiments. Hydrological Processes, 16 (13). pp. 2537-2557.
Full Title:
INFILTRATION, RUNOFF AND SEDIMENT PRODUCTION IN BLANKET PEAT
CATCHMENTS: IMPLICATIONS OF FIELD RAINFALL SIMULATION
EXPERIMENTS
Short Title:
RAINFALL SIMULATION ON BLANKET PEAT
Keywords:
INFILTRATION, RAINFALL SIMULATION, PEAT, RUNOFF, SEDIMENT
PRODUCTION, SATURATION-EXCESS OVERLAND FLOW
J.Holden1 and T.P. Burt2
1
School of Geography, University of Leeds, Leeds, LS2 9JT.
2
Department of Geography, University of Durham, Science Laboratories, South Road,
Durham, DH1 3LE.
Corresponding author:
Dr Joseph Holden
Email: [email protected]
Tel: +44 (0) 113 233 3317
Abstract
Blanket peat covers the headwaters of many major European rivers. Runoff production
in upland blanket peat catchments is flashy with large flood peaks and short lag times;
there is minimal baseflow. Little is known about the exact processes of infiltration and
runoff generation within these upland headwaters. This paper presents results from a set
of rainfall simulation experiments performed on the blanket peat moorland of the North
Pennines, UK. Rainfall was simulated at low intensities (3-12 mm hr-1), typical of
natural rainfall, on bare and vegetated peat surfaces. Runoff response shows that
infiltration rate increases with rainfall intensity; the use of low-intensity rainfall
therefore allows a more realistic evaluation of infiltration rates and flow processes than
previous studies. Overland flow is shown to be common on both vegetated and bare
peat surfaces although surface cover does exert some control. Most runoff is produced
within the top few centimetres of the peat and runoff response decreases rapidly with
depth. Little vertical percolation takes place to depths greater than 10 cm due to the
saturation of the peat mass. This study provides evidence that the quickflow response of
upland blanket peat catchments is a result of saturation-excess overland flow generation.
Rainfall-runoff response from small plots varies with season. Following warm, dry
weather, rainfall tends to infiltrate more readily into blanket-peat, not just initially but to
the extent that steady-state surface runoff rates are reduced and more flow takes place
within the peat, albeit at shallow depth. Sediment erosion from bare peat plots tends to
be supply limited. Seasonal weather conditions may affect this in that after a warm, dry
Introduction
Many UK rivers drain headwater areas of blanket peat, yet little is known about the
exact hydrological processes responsible for runoff generation in these areas. Recent
work has shown that most areas of damaged and undamaged blanket peat are highly
productive of storm runoff (in comparison with most other catchments) and, by contrast,
generate little baseflow (e.g. Bay, 1969; Burke, 1975; Price, 1992; Burt et al., 1997,
Burt et al., 1998b, Evans et al., 1999, Holden, 2000). The suggestion is that this is
strongly related to the quickflow response resulting from surface or near-surface flow
mechanisms. Infiltration processes and water movement through the upper layers of
blanket peat are poorly understood.
Ingram (1983), in his extensive review of mire hydrology, makes almost no reference to
the process of infiltration into peat and little information exists elsewhere. Tricker
(1977) performed 30 ring infiltrometer measurements on a peaty Derbyshire moorland
and found infiltration rates ranging from 0 – 265 mm hr-1 (rates after one hour of ponded
infiltration). This provides evidence for high spatial variability although not all of
Tricker’s (1977) measurements were made on blanket peat. Gardiner (1983) and Labadz
(1988) both attempted to measure infiltration in blanket peat but comparison is difficult
because they used different methods (Table 1). Gardiner’s (1983) ring infiltrometer tests
suggested that infiltration-excess overland flow was likely to occur on Eriophorum
moorland since 13 % of hourly rainfall totals exceeded 2 mm hr-1 at his field site,
whereas the infiltration capacities (final state-state infiltration rate) were likely to be
exceeded rarely on Empetrum hummocks. Burt and Gardiner (1984) confirmed that
areas it was only frequent in depressions and on bare peat; the lower water table and
interception by crowberry plants and the litter layer helped to restrict overland flow on
the hummocks. Rainfall simulation work, however, suggested that Eriophorum-covered
peat could have a much higher infiltration capacity with very shallow subsurface runoff
occurring within the upper few centimetres of decomposing vegetation (Labadz, 1988).
Labadz (1988) concluded from her short pilot study that the application of rainfall
intensities comparable with those occurring naturally would be vital if results were to be
compared with natural runoff events, but this has proved difficult to achieve in
temperate climates. Certainly the rainfall intensities used in Labadz’s experiments were
not typical of rainfall in the Pennines (see below).
Burt et al. (1990) suggested that blanket peat catchments may be one of the few natural
types in the UK that produce ‘Hortonian’ infiltration-excess overland flow to any large
extent since infiltration rates into peat appeared to be low. However, the limited data
available and the typically shallow water tables in blanket peat catchments have made it
difficult to decide whether surface runoff is infiltration-excess or saturation-excess
dominated. Evans et al. (1999) noted that more work at the subcatchment scale level
was required to unravel the exact nature of the interaction between infiltration properties
of the peat, water table levels and runoff generation. Most flow appeared to occur within
the top layer of peat (the acrotelm - Ingram, 1983) which was periodically aerated by
the lowering of the water table. The lower peat (catotelm) was permanently saturated
with a low hydraulic conductivity. The relatively high hydraulic conductivity of the
surface layers allowed the possibility of rapid near-surface runoff through this layer.
subsurface peat layers with most measurements relying on estimates of the hydraulic
conductivity of the peat (e.g. Ingram, 1967; Romanov, 1968, Dai and Sparling, 1973,
Neuman and Dasberg, 1977; Baird, 1995). These tests are generally associated with
errors of at least one order of magnitude (Rycroft et al., 1975; Holden et al., 2001) and
are most commonly performed at depths well below the peat surface. Indeed, most
models applied to peat hydrology have been based on groundwater flow (e.g. Skaggs,
1980; McDonald and Harbaugh, 1988; Armstrong, 1995; Kirkby et al., 1995). This
paper seeks to assess the importance of surface and very near-surface flow processes in
blanket peat through a series of controlled rainfall simulation experiments.
Rainfall simulators have been extensively used in hydrological and geomorphological
research (eg. De Ploey et al., 1976; Lusby, 1977; Imeson and Kwaad, 1980; Bork and
Rohdenburg, 1981; Imeson, 1983; Pilgrim and Huff, 1983; Bowyer-Bower and Burt,
1989; Morgan, 1995; Cerda, 1998; Bergkamp, 1998; Foster et al., 2000). Simulators
allow the amount, intensity and duration of rainfall to be controlled along with other
variables such as drop-size distribution and water chemistry to varying degrees,
depending on the system of application (Foster et al., 2000). Runoff can be collected to
determine infiltration rates (by subtracting runoff rates from application rates), and
sediment erosion can be measured by sampling runoff. Both spray and drip-type
simulators have been used in field and laboratory work. Drip systems can generate a
constant low-intensity rainfall rate with drop sizes more easily controlled than in spray
Study Site
The experiments were performed at the Moor House National Nature Reserve (NNR),
North Pennines, UK (54o 41’ N, 2o 23’ W). Moor House NNR is a UNESCO Biosphere
Reserve occupying 35 km2 with an altitudinal range of 290 to 848 m. Lower
Carboniferous sequences of interbedded limestone, sandstone and shale provide a base
for a glacial till (Johnson and Dunham, 1963). The overlying glacial till provides poor
drainage, which has led to the development of blanket bog on around 70 % of the
reserve. The vegetation is dominated by Eriophorum sp., Calluna vulgaris and
Sphagnum sp. Although there are some areas of bare peat, most gullies have now
revegetated with Sphagnum and Eriophorum. Thus, most of Moor House NNR now
consists of intact, undamaged blanket peat; this is in contrast to the deeper peats of the
southern Pennine which have suffered widespread damage and where extensive bare
areas remain (Labadz et al., 1991). The Moor House peat typically has a high water
table with low fluctuations (above 5 cm depth for 93 % of the year – Evans et al., 1999).
Unlike the northern Pennines many Scottish and Canadian blanket peats tend to be
mantled with a deep layer of spongy poorly decomposed Sphagnum-peat; water table
fluctuations tend to be greater in these poorly decomposed peats. Also, hummock-pool
topography as found in Newfoundland, the southern Pennines or northern Scotland is
not as widespread in the north Pennines. The Moor House peats tend to be deeper than
in the thinly mantled peaty podzolic soils of the Welsh uplands but are similar to many
of the Irish and Finnish blanket peats. Burke (1975), however, found hydraulic
conductivities in the Atlantic blanket peats of Ireland generally an order of magnitude
Maritime air masses from the North Atlantic dominate the climate at Moor House which
has been classified as sub-arctic oceanic (Manley, 1936; 1942). Mean annual rainfall is
1930 mm (Burt et al., 1998a) with an average of 247 precipitation days per year
(Smithson, 1985). Precipitation totals are very high even by British standards but can
vary considerably from year to year, ranging from 1345 mm in 1971 to 3372 mm in the
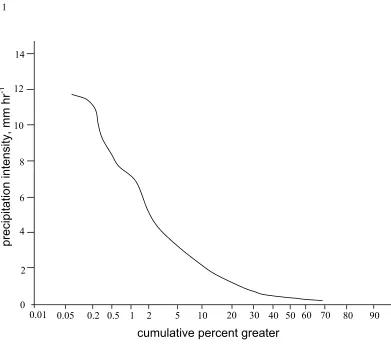
year 2000. Rainfall intensities in the Pennines are usually low (Figure 1), generated
predominantly by frontal and orographic processes. Disregarding possible snowmelt
events (when apparently high intensities are recorded due to snow melt in a
tipping-bucket rain gauge), there were only five occasions during the 1994-1999 water years
(October – September) when more than 10 mm of rain fell in one hour, with a
maximum of 11.6 mm hr-1. Data from a rain gauge at the study site were logged every
15 minutes between July 1998 and December 1999. Again, disregarding possible
snowmelt events, hourly rates based on the 15-minute totals indicated that a rainfall
intensity of 10 mm hr-1 was exceeded 18 times and 12 mm hr-1 six times. On only two
occasions rainfall intensity exceeded 14 mm hr-1. The greatest intensity recorded,
equivalent to 38.4 mm hr-1, occurred in a manually recorded five minute period
associated with the sighting of a funnel cloud on July 31st 1998 (Webb, 2000).
Prolonged dry periods are rare in the Pennines. Between September 1994 and June 2000
the maximum number of consecutive days without precipitation at Moor House was 14
(summer 1995). There were eight periods of ten days without precipitation during the
same period and 17 periods of a week or more without recorded precipitation.
Catchment runoff and water table conditions have been gauged on Trout Beck, a 11.4
that the flashy runoff response (with minimal baseflow) is dominated by overland and
near-surface flow within the upper few centimetres of the peat; lateral flow at depths
greater than 10 cm is very restricted (Burt et al., 1998b; Evans et al., 1999; Holden and
Burt, 2000 and Holden, 2000).
Methods used
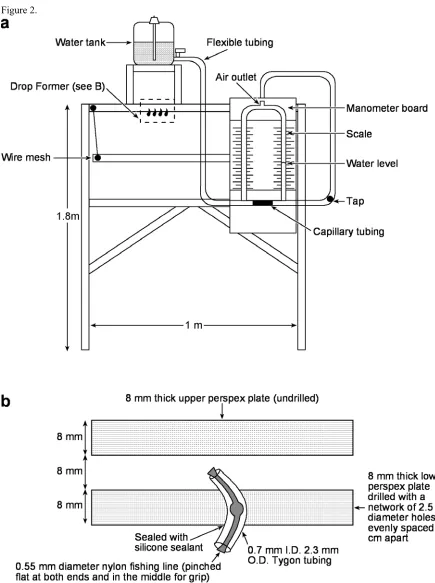
Rainfall simulator design
A drip-type rainfall simulator as described by Bowyer-Bower and Burt (1989) and
Foster et al. (2000) was used to provide the rainfall. The principal components are
shown in Figure 2. Drops were formed by controlling flow through Tygon tubing of 2.3
mm outside diameter (OD) and 0.7 mm inside diameter (ID) through which was
threaded 25 mm long, 0.6 mm OD fishing line. The upper perspex plate contained 627
drop formers arranged in a 19 x 33 matrix. A constant head system of two 25-litre water
tanks mounted above the perspex drip-screen was used. A manometer board controlled
the rainfall intensity and careful calibration allowed a relationship between head
difference and rainfall intensity to be accurately determined. Repetition of the
calibration procedure showed that as long as the simulator was kept level, accurate
simulations of rainfall intensity could be reproduced (r2 = 0.98). The minimum intensity
possible with the simulator was 3 mm hr-1. The simulator was supported by a metal
frame with adjustable legs for levelling and adjusting the apparatus to the required
distance from the ground (1.8 m).
A wire mesh was hung 200 mm below the perspex plate in order to break up water
Following Bowyer-Bower and Burt (1989) a 3 mm square mesh was used. Drop size
distribution was measured using the flour pellet method (Laws and Parsons, 1943;
Costin and Gilmour, 1970; Cerda, 1998; Erpul, et al., 1998). Around 16,000 drop
diameter measurements were taken from a 12 mm hr-1 rainfall simulation. The modal
drop size was ≤ 0.5 mm, with a D50 (the drop diameter at which half the sample by
volume is composed of larger drops and half of smaller drops) of 1.5 mm. This
compares favourably with natural drop size distributions (Best, 1950); low-intensity
rainfall is composed mostly of small drops (Laws and Parsons, 1943). Hudson (1971)
discusses the properties of natural rainfall including drop-size distribution and terminal
velocity: D50 increases from around 1.8 mm at 12.7 mm hr-1 to 2.5 mm at intensities
greater than 65 mm hr-1. On this basis, the simulator’s drop size distribution appears
acceptable, given that 34 % of drops were between 1 and 2 mm diameter. The range of
terminal velocities was almost entirely between 60 and 90 %, with the D50 at around 80
%. A.J. Parsons (pers. comm.) calculated that the mean kinetic energy (KE) of the
rainfall produced by the simulator at 12 mm hr-1 based on the drop size distribution data
was 0.069 J m-2 s-1. He calculated a KE of 0.089 J m-2 s-1 using a simulator of the same
design at 25 mm hr-1.
Field methods
The rainfall simulator described above was used to provide the rainfall. The legs were
inserted into the peat, with horizontal bars preventing the simulator from sinking
further. The drip screen was adjusted so that in each case it was 1.8 m above ground
level. On the blanket peat moorlands of the Pennines there tends to be significant air
movement below the drop formers. Intensities could be easily varied between 3 mm to
140 mm hr-1. Given the low natural rainfall intensities typical of these moorland areas
(see above), 3, 6, 9 and 12 mm hr-1 were used.
Wherever possible natural rainwater was used for the experiments as differences in the
chemistry of tap water may affect soil erodibility through ionic exchange (Hobbs, 1986;
Barton, 1994). Rainwater was collected on the Moor House NNR in a large barrel.
Occasionally when this source ran out, or when the study plot was too far from the
barrel, stream water from peat catchments was used. This was deemed acceptable given
its source and low solute concentration. Stream water was passed through a 63 µm filter
before being used in the rainfall simulator.
Testing indicated an approximately uniform distribution of rainfall over the 1 m x 0.5 m
plot covered by the simulator. The plot was bounded on three sides by aluminium
sheets, inserted to a depth of 20 cm and protruding 10 cm above the surface. At the
lower plot boundary a small pit was excavated and three runoff troughs constructed of
aluminium inserted against the clean front edge of the plot, being slightly inclined to
ensure flow into a collecting vessel. The troughs were inserted at 1 cm, 5 cm and 10 cm
below the surface and positioned with great care. This was to ensure that no water
emerging from upper collection layers could leak down the face to lower troughs to give
a false runoff record and to minimise disturbance of the peat (Bowyer-Bower and Burt,
1989). The upper trough was inserted at 1 cm below the surface because it was found to
be very difficult to create suitable contact to collect surface runoff above this depth.
lateral flow within 1 cm of the surface contributes to ‘surface runoff’. Runoff was
measured manually every five minutes from each layer using volumetric measuring
cylinders. Surface runoff from bare peat plots was collected and poured into bottles for
storage. The suspended sediment concentration was then measured in the laboratory by
vacuum filtration through glass fibre filters retaining particles to 1.2 µm in diameter and
oven drying at 105oC within four days of collection.Water tables were monitored in the
plots using 20 mm diameter PVC dipwells inserted into the peat. A narrow borehole
was created with a screw auger and the tube slotted into position. Measurements were
made to the nearest 1 mm using an electronic water level sensor.
The pits dug at the lower plot boundary were shallow (20 cm) but kept drained of water
to enable flow collection from the troughs. Monitoring of the water table close to the
edge of certain pits did suggest a slight decline in the plot within around 5-10 cm of the
edge of the pit. Thus there may have been a small amount of error in throughflow rate
measurement during the experiments. As the technique is based upon collecting water
seeping from a free face the troughs will collect only saturated throughflow (Atkinson,
1978). This is because water at the free face must be at atmospheric pressure in order to
leave the pore space of the soil and flow away. This soil at the face must be saturated.
Inevitably, if the soil at the face itself is saturated, a wedge of saturated soil will extend
upslope, perhaps into soil which would not normally be saturated had an artificial free
face not been constructed. This process helps counteract the effect of lowering of water
table at the face of a soil. Furthermore, as the throughflow troughs were inserted 5 cm
table and artificial saturation. Hence the errors associated with the technique should be
minimised.
Six plots for each of the four main surface cover types at the study site were selected
(bare peat, Calluna, Eriophorum, and Sphagnum). Each plot contained at least 90 % of
the selected cover and had a slope of between 2o to 3o. At each site, rainfall was
simulated at four intensities (3, 6, 9 and 12 mm hr-1) with the order of the runs varied so
as to randomise the effect of antecedent conditions which might otherwise bias results.
Experiments were performed during April and May 1999 and rainfall was simulated on
the plots until runoff was produced at a steady rate from the three runoff troughs (often
this took 1-2 hours, being longer at intensities of 6 and 3 mm hr-1). The rainfall supply
was then stopped and the plot allowed to drain. The plot was left for several hours
before the next run began. Runoff from the three layers generally fell to an extremely
low rate within 30 minutes of rainfall stopping. Two of the plots for each vegetation
type (8 in total) were revisited in August 1999 during a dry period to see if surface
desiccation and water table drawdown had any impact on infiltration and runoff
processes from the acrotelm. In total, 128 rainfall simulation runs were conducted. This
represents a considerable increase in data on infiltration and runoff production processes
within blanket peat compared to previous studies.
Calculation of infiltration and runoff rates
Runoff rates were measured as the volume of runoff from the plot per five minutes, and
then converted to mm hr-1. Infiltration rates were calculated by subtracting surface
and, more importantly, the effects of surface depression storage and storage on
vegetation surfaces. As Slattery (1994) noted there are several difficulties in applying
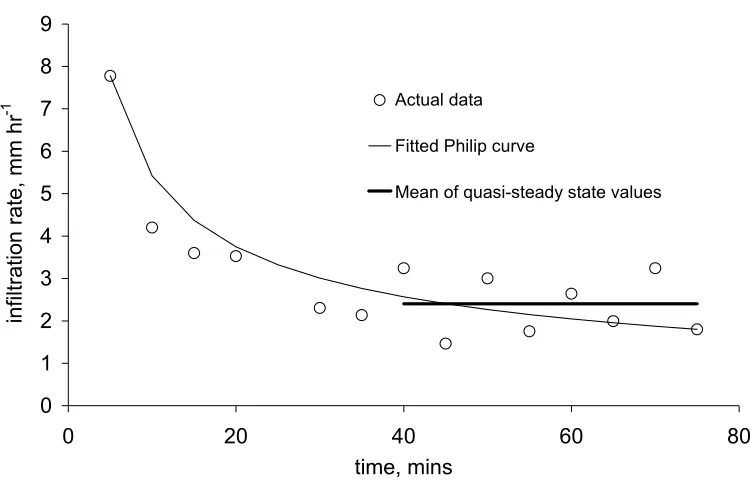
the theoretical infiltration curve of Philip (1957). Here it was found more appropriate to
assess final steady-state runoff and infiltration rates as a mean value of the readings
taken over a time period when the runoff was considered to be steady. An example is
shown in Figure 3 which shows a typical decline in infiltration rate up to about 40
minutes. After 40 minutes there does not appear to be any long-term change in
infiltration rate, simply oscillation around a mean value. In such cases the infiltration
rate can be considered as effectively constant. Observation of the surface runoff
processes suggests that oscillation occurs as a response to waves of water movement
linked to surface ponding; episodic cut and fill of micro-topographical features causes
water to flow out followed by a period of pool refill and micro-channel change. In a
sense, these fluctuations are not a direct response to changes in infiltration rate at the
peat surface, but an artefact of the method of data collection. As the last data point may
be affected by the oscillation effect, it was felt more appropriate to use the quasi-steady
state average rather than apply the Philip equation.
Results and Discussion
Nature and timing of runoff response
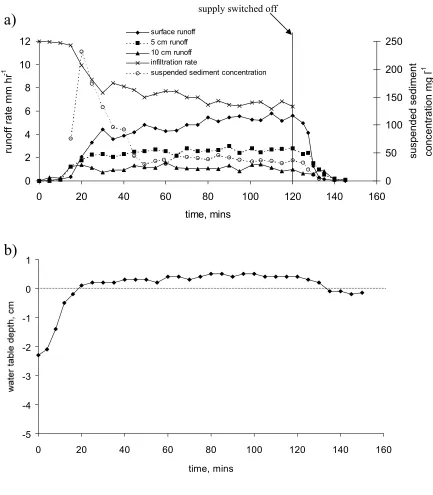
The runoff and suspended sediment response from a bare plot with a rainfall intensity of
12 mm hr-1 is shown in Figure 4a. At the plot scale, some of the catchment-scale
characteristics demonstrated by Evans et al. (1999) can be seen. There is a very rapid
response to rainfall from all three layers. Only 20 minutes after the onset of rain, runoff
declines with depth. Steady-state rates of runoff are achieved within 80-100 minutes for
all three layers. The recession appears even more rapid than the rising limb for surface
runoff, although the hydrographs are fairly symmetrical in appearance. Surface runoff
recession is also faster and more dramatic than at depth. This is a result of continued
percolation of water into the peat mass from the surface depression storage after rainfall
input has ceased. The drainage of the lower layers slows once the excess water has
drained from above.
On average, for all runs, steady-state runoff is reached in 59 minutes, but steady-state is
achieved more rapidly at higher intensities (Table 2). The time to steady-state is about
the same for all soil layers which suggests that there is a close connection between the
layers. The time to maximum ponding (and surface flow) and hence the development of
saturation-excess overland flow coincides with the saturation of the surface layers.
Figure 4b plots water table depth during the 12 mm hr-1 rainfall simulation run shown in
Figure 4a. The water table responds rapidly to rainfall suggesting that infiltration rates
can be high when the peat is not saturated to the surface and when water tables are
shallow. Overland flow is only recorded once the water table has reached the surface.
Importantly, only four of the rainfall simulator plots produced overland flow when the
water table was below the surface. This suggests that overland flow generation occurs as
a result of saturation of the peat rather than through Hortonian infiltration-excess
mechanisms. Non-uniformity of plot surfaces (e.g. ponding in depressions when the
may explain the four exceptions. Furthermore, in these four cases, the water table was
within 10 mm of the surface when overland flow began.
Infiltration rates
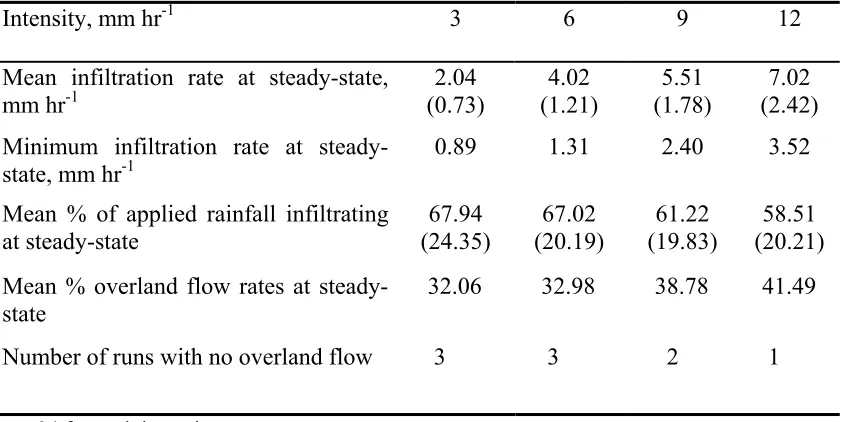
Mean steady-state infiltration rates for each intensity of rainfall are shown in Table 3.
Infiltration rates are low but increase with rainfall intensity. Some runs produced no
surface runoff as the infiltration rate was greater than the application rate for these tests.
Nevertheless, for most runs, overland flow was produced even at low rainfall intensities.
Thus overland flow can develop at low rainfall intensities even on vegetated blanket
peat. These infiltration rates are generally lower than those recorded by Labadz (see
Table 1); however, given the tendency for infiltration rates to increase with rainfall
intensity, any comparison must be qualified with respect to rainfall intensity data.
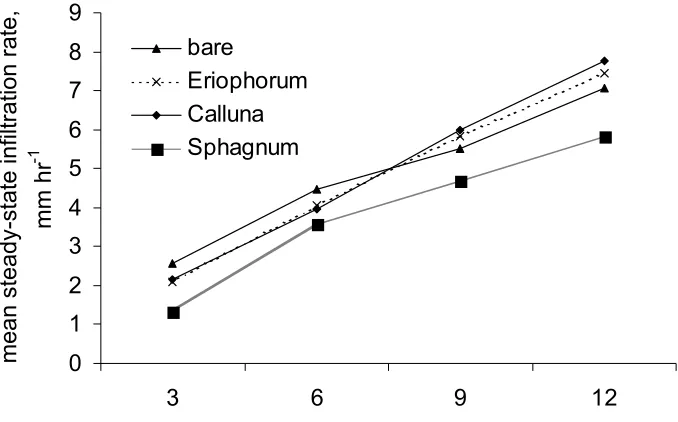
Figure 5 shows how mean steady-state infiltration rates vary with intensity for each
vegetation type. For lower intensities, mean rates of infiltration into bare peat are
slightly greater than for vegetated mire. At the 9 and 12 mm hr-1 intensities, the
infiltration capacity of bare peat is slightly less than for Eriophorum or Calluna
surfaces. However, there is little overall difference in rates between an Eriophorum- or
Calluna-covered surface and a bare surface. Mean infiltration rates into peat below a
Sphagnum cover appears to be lower than for other vegetation types, which may relate
to the types of peat which form beneath different vegetation covers.
Significance of rainfall intensity, vegetation cover and peat depth on runoff production
Runoff was collected from the surface layer and at 5 cm and 10 cm depth from all plots.
These data have been combined for subsequent analysis. Data for runoff rates from all
to 9.99 mm hr-1 with a mean of 1.77 mm hr-1 and a skewness of 1.49. Given this last
result, it is not surprising that the variance within subsamples defined by depth,
vegetation and rainfall intensity categories is not even roughly uniform, as required for
application of ANOVA. The square roots of runoff rates are less skewed with a range
from 0 to 3.16 √(mm hr-1), a mean of 1.05 √(mm hr-1) and a skewness of 0.35. More
importantly, variances for the depth, vegetation and intensity categories are now nearly
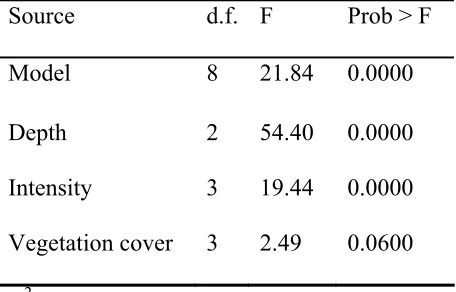
equal. The ANOVA results (Table 4) show that the depth and intensity controls are
overwhelmingly significant as the calculated significance levels are less than 0.00005.
Hence, both controls can be regarded as genuinely influencing runoff rates. Runoff
significantly decreases with depth and increases with intensity. As suspected during
examination of infiltration rates above, surface cover is of some importance to the
model but its influence is not as strong as depth and rainfall intensity controls.
A similar data transformation was required for comparison of runoff efficiency data. For
the purpose of the present study runoff efficiency has been defined as the proportion of
rainfall received at the ground surface that is being generated as runoff by each soil
layer. Here raw data ranges from 0 to 85.3 % with a mean of 23.2 % and a skewness of
0.78. After transformation, skewness was –0.01 with a mean of 3.90 √ %, and values
ranging from 0 to 9.24 √ %. Again, variability with depth, vegetation and intensity
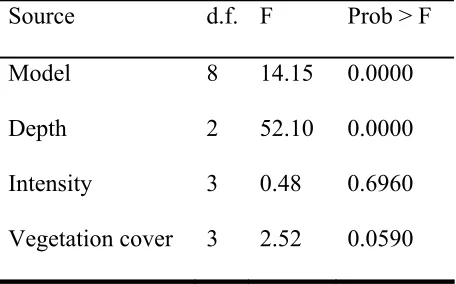
categories is now similar. ANOVA indicates that for runoff efficiency, of the three
controls, only depth can be accepted as a major factor (Table 5). Rainfall intensity can
be disregarded as a control on efficiency and vegetation cover is of limited importance,
although it can again be argued that some influence has been identified. Results from
cover in controlling runoff production to be established. Discussion will now focus on
the significance and role of each controlling variable.
Rainfall intensity control
Table 5 shows that rainfall intensity exerts very little influence on runoff production
volume as a proportion of incoming rainfall. This is probably a reflection of
saturation-excess runoff development since this can occur at much lower rainfall intensities than is
required for infiltration-excess overland flow (Burt, 1996). Thus, if the peat becomes
saturated to the surface even under low-intensity rainfall, then overland flow is likely to
be produced no matter what the rainfall intensity is, as long as there is enough water
supply to keep the peat saturated. The rainfall simulator results suggest that blanket peat
runoff production is just as efficient for low-intensity as high-intensity storms. This
evidence corroborates catchment-scale work at Moor House where all rainfall events
with intensities greater than about 1-2 mm hr-1 produce an efficient runoff response with
a steep rising hydrograph (Evans et al., 1999). Given that infiltration rates also increase
with intensity, this suggests that a mechanism operates by which a similar proportion of
rainfall can infiltrate into the peat, to some extent independent of intensity (over a 2 mm
hr-1 threshold).
Since most rainfall simulation studies use only one intensity of rainfall there are few
reports of relationships between rainfall intensity and infiltration. In semi-arid soils the
greater energy of high-intensity rainfall disrupting the soil crust in response to wetting,
so that finer material produced by slaking and splash is kept in suspension instead of
(Bowyer-Bower, 1993). Kneale and White (1984) found that the proportion of applied
water emerging from the soil as bypassing flow increased from 0 to 55 % as water
application rates onto a clay-loam grassland increased from 2.2 to 21.2 mm hr-1. The
depth of surface ponding is likely to be important on blanket peat. Higher rainfall
intensities tended to induce a greater depth of ponding, and thus an increased head of
water and a resultant increase in percolation rates and subsurface runoff (Schiff, 1953).
Philip (1958) found infiltration rates increased by 2 % for every extra centimetre of
ponded water on a light clay soil. This is a relatively small amount but importantly the
effect was predicted to be greater in wetter and non-homogenous soils. No work of this
type has been done on peats and, because the infiltration models are based on
infiltration into unsaturated homogenous soils, it is difficult to establish how important
ponding depth may be on blanket peat without field experimentation. Observation
showed that ponding across the surface of bare peat was not always uniform or
widespread and often only occurred locally in depressions. The non-uniform nature of a
soil over a 0.5m2 plot may result in the surface of one part of the plot having a higher
infiltration capacity than the rest of the plot. Therefore, as Hawkins (1982)
demonstrated numerically, mean infiltration rate over a plot will increase with rainfall
intensity simply because a greater flux of water is occurring through the parts of the plot
surface that have the higher relative infiltration capacities. In other words it must be
acknowledged that only a fraction of the area within small plots need contribute to
Depth control
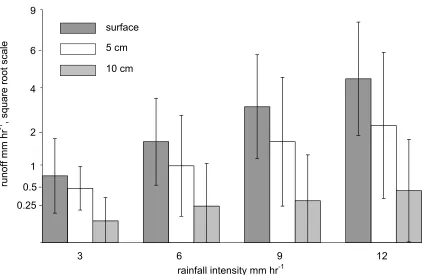
Mean steady-state runoff rates from all three runoff-collecting troughs are shown in
Figure 6. Standard deviations indicate the variability within the dataset. There is a large
amount of overlap but ANOVA (see above) demonstrated that the differences were
significant. The greater the rainfall intensity, the higher the overland flow runoff.
Lateral flow between 5-10 cm depth accounts for only 7.2 % to 13.0 % of incident
rainfall volume (depending on intensity), compared with 21.7 % to 25.5 % from the peat
layers between 1-5 cm depth and 31.6 % to 40.8 % at the surface. Mean runoff
significantly increases in all layers with increasing rainfall intensity, a result of
increased infiltration followed by enhanced lateral flow. For the 5-10 cm layer, the
gradient of the rise in runoff with intensity is significantly less than for the overlying
layers (U test, p<0.0005). Mann-Whitney U test results indicate that the gradient of the
rise in runoff with intensity is significantly greater at the surface than for the 5 cm layer
(p = 0.002) which also significantly greater than the gradient for the 10 cm layer (p =
0.001). This is obviously linked to the larger proportion of overland flow occurring, but
may also be to some extent a reflection of a limited capacity for lateral flow within this
layer restricted by a lower hydraulic conductivity and reduced percolation rates.
Surface cover control
ANOVA demonstrated that there was a minor vegetational control on runoff generation.
It is not necessarily surface cover that is the control; rather the surface cover is
indicative of the properties of the peat below that cover. It is well known that particular
being important for example (Ingram, 1983). Furthermore, the vegetation may interact
with the peat structure by rooting, litter deposition and building up of the peat deposit.
Figure 7 provides further information on the role of surface cover in controlling runoff
production. Standard deviations are included in an inserted table. For Eriophorum
-covered peat, the mean runoff at 1-5 cm depth is just as great as that at the surface, but
between 5-10 cm only 1.2 % of the rainfall input is collected as throughflow from this
layer. So peat below Eriophorum clearly allows rapid flow within the top 5 cm but
below this layer very little lateral flow occurs at all. This is similar to the findings of
Labadz (1988): on the one Eriophorum-covered plot throughflow was rapid just below
the peat surface. Unlike Labadz’s results, however, the results presented here indicate
that Eriophorum peat is capable of producing overland flow as well as near-surface
flow. There may be some difficulties in comparing data sets due to different definitions
of the peat surface. For the present data the surface is defined as the first centimetre of
intact peat and any very loose leaf litter layer is not considered as the peat ‘surface’,
although often the distinction is very difficult owing to the partially living nature of the
upper peat profile. Ingram and Bragg (1984) suggest that the acrotelm itself possesses
the essential characteristics of a layer which suppresses sheet flow. At the same time
results from the rainfall simulator tests presented here show that widespread overland
flow does occur on vegetated peat hillslopes often to depths of more than 1 cm. Not
only will definitions of the surface vary but it is also likely that acrotelms of different
natures, and hence different surface properties, exist and are distributed throughout the
areas of study described in the literature and indeed throughout small catchments.
poorly-decomposed, high hydraulic conductivity, Sphagnum peat often 50 cm thick. Such an
acrotelm is uncommon at Moor House except in localised flushes or hollows. Hence the
nature of the peat surface and upper peat layers are likely to be very important factors in
determining runoff production processes within blanket peatlands.
At Moor House for vegetated surfaces runoff decreases with depth, but for bare peat the
mean proportion of runoff between 5-10 cm is 8.0 % greater than that between 1-5 cm
and only 2.4 % less than surface runoff. Bare peat therefore plots differently on Figure 7
from vegetated peats at depth. This may be related to desiccation: drying of an
unprotected peat surface may lead to the development of a more permeable upper peat
mass and any such effect is reduced with depth. Percolation-excess is again evident at
10 cm depth such that lateral flow occurs more readily at this level. Ingram and Bragg
(1984) noted that on a bare peat surface where there is downwasting and removal of the
acrotelm, the result is a mire with restricted infiltration leading to enhancement of sheet
flow on the surface. Results presented here, however, indicate that bare peat has
equivalent infiltration rates to those of vegetated peat. In this way a dynamic feedback
mechanism may operate because the peat itself changes its hydraulic properties as the
emerging bare surface becomes susceptible to drying or frost heave, and to aeration.
Hence, the bare peat surface degrades and allows infiltration to take place, such that the
near-surface peat that was once the catotelm now in effect becomes a thin acrotelm.
More work is required to examine this possible mechanism. An indication that the
surface properties of the bare peat are very different from that of the peat below comes
from an analysis of the dry bulk density (DBD) of bare peat with depth (Figure 8). The
transition after about 10 cm to a much denser peat. As well as desiccation of the surface,
erosion may lead to reworking of the surface peat, probably through a mixture of water
and wind-driven mechanisms, such that the top layer of peat may in certain locations
contain a depth of unconsolidated deposited peat. In this case it is likely that bulk
densities are decreased and this will allow increased infiltration to a shallow depth just
below the reworked layer where lateral runoff can take place. For Eriophorum-covered
peat DBD increases gradually with depth and is lower than that of the bare peat. The
bare peat was more humified near the surface (H7 on Von Post, 1922 scale) than peat
below Eriophorum (H1-H3). The emergent and weathered bare peat surface, having lost
peat from above, was formerly at a greater soil profile depth and was therefore older
than the recently generated and less humified vegetated surface peat.
Effect of summer desiccation on runoff processes
Part of this study involved looking at the effect of warm, dry periods on blanket peat
during the summer of 1999. Out of the 24 plots examined in the spring, 8 were revisited
during a warm dry period of the summer, two from each of the original surface cover
types. It is unusual in the blanket peat catchments of the North Pennines to experience
periods of more than 10 days without rain which coincide with warm weather (see
above). Figure 9 illustrates the dry bulb air temperature and rainfall characteristics for
July and August 1999 (Julian day 183-242). Only 19.2 mm of precipitation occurred
between day 203 and 225, with only 0.2 mm of precipitation between day 186 and 195
and none between 206 and 216. Total precipitation for June, July and August 1999 was
294.8 mm, which compares with the mean for this time of year of 384.7 mm (mean at
this dry, warm period, cracking on the surface of bare peat was observed. Maximum
crack widths and depths (up to 28 mm and 145 mm respectively) occurred on Julian day
214, after 10 days without rain and when summer temperatures were at a maximum.
The surface took many months to recover, with cracks still evident in late summer. The
cracks usually filled with deposited material rather than closing up by complete
re-swelling of peat. Rainfall simulation plots were revisited from Julian day 209-216
during the height of the surface desiccation period.
Paired T-tests demonstrate that there is a significant difference between the runoff
production in the plots during the original runs in the spring and the runs during the
summer period (n = 96, t = 2.03, p < 0.03). However, for Sphagnum-covered plots there
was no change in the runoff production rates. The Sphagnum cover may protect the
surface from damage. Furthermore, because Sphagnum species tend to grow in wetter
areas which have higher water tables, such as in topographical hollows which are very
poorly drained, these areas may be less likely to become dry, unless the drought is very
severe. For the other plots infiltration rates are greatly increased for all intensities such
that surface runoff is reduced in the summer test. An example is shown in Figure 10
where, for a Calluna-covered plot, surface runoff is reduced and lateral flow from the 5
cm trough is greater as a result. It may be that both matrix and macropore flow
increased within the acrotelm as evidenced by the increasing fluxes measured from the
5 cm layer during the summer tests. On bare peat where flow through the desiccation
cracks was visible, some absorption into the peat was noticed before any runoff
occurred. This was followed by a period of ponding in depressions on surface crusted
cracks themselves filled with water as flow capacities were exceeded and as some
blockage by sediment and perhaps some re-swelling occurred. Only at this stage could
overland flow be collected from the runoff trough.In some plots, the total steady-state
runoff collected from the upper 10 cm was reduced such that more runoff was being
produced from the lower layers of blanket peat.
Sediment movement
Results from spring 1999 indicated that rain splash was an important agent of
disturbance and entrainment on bare peat as particles were often splashed up to the top
of the plot boundary boards (10 cm in height) and up to 15 cm against the rainfall
simulator legs and on the internal sides of the wind proofing around the plot. Suspended
sediment concentration was measured during the 24 spring experiments on bare peat.
The sudden decline in sediment concentration coinciding with rainfall cessation (Figure
4a) provides evidence for the strong erosional role of rain splash. As runoff decreases
rapidly after rainfall cessation the effect is combined with transport-limiting flow
reduction. This is similar to the findings of De Ploey (1984) who worked on loess
loamy soils. Surface wash was observed to be the main agent of transport with
individual particles and fibres of peat easily observed moving in micro-rills. Sediment
supply to the runoff troughs oscillated in relation to micro-pool and micro-rill, cut and
fill processes. The supply of available sediment was, in most cases, found to be limited
as concentrations decreased during a run, very quickly at first, and more slowly later,
typically producing clockwise hysterisis loops. This effect may in part be related to the
(Klove, 1998). The trends in sediment concentration during the runs are similar to those
reported by Klove (1998) who examined a degraded mined peat surface in Finland.
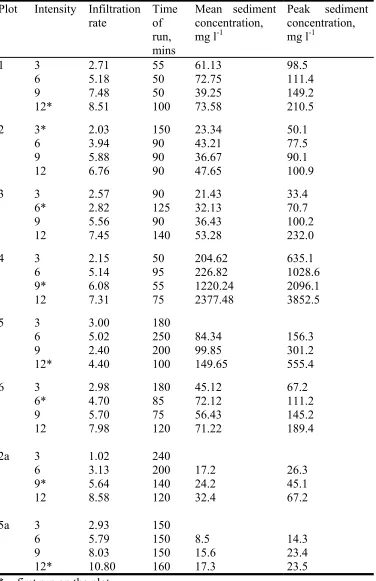
Peak sediment concentrations were generally recorded during the rising limb of surface
hydrographs (Table 6; mean concentrations also shown). Values of peak concentration
of sediment were between 33 and 3852 mg l-1, generally increasing with intensity on a
particular plot. These values are somewhat lower than those found by Labadz (1988)
who found peak values ranging from 947 to 9110 mg l-1. However, Labadz used very
high intensities (39 to 92 mm hr-1) and hence a greater total raindrop impact energy
would have been supplied to the peat surface allowing increased detachment and
entrainment.
Bare peat areas are frequently surrounded by vegetation, such that sediment may
become trapped, so that sediment yield measured at a particular outlet is therefore a
result of differential production, storage and deposition within the catchment (Walling,
1983). For the Rough Sike catchment, (a tributary of Trout Beck), within which many
of the rainfall simulator tests were performed, Crisp (1966) estimated an annual
sediment yield of 93 tonnes with an estimate of about 10-20 % of the catchment as
eroding. The eroding peat is concentrated in gullies corresponding to Bower’s (1960)
late stage of development. Re-instrumentation of Crisp’s weir has shown that most of
the peak sediment concentrations occur on the rising limb of the hydrographs (Burt et
al., 1998c). This is indicative of sediment exhaustion whereby the supply of readily
mobilised material is quickly depleted (Webb and Walling, 1984). The rainfall plot
from the catchment outlet were found to be around 50-60 mg l-1 (Evans and Burt, 1998)
with peat fans at the end of gully networks reducing direct peat supply from the eroding
source areas to the main channel. The rainfall simulator tests were, of course, performed
on isolated plots. On a hillslope, sediment will be transported, deposited and stored
several times and supply of sediment from upslope will be an important feature. The
mean concentrations of suspended sediment produced on bare peat plots indicate that
loads are spatially highly variable. Over the 3-12 mm hr-1 range the mean suspended
sediment concentration was 224 mg l-1. The very low density of the peat (0.1 g cm-1
compared to 1.2 g cm-1 for mineral soil peds and aggregates and 2.6 g cm-1 for typical
quartz grains) means that this represents a significant volumetric load (Burt et al.,
1997).
Burt and Gardiner (1984) note the importance of desiccation in creating a peat surface
that can provide high sediment supply. Because of this, sediment loading may vary with
aspect (Bower, 1959; Francis, 1990) and with season (Tallis, 1973; Francis, 1990). It is
possible that results reported here are at the lower end of the scale when winter frost
activity has been reduced and before summer desiccation has occurred. Observations of
weir pools on the Moor House NNR indicate that maximum supply of eroded material
to streams occurs in early spring due to frost action; the weir pools had to be cleared of
sediment frequently during the spring but very infrequently at other times of the year.
Tallis (1973) showed that substantial peat erosion occured during snowmelt and during
heavy rain, when stream flow rates were high. Francis (1990), however, found that peat
supply to streams was much greater in the autumn and early winter; the suggestion was
sediment exhaustion occurred and frost action was of minimal importance. The two
opposing results may be related to sediment storage and release mechanisms, and to the
nature of the coupling between bare peat areas and streams in the area of study. It can
also be noted that the sediment peaks found by Francis (1990) were for late autumn and
early winter of 1983 and 1984; both years were atypically dry years.
Sediment loading from the two bare simulator plots revisited during summer 1999 was
lower during the summer runs (Table 6). It is possible that the summer crusting of the
surface prevents removal of sediment in the first instance, but as wetting-up occurs, and
significant ponding and runoff begin to disturb the crust, then more sediment erosion
can occur. For the summer runs, peak sediment concentrations were coincident with
peak runoff; the sediment supply now appears to be transport limited, whereas during
the spring sediment delivery was supply limited.
Conclusions
The use of low-intensity rainfall has allowed a more realistic evaluation of infiltration
rates and flow processes than previous studies. The rainfall simulation experiments on
blanket peat have suggested that infiltration rate increases with rainfall intensity.
Small-scale spatial variation within plots, as well as surface ponding depth, are likely to be the
main reasons for this. This has important implications for inferences drawn from
infiltrometers and simulators alike. Ring infiltrometer tests do not provide adequate
information on typical infiltration rates in blanket peat because they are not dependent
on any rainfall intensity control and operate by imposing a constant-head of water on
rates may also provide inadequate information since they must be intensity specific.
These factors are often ignored by workers using rainfall simulators and too frequently
results are presented from experiments using unrealistically high intensities. Results
drawn from a single rainfall intensity may well be specific to that intensity and not
necessarily general.
The rainfall simulator results have shown overland flow development on vegetated and
bare peat surfaces over the 3–12 mm hr-1 rainfall intensity test range. This could suggest
that blanket-peat infiltration rates are low. However, the work has demonstrated that
low steady-state infiltration capacities are not due to inherently low surface permeability
but are more to do with low percolation rates below the surface resulting in saturation of
the near-surface layers. Water tables in the plots were rarely below the surface when
overland flow was produced. This therefore corroborates the results of Holden et al.
(2001) who demonstrated through use of a tension infiltrometer that infiltration-excess
overland flow was likely to be a rare occurrence in blanket peat catchments. Runoff
production decreases rapidly with peat depth and not much vertical percolation takes
place to depths greater than 10 cm such that most of the runoff production is within the
upper layers of blanket peat. Overland flow occurs readily on both vegetated and bare
peat surfaces. Thus, the low infiltration rates measured using the rainfall simulator are a
result of surface saturation of the peat and saturation-excess overland flow can develop
even during very low-intensity rainfall simply because the peat is saturated. Overland
flow is therefore rapidly generated and storm runoff efficiently produced in blanket peat
catchments; this helps to explain why catchment-scale storm response is extremely
From bare peat plots, sediment loading tends to be supply limited. Seasonality may
affect this relationship such that after a warm dry spell, surface desiccation allows
sediment supply to become transport limited. Much more work is required on linking
process mechanisms and rates of erosion in blanket peat areas. Rainfall-runoff response
at the plot-scale may also vary with season. Where any change occurred, rainfall more
readily infiltrated into the peat during the summer tests, than during spring. This
suggests that less overland flow may be expected after warm dry spells. Not only is this
related to a lower water table and water table recharge in the first instance, but as these
tests ran to steady-state such that the water table had time to rise, the evidence suggests
that alteration in hydrological properties of the peat at and near the surface has occurred.
Klove (1998) used high-intensity rainfall simulation (35 – 260 mm hr-1) using a spray
nozzle on large 100 m2 plots of heavily disturbed (mined) peat in Finland. Work
concentrated on sediment erosion processes but overland flow was often found not to
occur below rainfall intensities of 30 mm hr-1. This peat surface would have been
heavily disturbed and this result probably represents the important effect of changing
environmental conditions on runoff generation in peatlands. The effect of vegetation
removal and of exposing peat more readily to the processes of surface desiccation is to
increase infiltration rates and promote lateral subsurface flow. When peat dries its
structure is permanently altered such that it becomes hydrophobic (Egglesmann et al.,
1993). It is not known how much permanent change can occur due to droughts on bare
and vegetated peat hillslopes and what effect this will have on hydrological flow
pathways, hydrochemical processes, ecological processes and erosion. With an
(Marsh and Sanderson, 1997), peat desiccation may increase and more work is required
to establish possible catchment-scale effects.
Acknowledgements
The authors gratefully acknowledge that the work for this paper was carried out whilst
JH was funded by the University of Durham (Lindsay Scholarship, Geography
Department Studentship, Hatfield College Scholarship). The authors thank John
Adamson and Mandy Lane of the Environmental Change Network for use of
meteorological data used in this study and the Environment Agency for the river flow
data. English Nature are also thanked for allowing access to the Moor House Reserve.
The field assistance of Richard Johnson, Henry Holden, Patricia Holden and Vincent
References
Armstrong AC. 1995. Hydrological model of peat-mound form with vertically varying
hydraulic conductivity. Earth Surface Processes and Landforms, 20: 473-477.
Atkinson TC. 1978. Techniques for measuring subsurface flow on hillslopes. In
Hillslope Hydrology, Kikby MJ (ed). John Wiley: Chichester; 73-120.
Baird AJ. 1995. Hydrological investigations of soil water and groundwater processes in
wetlands. In Hydrology and Hydrochemistry of British Wetlands, Hughes JMR and
Heathwaite AL (eds). John Wiley: Chichester; 111-129.
Baird AJ, Beckwith C and Heathwaite AL. 1997. Water movement in undamaged
blanket peats. In Blanket Mire Degradation, Causes, Consequences and Challenges,
Proceedings, University of Manchester, 9-11 April 1997, Tallis JH, Meade R and
Hulme PD. (eds). Mires Research Group, British Ecological Society; 128-139.
Barton AP. 1994. Water chemistry as a factor influencing the erosivity of simulated
rain. Unpublished M.Sc. thesis, Cranfield University.
Bay, RR. 1969. Runoff from small peatland watersheds. Journal of Hydrology, 9:
90-102.
Best AC. 1950. The size distribution of raindrops. Quarterly Journal of the Royal
Bergkamp G. 1998. A hierarchical view of the interactions of runoff and infiltration
with vegetation and microtopography in semiarid shrublands. Catena33: 201-220.
Bork HR and Rohdenburg H. 1981. Rainfall simulation in southeast Spain: analysis of
overland flow and infiltration. In Soil conservation, problems and prospects, Morgan,
RPC (ed). John Wiley: Chichester; 293-302.
Bower MM. 1959. A summary of available evidence and a further investigation of the
causes, methods and results of erosion in blanket peat. Unpublished M.Sc. thesis,
University of London.
Bower MM. 1960 Peat erosion in the Pennines. Advancement of Science 64: 323-331.
Bowyer-Bower TAS. 1993. Effects of rainfall intensity and antecedent moisture on the
steady-state infiltration rate in a semi-arid region. Soil Use and Management9: 69-76.
Bowyer-Bower TAS and Burt TP. 1989. Rainfall simulators for investigating soil
response to rainfall. Soil Technology2: 1-16.
Burt TP. 1996. The hydrology of headwater catchments. In River flows and channel
Burt TP. and Gardiner AT. 1984. Runoff and sediment production in a small
peat-covered catchment: some preliminary results. In Catchment experiments in fluvial
geomorphology, Burt TP and Walling DE (eds). Geobooks: Norwich; 133-52.
Burt TP, Heathwaite AL and Labadz JC. 1990. Runoff production in peat
covered-catchments. In Process Studies in Hillslope Hydrology, Anderson MG and Burt, TP
(eds). John Wiley: Chichester; 463-500.
Burt TP, Labadz JC and Butcher DP. 1997. The hydrology and fluvial geomorphology
of blanket peat: implications for integrated catchment management. In Blanket Mire
Degradation, Causes, Consequences and Challenges, Proceedings, University of
Manchester, 9-11 April 1997, Tallis JH, Meade R and Hulme PD. (eds). Mires Research
Group, British Ecological Society; 121-127.
Burt TP, Adamson JK and Lane AMJ. 1998a. Long-term rainfall and streamflow
records for north central England; putting the Environmental Change Network site at
Moor House National Nature Reserve in context. Hydrological Science Journal 43:
775-787.
Burt TP, Holden J and Evans MG. 1998b. The hydrology of blanket peat with special
reference to the Moor House NNR. In Geomorphological Studies in the North
Pennines: Field Guide, Warburton J (ed). British Geomorphological Research Group:
Burt TP, Evans MG and Warburton J. 1998c. Contemporary runoff and erosion in
blanket peat catchments on the Moor House National Nature Reserve. In Patterned
mires and mire pools: origin and development; flora and fauna, Proceedings,
University of Durham, 6-7 April, 1998, Standen V, Tallis JH and Meade R (eds). British
Ecological Society: Durham; 103-115.
Burke W. 1975. Aspects of the hydrology of blanket peat in Ireland. Hydrology of
marsh-ridden areas, Minsk, USSR, 1972. IAHS Studies and reports in hydrology, 19.
UNESCO Press: 171-182.
Cerda A. 1998. Relationships between climate and soil hydrological and erosional
characteristics along climatic gradients in Mediterranean limestone areas.
Geomorphology25: 123-134.
Costin AB and Gilmour DA. 1970. Portable rainfall simulator and plot unit for use in
field studies of infiltration, runoff and erosion. Journal of Applied Ecology7: 193-200.
Crisp DT. 1966. Input and output of minerals for an area of Pennine moorland: the
importance of precipitation, drainage, peat erosion and animals. Journal of Applied
Ecology 3: 327-348.
Dai TS and Sparling JH. 1973. Measurement of hydraulic conductivity of peats.
De Ploey J, Savat J, Moeyersons J. 1976. The differential impact of some soil factors on
flow, runoff creep and rainwash. Earth Surface Processes1: 151-161.
De Ploey J. 1984. Hydraulics of runoff and loess loam deposition. Earth Surface
Processes and Landforms9: 533-539.
Egglesmann RF, Heathwaite AL, Gross-Braukmann G, Kuster E, Naucke W, Schich M
and Schweikle V. 1993. Physical processes and properties of mires. In Mires, process,
exploration and conservation, Heathwaite AL and Gottlich Kh (eds). Wiley, Chichester,
171-262.
Erpul G, Gabriels D and Janssens D. 1998. Assessing the drop size distribution of
simulated rainfall in a wind tunnel. Soil and Tillage Research45: 455-463.
Evans MG and Burt TP. 1998. Contemporary erosion in the Rough Sike catchment,
Moor House National Nature Reserve, North Pennines. In Geomorphological Studies in
the North Pennines: Field Guide, Warburton J. (ed). British Geomorphological
Research Group: Durham; 37-45.
Evans MG, Burt TP, Holden J and Adamson J. 1999. Runoff generation and water table
fluctuations in blanket peat: evidence from UK data spanning the dry summer of 1995.
Francis IS. 1990. Blanket peat erosion in a mid-Wales catchment during two drought
years. Earth Surface Processes and Landforms 15: 445-456.
Foster IDL, Fullen MA, Brandsma RT and Chapman AS. 2000. Drip-screen rainfall
simulators for hydro- and pedo-geomorphological research: The Coventry experience.
Earth Surface Processes and Landforms25: 691-708.
Gardiner AT. 1983. Runoff and erosional processes in a peat-moorland catchment.
Unpublished M.Phil. thesis. CNAA: Huddersfield Polytechnic.
Hawkins RH. 1982. Interpretations of source area variability in rainfall-runoff relations.
In Rainfall-runoff relationship. Proceedings of the International Symposium on rainfall
runoff modelling held May 18-21, 1981, Mississippi State University. Water Resources
Publications: Littleton; 303-324.
Hobbs NB. 1986. Mire morphology and the properties and behaviour of some British
and foreign peats. Quarterly Journal of Engineering Geology 19:7-80.
Holden J. 2000. Runoff production in blanket peat covered catchments. Unpublished
Ph.D. thesis. University of Durham.
Holden J and Burt TP. 2000. The spatial and temporal distribution of runoff generation
In Seventh National Hydrological Symposium, University of Newcastle-upon-Tyne, 6-8
September 2000. British Hydrological Society: 2.89-2.96
Holden J, Burt TP and Cox NJ. 2001. Macroporosity and infiltration in blanket peat: the
implications of tension disc infiltrometer measurements. Hydrological Processes 15:
289-303.
Hudson NW. 1971. Soil conservation. Batsford: London; 320pp.
Imeson AC. 1983. Studies of erosion threshold in semi-arid lands: field measurements
of soil loss and infiltration in northern Morocco. In Rainfall simulation, runoff and soil
erosion, De Ploey J (ed). Catena Supplement 4: 79-89.
Imeson AC and Kwaad FJPM. 1990. The response of tilled soils to wetting by rainfall
and the dynamic character of soil erodibility. In Soil erosion on agricultural land,
Boardman J, Foster IDL, and Dearing JA. (eds). John Wiley: Chichester; 3-14.
Ingram, HAP. 1967. Problems of hydrology and plant distribution in mires. Journal of
Ecology55: 711-724.
Ingram, HAP. 1983. Hydrology. In Ecosystems of the World 4A, Mires: swamp, bog,
Ingram HAP and Bragg OM. 1984. The diptotelmic mire: some hydrological
consequences reviewed. In Proceedings of the Seventh International Peat Congress,
Dublin, 220-234.
Johnson GAL and Dunham KC. 1963. The geology of Moor House. Monographs of
Nature Conservancy, 2. H.M.S.O: London.
Kirkby MJ, Kneale PE, Lewis SL and Smith RT. 1995. Modelling the form and
distribution of peat mires. In Hydrology and Hydrochemistry of British Wetlands,
Hughes JMR and Heathwaite AL (eds). John Wiley: Chichester; 83-93.
Klove B. 1998. Erosion and sediment delivery from peat mines. Soil and Tillage
Research45: 199-216.
Kneale WR and White RE. 1984. The movement of water through cores of a dry
(cracked) clay-loam grassland topsoil. Journal of Hydrology67: 361-365.
Labadz JC. 1988. Runoff and sediment production in blanket peat moorland: studies in
the southern Pennines. Unpublished PhD thesis. Huddersfield Polytechnic.
Labadz JC, Burt TP and Potter AWR. 1991. Sediment yield and delivery in the blanket
peat moorlands of the Southern Pennines. Earth Surface Processes and Landforms 16:
Laws JO and Parsons DA. 1943. The relation of raindrop size to intensity. Transactions
of the American Geophysical Union24: 452-60.
Lusby GC. 1977. Determination of runoff and sediment yield by rainfall simulation. In
Research techniques, erodibility and sediment delivery, Toy TJ (ed). Geobooks:
Norwich; 19-30.
Manley G. 1936. The climate of the northern Pennines: the coldest part of England.
Quarterly Journal of the Royal Meteorological Society62: 103-115.
Manley G. 1942. Meteorological observations on Dun Fell, a mountain station in
northern England. Quarterly Journal of the Royal Meteorological Society68: 151-165.
Marsh TJ and Sanderson FJ. 1997. A review of hydrological conditions throughout the
period of the LOIS monitoring programme - considered within the context of the recent
UK climatic volatility. Science of the Total Environment 194: 56-69.
McDonald MC and Harbaugh AW. 1988. MODFLOW, A modular three-dimensional
finite difference ground water flow model. U.S. Geological Survey Open-File Report
83-875, Chapter A1, Washington DC.
Neuman, SP and Dasberg S. 1977. Peat Hydrology in the Hula Basin, Israel: II.
Subsurface flow regime. Journal of Hydrology32: 241-256.
Philip JR. 1957. The theory of infiltration 1. The infiltration equation and its solution.
Soil Science83: 345-357.
Philip JR. 1958 The theory of infiltration 6. Effect of water depth over soil. Soil Science
85: 278-286.
Pilgrim DH and Huff DD. 1983. Suspended sediment in rapid subsurface stormflow on
a large field plot. Earth Surface Processes8: 451-453.
Price JS. 1992. Blanket bog in Newfoundland: Part 2. Hydrological processes. Journal
of Hydrology135: 103-119.
Romanov VV. 1968. Hydrophysics of bogs. Israel Programme for Scientific
Translations: Jerusalem: 299pp.
Romkens MJM, Glenn LF, Nelson DW and Roth CB. 1975. A laboratory rainfall
simulator for infiltration and soil detachment studies. Soil Science Society of America
Proceedings39: 158-160.
Rycroft DW, Williams DJA and Ingram HAP. 1975. The transmission of water through
Schiff L. 1953. The effect of surface head on infiltration rates based on the performance
of ring infiltrometers and ponds. Transactions of the American Geophysical Union 34:
257-266.
Skaggs, R.W. (1980) Drainmod Reference report. Methods for design and evaluation of
drainage water management systems for soils with high water tables. USDA, Fort
Worth, Texas.
Smithson PA. 1985. The present climate of the Northern Pennines. In Field Guide to the
Periglacial Landforms of Northern England, Boardman J (ed). Quaternary Research
Association: Cambridge; 1-3.
Slattery MC. 1994. Contemporary sediment dynamics and sediment delivery in a small
agricultural catchment, north Oxfordshire, UK. Unpublished Ph.D thesis. University of
Oxford.
Tallis JH. 1973. Studies on southern Pennine peats V. Direct observations of peat
erosion and peat hydrology at Featherbed Moss, Derbyshire. Journal of Ecology 61:
1-22.
Tricker AS. 1977. Infiltration characteristics of a small Pennine catchment in
Von Post L. 1922. Sveriges Geologiska Undersoknings torvinventering och nogra av
dess hittils vunna resultat (SGU peat inventory and some preliminary results). Svenska
Mosskulturforeningens Tidskrift, Jonkoping, Sweden,36: 1-37.
Walling DE. 1983. The sediment delivery problem. Journal of Hydrology65: 209-237.
Webb BW and Walling DE. 1984. The magnitude and frequency of suspended sediment
transport in Devon rivers. In Catchment experiments in fluvial geomorphology, Burt TP
and Walling DE (eds). John Wiley: Chichester; 399-415.
Webb JDC. 2000. TORRO Tornado division report: July 1998. Journal of Meteorology,
Table 1. Mean, maximum and minimum measured infiltration capacities, mm hr-1, of
blanket peat; data from Gardiner (1983) and Labadz (1988).
Mean Maximum Minimum n
Gardiner (1983)
single-ring constant-head infiltrometer – 20 measurements
Eriophorum Empetrum hummocks
2.1 28.7 8.3 100.0 0.0 9.2 10 10
Mean Maximum Minimum n
Labadz (1988)
rainfall simulation – intensities from 39 to 96 mm hr-1 on 5 0.25 m2 plots, short duration.
1 Eriophorum plot 4 bare peat plots
Table 2. Means (x), standard deviations (σ) and number of runs (n) in each case of time to steady-state runoff production from the rainfall simulation plots, minutes
rainfall intensity, mm hr-1
depth, cm
3 6 9 12 mean 3 to 12
0 x σ n 70 24 21 76 19 22 50 20 22 45 40 23 60 34 88
5 x
σ n 67 29 21 74 18 21 49 17 21 40 26 21 58 31 84
10 x
σ n 57 30 13 81 26 13 45 21 14 50 48 15 58 38 55
mean x
Table 3. Mean and standard deviations (in brackets) for infiltration rate, mm hr –1 and runoff rate for field rainfall simulation experiments, Spring 1999.
Intensity, mm hr-1 3 6 9 12
Mean infiltration rate at steady-state, mm hr-1
2.04 (0.73)
4.02 (1.21)
5.51 (1.78)
7.02 (2.42)
Minimum infiltration rate at steady-state, mm hr-1
0.89 1.31 2.40 3.52
Mean % of applied rainfall infiltrating at steady-state
67.94 (24.35)
67.02 (20.19)
61.22 (19.83)
58.51 (20.21)
Mean % overland flow rates at steady- state
32.06 32.98 38.78 41.49
Number of runs with no overland flow 3 3 2 1