Does
fl
ow variance affect bedload
fl
ux when the bed is dominated by
grain roughness?
James R. Cooper
⁎
Department of Geography, University of Sheffield, Sheffield, S10 2TN, UK
a b s t r a c t
a r t i c l e i n f o
Article history: Received 3 March 2011
Received in revised form 20 December 2011 Accepted 23 December 2011
Available online 31 December 2011
Keywords: Grain roughness Near-bedflow Bedload transport Spatialflow variability Water-worked gravel beds Laboratoryflume
Previous studies have shown that spatial variance influid and critical shear stress, caused by form roughness, can increase bedloadflux. Others have revealed that variance inflow velocity increases with relative submer-gence and that bed mobility is reduced at lower submersubmer-gences. The paper explores the link between these observations and addresses the following questions: is grain roughness sufficient to cause variance influid shear stress and an increase in bedloadflux; if this variance changes with submergence, does this mean that the increase is dependent on submergence; and does this explain the change in mobility with submer-gence? A simple, statistical bedload model, based on spatial distributions offluid and critical shear stress, has been used to explore these effects over a water-worked gravel deposit. Estimates of spatially distributedfluid shear stress were gained from laboratoryflume measurements of near-bedflow velocity, and a distribution of critical shear stress was simulated using a discrete particle model of the sediment distribution used in the flume. The velocity data were used to describe the change in the spatial distribution of near-bed velocity with relative submergence, which allowed the effects of submergence onflux to also be considered. The main conclusions were: (i) spatial variance influid shear stress from grain roughness was not sufficient to have an appreciable effect on bedloadflux over water-worked gravel beds with a spatial distribution of crit-ical shear stress; (ii) spatial variance in critcrit-ical shear stress, caused by grain roughness, had a much larger in-fluence and increased bedloadflux. This was a similar level of increase observed in studies for conditions where form roughness was high; (iii) spatially averaged estimates offluid and critical shear stress should not be used to estimate bedloadflux even if form roughness is low; and (iv) a rise in relative submergence increased bedloadflux. This was due to changes in the spatial distribution of near-bed velocity and not due to a lowering in the localflow velocity as has been suggested by previous studies.
© 2011 Elsevier B.V. All rights reserved.
1. Introduction
Bedload transport is a controlling factor in the morphological change of gravel-bed rivers. It is a nonlinear process so the bedload flux within a river depends not only on the mean values offluid and critical shear stress but also on their spatial variances. In gravel-bed rivers, the surface of a water-worked sediment deposit is spatially complex and highly three-dimensional because of the presence of bedforms occurring at different roughness scales. Commonlyfluid shear stress is subdivided into two components: (i) the shear stress caused by the resistance of grains (grain roughness); and (ii) the stress caused by the resistance of the form of the river bed (form roughness). It is well established that grain roughness, caused by things like grain shape, orientation, exposure, sorting, packing and protrusion, controls the distribution of critical shear stress at this granular scale (e.g.,Wiberg and Smith, 1987; Kirchner et al., 1990;
Buffington et al., 1992). Less is known about the spatial variance in fluid shear stress, which occurs because of this grain roughness, and its effect on bedloadflux. Up until now, focus has been on examining the influence of form roughness on the variance influid shear stress and how this affects bedloadflux.
For example,Ferguson (2003)developed an analytical model to quantify the effect of lateral variability influid shear stress, caused by changes in channel planform, on bedload transport capacity. He examined its influence on bedloadflux for beds with and without spatial variability in critical shear stress. The lateral variability was simulated by using a statistical model that described a theoretical probability distribution for the lateral distribution of shear stress. This allowed both the mean and variance of the distributions to be changed, allowing different degrees of lateral variability in fluid shear stress to be applied. He found that the bedloadflux was consid-erably greater when a lateral variation influid shear stress was pre-sent, such that bedload flux increased with the variance of fluid shear stress. He showed that lateral variability influid shear stress can produce bedloadfluxes more thanfive times greater than those predicted for an invariant fluid shear stress. In a similar fashion, ⁎ Tel.: +44 114 222 7989; fax: +44 114 222 7907.
E-mail address:j.cooper@sheffield.ac.uk.
0169-555X/$–see front matter © 2011 Elsevier B.V. All rights reserved. doi:10.1016/j.geomorph.2011.12.039
Contents lists available atSciVerse ScienceDirect
Geomorphology
Paola (1996) outlined a model of flow and bedload transport for braided rivers. He used the spatial probability distribution offlow depth as a surrogate measure of the distribution offluid shear stress. His model showed, iffluid shear stress is assumed to be invariant, bedload transport calculations will underestimate bedloadflux by a factor of around three. Nicholas (2000) further developed this model to account for the relationship betweenflow discharge and the distribution offlow depth at a cross section of a braided river. The revised model showed that lateral variability influid shear stress exerts the most influence on bedload flux at lowflows, in which bedloadfluxes were two to three times greater than those predicted with invariantfluid shear stress. All previous attempts to quantify the effect of spatial variance influid shear stress on bedloadflux have not been based on velocity measurements.
For beds without any notable form roughness, studies have revealed that theflow is also spatially heterogeneous. For example, low-speed wall streaks, near-wall region bursts (ejections and sweeps), and large-scaleflow structures occupying the wholeflow depth have been described (e.g.,Grass and Mansour-Tehrani, 1996; Shvidchenko and Pender, 2001; Hardy et al., 2009). Also significant spatial variability in time-averaged velocity has been observed (e.g., Lawless and Robert, 2001; Mignot et al., 2009) and shown to have an effect on thefluid shear stress distribution (e.g., Aberle et al., 2008; Cooper and Tait, 2010).
The spatial structure of theflowfield is dependent on relative sub-mergence (ratio offlow depth to roughness length scale). This has been observed at the grain scale, as well as at the patch and reach scales. Measurements both in the laboratory and in thefield have shown that large-scaleflow structures scale withflow depth: their length is typically three tofiveflow depths, and they have a width
and height that is more or less equal to one flow depth
(Shvidchenko and Pender, 2001; Roy et al., 2004). An increase in flow depth has also been shown to increase the degree of spatial variability in the turbulent (Lamarre and Roy, 2005; Buffin-Bélanger et al., 2006) and time-averaged properties of the flow (Clifford, 1996; Buffin-Bélanger et al., 2006), as well as influence its spatial structure (Lamarre and Roy, 2005; Legleiter et al., 2007; Cooper and Tait, 2008; Hardy et al., 2009). This led some to conclude thatflow depth has a strong control on flow structure in gravel-bed rivers (Roy et al., 2004; Lamarre and Roy, 2005; Legleiter et al., 2007).
Relative submergence also has an important influence on the mo-bility of a gravel bed. A number of studies have highlighted that the meanfluid shear stress at which sediment is entrained is positively correlated to channel slope (e.g.,Ashida and Bayazit, 1973; Bathurst et al., 1983; 1987; Shvidchenko and Pender, 2000; Mueller et al., 2005; Pender et al., 2007; Lamb et al., 2008; Parker et al., 2011). The reduced mobility on steep slopes has been attributed to a lower relative submergence (e.g., Buffington and Montgomery, 1997; Shvidchenko and Pender, 2000; Mueller et al., 2005; Lamb et al., 2008; Parker et al., 2011), and not to changes in form roughness (Mueller et al., 2005; Parker et al., 2011) or increased drag from chan-nel walls and morphologic structures (Lamb et al., 2008). The correla-tion can exist when only grain roughness dominates. Studies have suggested that this occurs because a lower relative submergence causes a decrease in localflow velocity around bed particles (Ashida and Bayazit, 1973; Graf, 1991; Lamb et al., 2008). This has yet to be confirmed with velocity measurements.
In short, evidence exists that (i) spatial variance influid shear stress, caused by form roughness, influences bedload transport capac-ity; (ii) variance inflow velocity is present at the grain scale; (iii) its distribution and magnitude change with relative submergence; (iv) relative submergence affects bed mobility when only grain roughness dominates; and (v) that grain-scale changes in near-bedflow velocity could cause this change in mobility. No study has explored how this evidence links together and so a number of important questions re-main unanswered: (i) is grain roughness sufficient to cause variance
influid shear stress and an increase in bedload flux in a similar manner to form roughness; (ii) if this variance changes with submer-gence, does this also mean that the increase is dependent on submergence; and (iii) does this explain the change in mobility?
This paper attempts to address these questions. A series of labora-tory tests were performed over a water-worked gravel bed in which spatially distributed velocity measurements were made of the near-bed flow field. The bed had no notable form roughness elements and was dominated by granular roughness. By carrying out the veloc-ity measurements at various flow depths, the effect of relative submergence on the near-bed velocity distribution was sought. A discrete particle model (DPM) was used to simulate a spatial distribu-tion of critical shear stress for the sediment deposit used in the labo-ratory experiments. These data are incorporated into a simple, statistical bedload transport model that allows the effects of variance influid and critical shear stress, as well as relative submergence, on bedloadflux to be isolated. The aim of the paper is to (i) describe the change in the spatial probability distribution of time-averaged velocity with relative submergence; (ii) estimate how these changes inflow influence bedloadflux; (iii) estimate how relative submergence affects bedloadflux; and (iv) understand how variance in critical shear stress affect the results in (ii) and (iii).
2. Methodology
2.1. Experimental setup
The tests were conducted in an 18.3 m-long, 0.5 m-wide laborato-ryflume, with a working length of 15 m, which could be tilted to pro-duce a range offlume slopes. A mixture with a log-normal, unimodal grain size distribution (0.15 mmbDb14 mm; D16= 3.50 mm;
D50= 4.97 mm; D84= 7.00 mm) was used to produce a water-worked gravel deposit. This was formed by feeding material into running water, with the feed rate being twice the estimated transport capacity of theflow. Further details on this methodology and the surface topography of the bed can be found in Cooper and Tait (2009). Briefly, the bed was water-worked and dominated by granu-lar roughness with no notable form roughness elements (standard deviation = 2.14 mm; range = 15.2 mm; skewness = 0.10; kurto-sis = 2.84). At the granular scale, the particles were well imbricated, and an abundance of particle clusters along the whole length of the deposit were evident. The bed had a number of properties that closely resembled those found for natural water-worked gravel beds that are dominated by grain roughness: (i) the distributions of the bed surface elevations were positively skewed; (ii) the vertical roughness length scales were less than half the horizontal roughness length scales, i.e., the grain roughness scales were appropriately scaled; (iii) the two-dimensional structure function displayed two distinct regions: a scal-ing region at small spatial lags and a saturation region at large scales; (iv) the contour plots of the two-dimensional structure function revealed an elliptical shape that extends to scales several times the median grain diameter, indicating the presence of grain-scale sedi-mentary structures and an anisotropic bed structure; and (v) prefer-ential particle orientation and direction of imbrication in the subsurface, as well as bulk porosity and hydraulic conductivity values that closely resemble those found in poorly sorted gravel lithofacies of in-channel fluvial deposits. This showed that the fed bed was able to simulate, in a simplified manner, both the grain roughness and subsurface properties of established gravel-bed river deposits.
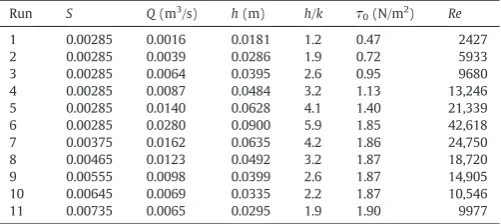
and the downstream weir was adjusted to achieve uniform depth for as large a reach as possible. Theflow depth was measured using a ver-nier point gauge located on theflume rails. The experimental runs were divided into two phases. The first phase of the tests was designed to investigate the effect of a change in relative submergence at a single bed slope (runs 1–6 inTable 1). Differentflow depthsh
were created using differentflow discharges. In the second phase, ex-perimental runs were carried out that used a combination of different flow discharges and bed slopes so that the mean bed shear stress was almost identical (±3%) for each run (runs 6–11 inTable 1).
The use of aflume provided a number of advantages to carrying out the tests in thefield: it was possible to (i) provide a more detailed spatial investigation of the near-bedflowfield than would have been feasible within a gravel-bed river. This was important given that pre-vious attempts to examine the effect of spatial variance influid shear stress on bedload flux have relied on theoretical distributions (Ferguson, 2003) or the assumption that the spatial distribution of flow depth can act as a suitable surrogate (Paola, 1996; Nicholas, 2000). (ii) Conduct tests at the same mean bed shear stress by using different combinations of flow depths and bed slopes. This would not have been possible within thefield. (iii) Conduct tests at different bed slopes but with the same bed surface topography. Again impossible within thefield.
2.2. Velocity measurements
A two-dimensional particle image velocimetry (PIV) system was used to provide detailed spatial measurements of fluid velocity above the gravel deposit. Many previous approaches to utilise PIV to study the hydrodynamics offlows over rough sediment boundaries have taken measurements at one lateral position across the bed by using a vertical light sheet orientated normal to the bed surface (in a vertical plane) (e.g.,Campbell et al., 2005; Sambrook Smith and Nicholas, 2005; Hardy et al., 2009). A different approach was adopted here, whereby the light sheet was located parallel to the deposit sur-face to obtain streamwise and lateral velocities at one vertical height above the bed. This allowed velocity measurements at many more measurement locations over the deposit than is possible with the use of PIV in a vertical plane. In addition, it enabled the characterisa-tion of the areal variability in streamwise velocities; this is important if the range offluid drag forces on surface sediment grains are to be examined. For every experimental run, baring runs 1 and 11, PIV measurements were taken at six different heights above the bed: 3, 5, 7, 9, 11 and 18 mm above the maximum bed elevation. For run 1, heights of 11 and 18 mm were not measured because they were too close to the water surface, and for run 11, the PIV data for heights of 11 and 18 mm was lost during backup. The light sheet had a thickness of ~2 mm so measurements were not possible closer than 3 mm to
the maximum bed elevation. This was to ensure there was no inter-ference between the light sheet and the deposit surface. The mea-surements made at all the different heights will be used to analyse the velocity distributions, whereas only those at a height of 3 mm will be used for investigating the effects on bedloadflux.
The cameras imaged a measurement area of 198.4 × 200.0 mm2at 9.1 m from the inlet. An interrogation area of 3.15 × 3.15 mm2was used in the cross-correlation of the images and allowed theflow field to be measured close to the grain scale. These areas were over-lapped by 50% in both the streamwise and lateral direction. This arrangement provided 62 velocity measurements in each lateral direction and 61 measurements in each streamwise direction, and resulted in 3782 measurement locations within the image area. The flow was sampled for 5.5 min at a frequency of 9 Hz. For each PIV plane, the measurements were used to derive the time-averaged streamwise velocityū for each of the measurement locations over the bed. This enabled the double-averaged (time and space averaged) streamwise velocity〈ū〉to be calculated at a given height above the bed. The probability density functions of the distributions ofū/〈ū〉 will be examined, along with their statistical moments. This informa-tion will be used to describe the change in the spatial distribuinforma-tion of time-averaged velocity with relative submergence.
The distributions will be compared for the different hydraulic con-ditions at the same relative heightz/k. The datum heightz is the height above the maximum bed elevation (roughness crest), andk
is the bed geometric roughness height (equal to the range of bed sur-face elevations). These estimates are derived from a laser scan of an area of bed covering the PIV measurement area. Runs are compared at the same height relative to the roughness height, rather than relative toflow depth, because previous studies have shown that the vertical change in the spatial properties of theflow scale well with
k(e.g.,Manes et al., 2007; Aberle et al., 2008; Cooper and Tait, 2010).
2.3. Modelling the effect of spatial variance on bedloadflux
To investigate the effect offluid and critical shear stress variance on bedload flux, a statistical model of bedload transport used by Ferguson (2003)is modified. It is used in three ways. First to compare the bedloadflux with variance influid shear stressτand no variance in critical shear stressτcto the bedloadflux when both are assumed invariant. This allows the effect of variance inτto be isolated from the effects of variance inτc. Secondly to understand how this compar-ison changes when variance inτcis incorporated. Finally to compare the bedloadflux with variance in bothτandτcto one where both are assumed invariant. This will allow the applicability of spatially averaged estimates of bedloadflux to be assessed.
All approaches use the same form of equations. The total bedload fluxQb[L3T−1] over some widthwis estimated using the Meyer-Peter and Müller (1948)transport function
Qb¼wa ∫ ymax
0
y1:5p yð Þdy ð1Þ
whereais an empirical coefficient,y=τ−τc, andp(y) is the proba-bility density function ofy. Eq.(1)is used to calculate theflux when one or both ofτandτcare set as variable. If both are assumed constant, the spatially averaged bedloadflux is given by
〈Qb〉¼wa½〈τ〉−〈τc〉
1:5
ð2Þ
where the angled brackets denote a spatial average.
For thefirst stage of the analysisyin Eq.(1)is set equal toτ−〈τc〉 to give the bedloadflux with variableτ, denoted byQτ,〈τc〉. To com-pare this withflux with no variance in τand τc, the relativeflux
Q*
〈τc〉∗=Qτ,〈τc〉/〈Qb〉is examined. This means that the flux has arbi-trary units such thatQ*
[image:3.595.35.286.77.189.2]〈τc〉∗= 1 whenτis invariant andwandacan Table 1
A summary of the experimental conditionsa.
Run S Q(m3/s) h(m) h/k τ
0(N/m2) Re
1 0.00285 0.0016 0.0181 1.2 0.47 2427
2 0.00285 0.0039 0.0286 1.9 0.72 5933
3 0.00285 0.0064 0.0395 2.6 0.95 9680
4 0.00285 0.0087 0.0484 3.2 1.13 13,246
5 0.00285 0.0140 0.0628 4.1 1.40 21,339
6 0.00285 0.0280 0.0900 5.9 1.85 42,618
7 0.00375 0.0162 0.0635 4.2 1.86 24,750
8 0.00465 0.0123 0.0492 3.2 1.87 18,720
9 0.00555 0.0098 0.0399 2.6 1.87 14,905
10 0.00645 0.0069 0.0335 2.2 1.87 10,546
11 0.00735 0.0065 0.0295 1.9 1.90 9977
a
be set to any arbitrary value. For the second stage of analysis,Qbis compared to theflux given by settingy=〈τ〉−τc, denoted byQ〈τ〉,τc. Here the relativeflux is given byQ*
τc∗=Qb/Q〈τ〉,τc. In thefinal stage the relativeflux is given byQ*
b∗=Qb/〈Qb〉.
For thefirst part of the analysis the excess shear stressτ−〈τc〉will be varied to examine how the effect of the spatial variability changes for different levels of excess shear stress. This also allows the results to be better compared with the results inFerguson (2003)and to model different transport conditions. Ferguson (2003) identified that 1/c=〈τ〉/〈τc〉 is a dimensionless transport stage and that a gravel-bed river typically conveys most bedload when it attains a value of 1.2–1.4 (e.g.,Parker, 1978; Andrews, 1984; Paola, 1996), im-plyingc≈0.7–0.8. As such, Ferguson used acvalue of 0.8 to represent conditions of maximum bedload transport in a gravel-bed river. To simulate increasing amounts of sand within the bed he lowered the value ofc. The present paper follows this approach using〈τc〉=c〈τ〉 to give different (mean) levels of excess shear stress. Because a de-crease inc reflects afining of the bed surface,c is varied between 0.3 and 0.8, in which 0.8 represents the condition of maximum bed-load conveyance. The lower limit is based on the following reasoning. A gravel bed withD50= 2.00 mm is the lower end of the size range that would normally be used to classify a gravel bed (assuming a low sand proportion within the bed) (cf.Singer, 2008). Atc= 0.8, theD50 is 4.97 mm (the grain size of the deposit); assuming that
τc= 0.045(ρs−ρ)gD50, the ratio of τc for D50= 2.00 mm to τc at
D50= 4.97 mm is equal to 0.4. If 0.4 is multiplied byc= 0.8, this pro-duces a lower limit ofc= 0.3. This limit represents afine gravel bed. It is reasonable to use the same velocity spatial distributions for differentcvalues for two reasons. Firstly, the results from the PIV measurements indicate that the degree of spatial variance in velocity is similar to the levels measured over other gravel deposits (see below). Secondly, Sambrook Smith and Nicholas (2005) showed that the spatial patterns of meanflow velocity andfluid stress are broadly similar for gravel beds with varying degrees of sand deposi-tion (and thereforefining).
2.4. Estimation offluid shear stress
The velocity data from the laboratory tests is used to estimate the spatial distribution offluid stress. At a spatial locationx,yover the bed, it is given by
τx;y¼0:5ρCDu
2
x;yA ð3Þ
whereCDis the drag coefficient andAis the exposed frontal area of the sediment grains. This provides aspatialdistribution ofτover a water-worked gravel bed, rather than alateraldistribution, as mod-elled byFerguson (2003).
Eq. (3) provides “time-averaged” shear stress values, and the model therefore captures the effects offluid drag on bedloadflux under steady state conditions. The experimental approach allows thefluid shear stress to be estimated at 3 mm above the roughness crest, atz/k= 0.2. The totalfluid shear stress has an approximately linear profile within the region between this measurement height and the roughness crest for the range of studied submergences (Cooper and Tait, 2010). As such, the discrepancy between thefluid shear stress, estimated using near-bedflow velocities, and the stress experienced on the grain surface is consistent for the different exper-imental runs.
To compare the effects of spatial variability inτon bedloadflux for the different experimental runs, thefluid stress distribution is scaled by its spatial mean to give the dimensionlessfluid stressτ*. This has the added effect thatCDandAin Eq.(3)can have arbitrary values.
2.5. Estimation of critical shear stress
Measurements ofτcfor water-worked gravel beds are rare and we are not aware of any study that has measured its full distribution. Bottacin-Busolin et al. (2008)performed measurements at a level of shear stress just above the critical shear stress, so they were only able to characterise the lower range of critical entrainment velocities. Instead we have simulated the distribution ofτcusing a discrete par-ticle modelfirst developed byMcEwan and Heald (2001). The model estimates the distribution of near-bedflow velocities at the threshold of motion for all surface grains. Only a brief description is provided here; further details of the model can be found in Heald et al. (2004). The model represented individual grains as spheres and formed a sediment deposit with the same grain size distribution used in the laboratory tests. The deposit was formed by releasing the spheres in sequence into a stillfluid, each from a random position in a horizontal plane located well above the surface. Each particle fell under the influence of gravitational andfluid drag forces before it underwent a series of collisions with previously deposited particles and came to rest in a stable position. The submerged weight and the exposed area of the individual particles in the numerically depos-ited beds was then analysed to estimate the near-bedflow velocity that would cause the drag force to be capable of moving the individ-ual particles exposed on the surface. This was resolved by calculating the critical value of streamwise velocity that produced a destabilising moment sufficient to overcome the stabilising moment caused by the grain's submerged weight. Implicitly, therefore, the model accounts for the influence of grain roughness on critical shear stress. The mod-elled critical entrainment velocitiesucare shown inFig. 1. These are used to estimate the distribution ofτcthrough Eq.(3). The distribu-tion is assumed to be statistically stadistribu-tionary. To use the DPM data for the different hydraulic conditions,τcwill be scaled by its spatial mean to giveτ*
c ∗.
The use of a drag force term is justified for two reasons. Firstly, Schmeeckle et al. (2007)found a strong correlation between the in-stantaneous drag force acting on a grain and the inin-stantaneous streamwise velocity. This was not the case for the instantaneous velocity cross products or lift forces. Secondly, a number of studies have demonstrated that some aspect of streamwise velocity strongly correlates with sediment entrainment transport, but that the cross products of velocity have a poorer relationship with sediment en-trainment (Williams et al., 1989; Clifford et al., 1991; Papanicolaou et al., 2001). For example,Bottacin-Busolin et al. (2008)discovered that over half of the grain movements observed over a gravel bed were due to variations in the streamwise component of velocity,
0 0.5 1 1.5 2 2.5
0 0.01 0.02 0.03 0.04 0.05 0.06 0.07
[image:4.595.317.553.545.719.2]Relative frequency
Fig. 1.The modelled distribution of critical entrainment velocitiesucscaled by their
and only in a relatively small percentage of the cases (around a tenth) were they characterised by changes in the cross-product of temporal fluctuations in velocity.
3. Results
3.1. Effect of relative submergence on the spatial distribution offlow velocity
The probability density functions ofū/〈ū〉for all the experimental runs are shown inFig. 2. This is taken from the velocity measure-ments made at a relative height of z/k= 0.2, the lowest height above the deposit. They show the considerable spread inū. Some areas of the bed can experienceūvalues as low as 60% of〈ū〉, but others display values over 120% of〈ū〉. Therefore some areas have values that are over two times higher than others areas.Fig. 2also shows that the degree of spread in the values and the shape of the distributions differ between the experimental runs, varying with the value of relative submergence. This is investigated further in Figs. 3–4by examining the moments of the distributions. These are shown at different relative heights above the bed to demonstrate the consistency of the results.
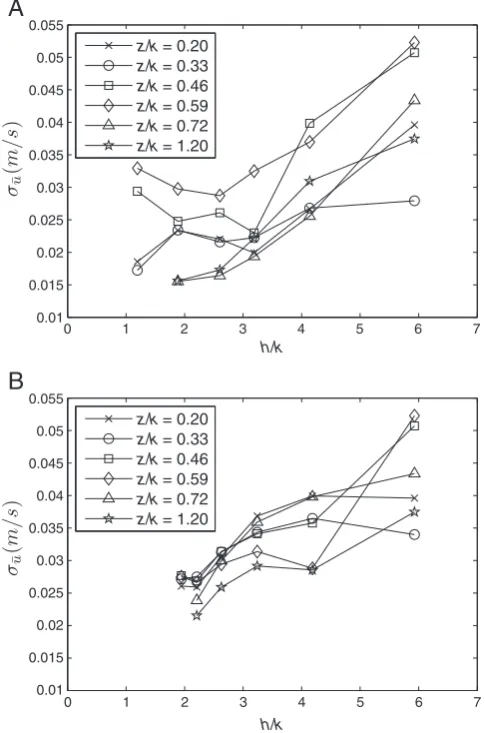
The standard deviation inū,σūis used as a measure of the degree
of spatial variance inū. Only absolute values of standard deviation will be compared between the different runs because the interest is in quantifying the variation in shape with a change in relative
submergence.Fig. 3reveals that, at the same values ofz/k,σūdisplays
a clear trend to increase with a rise in relative submergence. The skewness in the distribution ofūalso displays a clear change with relative submergence (Fig. 4A). As theflow becomes deeper, the distributions become less negatively skewed and more symmetri-cal in all but the test at the lowest submergence. This indicates that, typically, at lower submergences theflow over the bed has localised areas of distinctly low ū balanced by large areas of just slightly higher-than-averageū. As the submergence increases, theflow orga-nisation becomes more uniform. The distributions ofūare all nega-tively skewed, except for one distribution that is near symmetrical (run 6 atz/k= 1.2).
Fig. 4B shows that the kurtosis of the distributions ofūalso change with relative submergence. Typically distributions change from being leptokurtic at the low submergences to be being near-normal in peakedness at the higherflow depths. This reflects the change in skewness, showing that the distributions tend toward the shape of a normal distribution as submergence rises. The effects of the variance and changes with submergence on bedloadflux are now examined.
3.2. Effect offluid shear stress variance and relative submergence on bedloadflux
In thefirst stage of analysisτcis assumed to be invariant so that the effects of variance inτcan be isolated. The change inQ*
〈τc〉∗with excess shear stress is shown inFig. 5for the tests at a single bed
0.6 0.8 1 1.2 1.4
0 2 4 6 8 10
A
Probability density
h/k = 1.2
h/k = 1.9
h/k = 2.6
h/k = 3.2
h/k = 4.1
h/k = 5.9
0.6 0.8 1 1.2 1.4
0 2 4 6 8 10
B
Probability density
h/k = 1.9
h/k = 2.2
h/k = 2.6
h/k = 3.2
h/k = 4.2
[image:5.595.306.549.56.423.2]h/k = 5.9
Fig. 2.Probability density functions ofū/〈ū〉for the experimental runs performed at (A) a single bed slope and (B) the same mean bed shear stress atz/k= 0.2.
0 1 2 3 4 5 6 7
0.01 0.015 0.02 0.025 0.03 0.035 0.04 0.045 0.05 0.055
A
h/k z/k = 0.20
z/k = 0.33 z/k = 0.46 z/k = 0.59 z/k = 0.72 z/k = 1.20
0 1 2 3 4 5 6 7
0.01 0.015 0.02 0.025 0.03 0.035 0.04 0.045 0.05 0.055
B
h/k z/k = 0.20
z/k = 0.33 z/k = 0.46 z/k = 0.59 z/k = 0.72 z/k = 1.20
[image:5.595.43.274.343.720.2]slope and those at the same mean bed shear stress. Considering the two plots together, bedloadflux is greater whenτ is variant. At a low excess shear stress, bedload flux is nearly 40% higher than whenτ is invariant. This is because the increase in specificflux in areas of the bed with above-averageτis bigger than the decrease in specificflux in parts with below-averageτ.
The relative bedloadflux decreases with a rise in excess shear stress such that at a high excess, variance inτhas little influence. It implies that its effects are more important in low transport conditions.
Now focussing on the differences inQ*
〈τc〉∗between the different experimental runs,Fig. 5shows there is an increase influx with a rise in relative submergence both at a single bed slope and for the tests at the same mean bed shear stress. At low submergences, bed-loadflux can be 15% higher–but a factor of nearly 1.4 times larger at the highest submergences–than whenτis invariant. This increase is purely attributable to changes in the probability distribution ofτ.
Relative submergence has a more noticeable influence onQ*
〈τc〉∗ with a decrease in excess shear stress, and has little effect at high levels of excess shear stress. This is because the variance inτ in-creases with relative submergence, and this variance has a greater influence on bedloadflux at the lower values of excess shear stress.
3.3. Effect of critical shear stress variance on bedloadflux
The second stage of analysis involves examining the effect of variance inτ when the bed has a spatial distribution of τc.Fig. 6
summarises the change in Q*
τc∗ with relative submergence at
c= 0.8, along withQ*
〈τc〉∗for comparison. Data points are plotted for experimental runs undertaken both at a single bed slope and at the same mean bed shear stress. It shows that variance inτnow has little
0 1 2 3 4 5 6 7
−2 −1.5 −1 −0.5 0 0.5
A
B
h/k
0 1 2 3 4 5 6 7
2 3 4 5 6 7 8
h/k z/k = 0.20
z/k = 0.33 z/k = 0.46 z/k = 0.59 z/k = 0.72 z/k = 1.20
[image:6.595.53.288.56.419.2]z/k = 0.20 z/k = 0.33 z/k = 0.46 z/k = 0.59 z/k = 0.72 z/k = 1.20
Fig. 4.The change in (A) skewness and (B) kurtosis of the spatial distribution of time-averaged velocity with relative submergence at various heights above the bed.
0.2 0.3 0.4 0.5 0.6 0.7
1 1.1 1.2 1.3 1.4
h/k = 1.2
h/k = 1.9
h/k = 2.6
h/k = 3.2
h/k = 4.1
h/k = 5.9
0.2 0.3 0.4 0.5 0.6 0.7
1 1.1 1.2 1.3 1.4
h/k = 1.9
h/k = 2.2
h/k = 2.6
h/k = 3.2
h/k = 4.2
h/k = 5.9
A
[image:6.595.318.555.59.420.2]B
Fig. 5.The change in relative bedloadflux with excess shear stress for thefirst stage of analysis when only the effects of variance influid shear stress are considered. This is for the experimental runs performed at (A) a single bed slope; and (B) the same mean bed shear stress.
0 1 2 3 4 5 6 7
0.5 1 1.5 2 2.5 3 3.5 4
h/k
Relative bedload flux
[image:6.595.320.552.543.718.2]effect on bedloadflux. Incorporating variance inτccauses the spatial distribution of excess shear stress to be close to symmetrical; the in-crease in specificflux in areas of the bed with above-averageτis only slightly larger than the decrease in specificflux in parts with below-averageτ. This is related to the shape of the distributions ofτand
τc; the former is negatively skewed and the later is positively skewed. For the third stage of the analysis, the effect of assuming an invari-antτandτcis sought. TheQ*b∗values inFig. 6show bedloadflux is around four times under this assumption. When compared to the values from the previous two stages of analysis, clearly spatial vari-ability inτchas a much larger effect than variance inτ. This is because the spread of the distribution ofτcis much higher than that ofτ(see Figs. 1 and 2). The increased bedloadflux, caused by variance inτand
τc, is therefore primarily because the reduction influx from the more stable grains is significantly less than the increase influx from the less stable grains. This is caused by the positive skewness of the distribu-tion ofτc.
The bedloadflux shows the same trend observed earlier, increasing with relative submergence. This is a consistent trend, demonstrated by the overlapping of data points at the same levels of submergence but at different bed slopes. The differences between Q*
τc∗ and Q*b∗ reduce slightly with a rise in submergence. This indicates that the effects of var-iance inτcbecome slightly less important compared to the effects of variance inτat higher submergences (because variance inτrises with submergence).
4. Discussion
4.1. Spatial distribution offlow velocity
The velocity measurements revealed that the near-bed velocity distribution had a number of characteristics that closely matched those found both in gravel-bed rivers and other gravel beds in labora-toryflumes. First, the results revealed that the degree of spatial vari-ability inflow velocity increases with relative submergence. This was shown to be consistent throughout theflow. This is the same trend observed byClifford (1996)in a gravel-bed river, and the degree of increase inσūwith submergence is very similar to that predicted by
the regression model ofBuffin-Bélanger et al. (2006)for a water-worked gravel-bed surface in a laboratoryflume. In the laboratory tests in the current paper, an increase in relative submergence corre-sponds with an increase in Reynolds number (seeTable 1). As such, it shows thatσūalso increases with a rise in Reynolds number, and this
supports the laboratory observations of Hardy et al. (2009) for a water-worked gravel bed. Secondly, the degree of velocity variance compares favourably with those reported byfield studies in gravel-bed rivers (Smart, 1999; Byrd et al., 2000; Roy et al., 2004). Thirdly, the skewness and kurtosis values for the distribution of velocity revealed that the probability distributions tend toward the shape of a normal distribution as theflow became deeper. This supports the observations ofLegleiter et al. (2007) who found that the spatial structure of time-averaged velocity became more uniform with a rise inflow depth as the bed particles became increasingly drowned out. And also those ofLamarre and Roy (2005)who concluded that the distribution of the mean flow properties displayed a well-organised, coherent spatial pattern that was controlled by flow depth. The distribution shapes are also similar to those reported for other gravel beds (Barison et al., 2003; Cooper and Tait, 2009). Finally, all these results support the conclusions of others thatflow depth is an important control on flow structure over water-worked gravel beds (Roy et al., 2004; Lamarre and Roy, 2005; Legleiter et al., 2007). Overall this reveals that the trends that have been observed in the laboratory tests are consistent with results where both grain and form roughness effects are present, and theflow has a spatial dis-tribution that resembles features found over other gravel beds. This
provides assurance that it was appropriate to use this data in the bedload model.
4.2. Effect offluid shear stress variance
At the grain scale, variance inτonly had an appreciable influence on bedloadflux when the bed was assumed to have no variance inτc, when levels of excess shear stress were low, and when theflow had a high relative submergence. It had a negligible influence when the bed had a spatial distribution ofτc. Its largest influence was observed through its effect on the variation in bedload flux with relative submergence.
To compare these results to those ofFerguson (2003), who used a statistical model ofτ, a consideration must be made of the degree of spatial variance simulated in his study. He assumed shear stress to be below its mean valuer in a proportion pof the total channel width and to vary randomly between 0 andrwithinp. The spatial variability inτwas equal tor2p/3(1−p), and the influence of this spatial variability on bedloadflux was investigated by varying the pa-rameterp, which was used as a stress variance index and accounted for changes in channel planform. For sake of comparison, thepvalues for the PIV data can be estimated by examining the proportion of the distribution whereτb〈τ〉. This was found to range from 0.36 to 0.54 and corresponds well with Ferguson's thought that low values ofp
correspond toflume-like conditions. For apvalue of 0.5, thefluid shear stress was simulated byFerguson (2003)to be distributed uni-formly across the channel width between 0 and 2〈τ〉, so any direct comparisons are difficult. Nonetheless atc= 0.8 and with a constant
τc, he found a threefold increase in bedload conveyance compared toflows with no variance inτ.Paola (1996)andNicholas (2000) ap-plied their model to measurements from a laboratory-scaled model of a braided river and from a braided river in New Zealand for compara-ble conditions, in which they also assumed a spatially averaged value ofτc.Paola (1996)found that the increase was a factor of ~3, and Nicholas (2000) discovered a range of two to three. At similar p
values and c= 0.8 the increase in bedload flux from the velocity data is around half of that found by these previous studies.
The results from the laboratory showed that the effect of variance inτon bedloadflux increased with a lowering in excess shear stress. This supports the conclusions ofNicholas (2000), in which thefluxes estimated with and withoutτvariance also converged at the highest bedload transport rates. Overall, these comparisons suggest thatflow variance caused by grain roughness has the same, but reduced, effect on bedloadflux as when high levels of form roughness are present.
4.3. Effect of critical shear stress variance on bedloadflux
The results reveal that variance inτchas a much larger influence on bedloadflux than variance inτ. This is revealed through three ob-servations. First, when the analysis was repeated for the deposit used in theflume, which had a spatial distribution ofτc, the effects of var-iance inτon bedloadflux were negligible. Bedloadflux was only a few percent higher than whenτwas invariant.Ferguson (2003) ex-amined the influence of bed patchiness on bedloadflux for different scenarios, one of which was the effect of random patchiness, which most closely simulated the influence of grain roughness. His results also show a diminished effect. For example, at apvalue of 0.5 and
c= 0.8 his results revealed that the bedload flux increase is only around half of what it was when the bed was assumed to have no var-iance inτc.
Secondly, bedloadflux was around four times higher when bothτ
magnitude to the laboratory results–and about 3 times higher with just a variance inτ.
Finally, spatial variability inτccaused bedloadflux to be much higher. Bedload conveyance was around three times higher than when the bed was assumed to have no variance inτc. At apvalue of 0.5,Ferguson (2003)found the increase to be around 100–200%.
Overall then, variance inτcis observed to have a similar but larger effect on bedload flux in the laboratory tests than simulated by Ferguson (2003), even though the effects of grain roughness are only considered. This is because of a difference in the spread of the distributions. Ferguson (2003) simulatedτcto vary symmetrically by ±50% and ±100% around its mean value, producing a different distribution shape to the one simulated by the DPM. The DPM distri-bution had a much greater spread and a positively skewed shape (see Fig. 1) that acted to make its influence greater. It suggests that Ferguson (2003)underestimated the effects of form roughness on the distribution of τc, or that grain roughness effects are greater than commonly acknowledged.
4.4. Effect of relative submergence on bedloadflux
The changes in the spatial distribution ofτcaused the bedloadflux to increase with a rise in relative submergence. This increase was a consistent trend regardless of whetherτcwas variant or not. It oc-curred forflows at the same bed slope as well as at different bed slopes, and at the same submergence, the bedloadflux was almost identical. This supports the thought that a reduction in river width will, with other things being equal, lead to an increase in bedload transport. The changes with relative submergence are, however, more minor in comparison to those caused by variance inτc.
The effects of relative submergence were also slightly reduced whenτcwas variant. Given that variance inτincreased with relative submergence, this matches the pattern predicted byFerguson (2003). He found bedloadflux to rise more considerably with an increase in variance inτfor a bed with invariantτc.
A number of studies have highlighted that the mean bed shear stress at which sediment is entrained is positively correlated to chan-nel slope (e.g.,Ashida and Bayazit, 1973; Bathurst et al., 1983, 1987; Shvidchenko and Pender, 2000; Mueller et al., 2005; Pender et al., 2007; Lamb et al., 2008; Parker et al., 2011). Several arguments have been used to explain this relationship: in steeper rivers in-creased channel form roughness is present (Petit et al., 2005), stabi-lising bed structures and hiding effects are more prominent (Mueller et al., 2005), and flow aeration occurs (Wittler and Abt, 1995). None of these completely account for the effect of slope. The critical shear stress is still positively related to slope inflows where form roughness is low (Shvidchenko and Pender, 2000; Mueller et al., 2005; Parker et al., 2011), and the effect of slope is not caused by increased drag from channel walls and morphologic structures (Lamb et al., 2008).
Numerous studies have suggested that the reduced mobility on steep slopes can be attributed to a lower relative submergenceh/k
(e.g.,Buffington and Montgomery, 1997; Shvidchenko and Pender, 2000; Mueller et al., 2005; Lamb et al., 2008; Parker et al., 2011). The results in the present paper confirm this. Bedloadflux increased with a rise in submergence at a constant bed slope and over a bed with the same spatial distribution ofτc, which exhibited only grain roughness. Slope had an indirect effect.
Previous studies have hypothesised that the correlation between mobility and submergence arises because a lower relative submer-gence causes a decrease in localflow velocity around bed particles (Ashida and Bayazit, 1973; Graf, 1991; Lamb et al., 2008). Shvidchenko and Pender (2000)suggested this is caused by the in-creased effect of wake eddies shed from bed particles at higher slopes on the overallflow resistance.Lamb et al. (2008)demonstrate, using a one-dimensional force balance model, that the decrease in local
flow velocity is caused by a change in eddy viscosity (induced by the wakes) and not by a reduction influid stress caused by increased grain-inducedfluid drag.
The results in the present paper partially support this hypothesis. The results revealed that with the same distribution ofτcand the same meanτ(which was a result of grain-inducedfluid drag) an in-crease in bedloadflux with submergence still occurred. The increase was attributable purely to changes in the spatial distribution ofτ. These reflect a change in the distribution, rather than an overall lowering, of local near-bedflow velocity at the grain scale.
4.5. Implications for bedload modelling
Thefindings have a number of implications for bedload sampling, but the focus here will be on their implications for predicting bedload transport. The results have revealed that, even for beds where just grain roughness dominates, ifτcis assumed to be constant, the bed-load flux will be severely underestimated by a one-dimensional model of bedloadflux. However, a spatially averaged estimate ofτ
may be sufficient to achieve accurate calculations for water-worked sediment beds that have variance inτc. However smaller but signifi -cant errors do arise because of variance inτwhen the bed has no var-iance in τc. The implication is that one-dimensional estimates of bedloadflux should not be used in the design of irregular, artificial channels. Because of the correlation between bedloadflux and rela-tive submergence, one-dimensional estimates will be less accurate in wider channels and in higherflows.
Overall, the work suggests that the concept that bedload transport models can be calibrated by mean bed shear stress and applied across a range of submergences (e.g., during aflood) is aflawed one. It is the spatial distribution of excess shear stress that is important, and this will depend on the spatial organisation ofτ(which is influenced by the level of relative submergence) andτc(which will presumably de-pend on the bed surface topography). A more complete understand-ing on how the spatial variance inτandτcaffect bedloadflux, and how we might correct spatially averaged estimates, will require cov-ering a wider range and more diverse conditions than studied here. A number of questions therefore still remain. How do the spatial pat-terns ofτandτcchange with different roughness scales (and different combinations thereof), from patch to patch, section to section of riv-ers, and between rivers of different geometries? One could speculate that for sinuous channels where form roughness dominates, the spa-tial variance inτandτcis likely to be higher and the discrepancy be-tween modelled and measuredfluxes will be greater. This suggests it will be problematic to apply the same parameterised bedload trans-port model to differentflow, bed, and channel conditions.
Thus, the spatial distributions ofτandτcneed to be incorporated into bedload transport models for a given channel condition, not only to account for their variance but also the change in shape ofτwith relative submergence. Presently we know very little about the shape of the spatial distributions, let alone how they may vary in time dur-ing active transport. Efforts are required to estimate/measure spatial distributions ofτandτcto arrive at a fuller assessment of the infl u-ence of spatial variance inτandτcon bedloadflux and to understand the best way to incorporate their effects within bedload transport models. There are two issues that need to be resolved if this is to occur:
ignore the spatial complexity of gravel beds, or rely on site-specific coefficients. They are often only able to evaluate a spatially and/or temporally averaged shear stress and not at an individual grain or pore level. The present paper has used spatially distributed velocity measurements to estimate τ through a drag force equation Although these measurements are at the grain scale, it is not ideal because thefluid shear stress above the bed differs from the shear stress acting directly on the surface of a grain. Presently no methods exist to evaluate directly boundary shear stress. Spatially distribut-ed measurements within the roughness layer are requirdistribut-ed (see Cooper and Tait, 2010) over surfaces with different topographies so we can evaluate/parameterise the link between bed geometry and shear stress organisation.
• The author is not aware of any study that has been able to charac-terise fully the spatial distribution ofτcfor a gravel bed. This is a more acute problem because the results reveal that variability in
τchas a larger effect on bedloadflux. It has not been possible to validate the DPM simulations against observed data. Even to just explore the effects of grain roughness, grain-scale, simultaneous and co-located measurements ofτ, bed surface topography and grain displacement over a wide range ofτ/τcratios are required. The nature of the link between bed surface topography and grain-scaleτchas still not been examined despite modelling studies sug-gesting a strong link (seeMeasures and Tait, 2008). This data is required to parameterise transport models.
4.6. Implications for bed evolution
With all other things constant, spatial variability inτandτcwill cause variance in bedloadflux even when just grain roughness is pre-sent. At the grain scale it offers partial explanation as to why beds without any notable form roughness elements become armoured. One can speculate that grain roughness will be sufficient to create a sufficient degree of spatial variance influx to promote spatially non-synchronous sediment motion and size-selective transport.
Now consider the effects of aflood on bed evolution at the grain scale. If the effects of relative submergence onflux during aflood arefirst put to one side, previous studies show that as a bed becomes armoured, the standard deviation in bed elevations increases (Pender et al., 2001; Mao et al., 2011). It is likely that the variance inτcis cor-related with the variance in elevation, so the variance inτcwill also increase.Barison et al. (2003)showed, albeit with a limited data set, that the trend is for the distributions of near-bed, time-averaged ve-locities to also become more variable as the bed armours, and so caus-ing an increase in the variance inτ. This leads one to speculate that variance in bedloadflux will increase during armouring, reflecting the fact that entrainment becomes more size and spatially selective.
If the effects of relative submergence are added in to this scenario, during the rising limb theflux will be enhanced, along with the pace of degradation, relative to the increase influx that normally occurs with an increase in bed shear stress. During the falling limb, the de-crease in submergence will have a lowering effect onflux and cause a lessening in the pace of aggradation. However, because only signif-icant vertical sorting of sediment is likely to occur during the falling limb of the hydrograph (Hassan et al., 2006) and the effects of bed surface material changes onflux are greater, one can speculate that relative submergence will only have a noticeable effect during the rising limb.
Although the experimental design limited the study to examining grain roughness effects, a consideration of the influence of the results on large-scale bed evolution in gravel-bed rivers is worthwhile. This appears reasonable given that the results in the present paper matched the trends observed by Paola (1996), Nicholas (2000) and Ferguson (2003). One-dimensional sediment routing models (SRMs), which use width-averaged estimates ofτand τc, are com-monly used to model bed evolution (e.g.,Hoey and Ferguson, 1994;
Wong and Parker, 2006). Because the results in the present paper show that the level of underestimation made by one-dimensional calculations varies with excess shear stress and relative submergence, it is also likely to vary from section to section in most rivers. Therefore, not only will SRMs misrepresent the pace of aggradation or degrada-tion, they will also misrepresent its pattern. This will influence the abil-ity of an SRM to simulate the longitudinal patterns of change in bed elevation and the associatedfining or coarsening.
5. Conclusions
A simple, statistical bedload model has been used to examine the effect of variance influid and critical shear stress on bedloadflux over a water-worked gravel deposit. This was achieved by gaining es-timates of spatially distributed fluid shear stress from laboratory measurements of near-bedflow velocity and simulating the distribu-tion of critical shear stress using a DPM of the sediment distribudistribu-tion used in the laboratory. Only grain roughness effects on the variance influid and critical shear stress were considered. The velocity data were used to describe the change in the spatial distribution of near-bed velocity with relative submergence, which allowed the effects of submergence onflux to also be considered. These are the main conclusions:
(i) Spatial variance in fluid shear stress, because of variance in near-bed velocity, only caused an appreciable increase in bed-loadflux when the bed was assumed to have no variance in critical shear stress. It was much lower than has been observed by other studies in conditions where form roughness was high. (ii) The variance influid shear stress, caused by grain roughness, was not sufficient to have an appreciable effect on bedloadflux over water-worked beds with a spatial distribution of critical shear stress.
(iii) Spatial variance in critical shear stress, caused by grain rough-ness, had a much larger influence than variance influid shear stress on bedload flux. It increased bedload flux by nearly 400%. This was a similar level of increase observed in studies where form roughness was high.
(iv) The spatial variance in near-bed velocity increased and the spatial probability distributions tended toward the shape of a normal distribution with a rise in relative submergence. This occurred when the surface topography was invariant. (v) A rise in relative submergence caused an increase in bedload
flux. This was because of changes in conclusion (iv) and not because of a lowering in the local flow velocity as has been suggested by previous studies.
(vi) Spatially averaged estimates offluid and critical shear stress should not be used to estimate bedload flux, even if form roughness is low. Their spatial distributions need to be incor-porated into bedload transport models, not only to account for their variance but also the change in the shape of the distri-bution offluid shear stress with relative submergence.
Acknowledgements
I thank Simon Tait for providing access to the laboratory facilities, guidance on experimental design, numerous discussions, and com-ments on an early draft of this paper. Thanks also to Luca Mao for reading an early draft and improving its clarity, and two anonymous reviewers for helpful comments.
References
Aberle, J., Koll, K., Dittrich, A., 2008. Form induced stresses over rough gravel-beds. Acta Geophysics 56 (3), 584–600.
Ashida, K., Bayazit, M., 1973. Initiation of motion and roughness offlows in steep channels. Proceedings of the 15th Congress of the International Association for Hydraulic Research, Istanbul, Turkey. Int. Assoc. Hydraul. Res, Madrid, Spain, pp. 475–484. Barison, S., Chegini, A., Marion, A., Tait, S.J., 2003. Modifications in near bedflow over
sediment beds and the implications for grain entrainment. Proceedings of the 30th Congress of the International Association for Hydraulic Research, Thessalonki, Greece. Int. Assoc. Hydraul. Res, Madrid, Spain, pp. 509–516.
Bathurst, J.C., Graf, W.H., Cao, H.H., 1983. Initiation of sediment transport in steep channels with coarse bed material. In: Sumer, B.M., Muller, A. (Eds.), Mechanics of Sediment Transport. A.A. Balkema, Brookfield, VT, pp. 207–213.
Bathurst, J.C., Graf, W.H., Cao, H.H., 1987. Bed load discharge equations for steep moun-tain rivers. In: Thorne, C.R., Bathurst, J.C., Hey, R.D. (Eds.), Sediment Transport in Gravel-Bed Rivers. John Wiley & Sons, New York, NY, pp. 453–477.
Bottacin-Busolin, A., Tait, S.J., Marion, A., Chegini, A., Tregnaghi, M., 2008. Probabilistic description of grain resistance from simultaneousflowfield and grain motion mea-surements. Water Resources Research 44 (9). doi:10.1029/2007WR006224. Buffin-Bélanger, T., Rice, S., Reid, I., Lancaster, J., 2006. Spatial heterogeneity of
near-bed hydraulics above a patch of river gravel. Water Resources Research 42. doi:10.1029/2005WR004070.
Buffington, J.M., Montgomery, D.R., 1997. A systematic analysis of eight decades of incipient motion studies, with special reference to gravel-bedded rivers. Water Resources Research 33 (8), 1993–2029.
Buffington, J.M., Dietrich, W.E., Kirchner, J.W., 1992. Friction angle measurements on a naturally formed gravel streambed: implications for critical boundary shear-stress. Water Resources Research 28 (2), 411–425.
Byrd, T.C., Furbish, D.J., Warburton, J., 2000. Estimating depth-averaged velocities in rough channels. Earth Surface Processes and Landforms 25 (2), 167–173. Campbell, L., McEwan, I., Nikora, V., Pokrajac, D., Gallagher, M., Manes, C., 2005. Bed-load
effects on hydrodynamics of rough-bed open-channelflows. Journal of Hydraulic Engineering ASCE 131 (7), 576–585.
Clifford, N.J., 1996. Morphology and stage-dependentflow structure in a gravel-bed river. In: Ashworth, P.J., Bennett, S.J., Best, J.L., McLelland, S.J. (Eds.), Coherent Flow Structures in Open Channels. John Wiley & Sons, Chichester, UK, pp. 545–566. Clifford, N.J., McClatchey, J., French, J.R., 1991. Measurements of turbulence in the benthic boundary-layer over a gravel bed and comparison between acoustic measurements and predictions of the bedload transport of marine gravels. Sedimentology 38 (1), 161–166.
Cooper, J.R., Tait, S.J., 2008. The spatial organisation of time-averaged streamwise velocity and its correlation with the surface topography of water-worked gravel beds. Acta Geophysics 56 (3), 614–641.
Cooper, J.R., Tait, S.J., 2009. Water-worked gravel beds in laboratoryflumes—a natural analogue? Earth Surface Processes and Landforms 34 (3), 384–397.
Cooper, J.R., Tait, S.J., 2010. Examining the physical components of boundary shear stress for water-worked gravel deposits. Earth Surface Processes and Landforms 35 (10), 1240–1246.
Ferguson, R.I., 2003. The missing dimension: effects of lateral variation on 1-D calculations offluvial bedload transport. Geomorphology 56 (1–2), 1–14.
Graf, W.H., 1991. Flow resistance over a gravel: its consequences on initial sediment movement. In: Armanini, A., Di Silvio, G. (Eds.), Fluvial Hydraulics in Mountain Regions. Springer-Verlag, Berlin, Germany, pp. 17–32.
Grass, A.J., Mansour-Tehrani, M., 1996. Generalized scaling of coherent bursting structures in the near-wall region of turbulentflow over smooth and rough boundaries. In: Ashworth, P.J., Bennett, S.J., Best, J.L., McLelland, S.J. (Eds.), Coherent Flow Structures in Open Channels. John Wiley & Sons, Chichester, UK, pp. 40–61.
Hardy, R.J., Best, J.L., Lane, S.N., Carbonneau, P.E., 2009. Coherentflow structures in a depth-limitedflow over a gravel surface: the role of near-bed turbulence and influence of Reynolds number. Journal of Geophysical Research 114. doi:10.1029/2007JF000970. Hassan, M.A., Egozi, R., Parker, G., 2006. Experiments on the effect of hydrograph character-istics on vertical grain sorting in gravel bed rivers. Water Resources Research 42 (9). Heald, J., McEwan, I., Tait, S., 2004. Sediment transport over aflat bed in a unidirectional
flow: simulations and validation. Philosophy Transactions Royal Society A 362 (1822), 1973–1986.
Hoey, T.B., Ferguson, R., 1994. Numerical-simulation of downstreamfining by selective transport in gravel-bed rivers: model development and illustration. Water Resources Research 30 (7), 2251–2260.
Kirchner, J.W., Dietrich, W.E., Iseya, F., Ikeda, H., 1990. The variability of critical shear stress, friction angle, and grain protrusion in water-worked sediments. Sedimentology 37 (4), 647–672.
Lamarre, H., Roy, A.G., 2005. Reach scale variability of turbulentflow characteristics in a gravel-bed river. Geomorphology 68 (1–2), 95–113.
Lamb, M.P., Dietrich, W.E., Venditti, J.G., 2008. Is the critical Shields stress for incipient sediment motion dependent on channel-bed slope? Journal of Geophysical Research 113 (F2). doi:10.1029/2007JF000831.
Lawless, M., Robert, A., 2001. Scales of boundary resistance in coarse-grained channels: turbulent velocity profiles and implications. Geomorphology 39 (3–4), 221–238.
Legleiter, C.J., Phelps, T.L., Wohl, E.E., 2007. Geostatistical analysis of the effects of stage and roughness on reach-scale spatial patterns of velocity and turbulence intensity. Geomorphology 83 (3–4), 322–345.
Manes, C., Pokrajac, D., McEwan, I., 2007. Double-averaged open-channelflows with small relative submergence. Journal of Hydraulic Engineering ASCE 133 (8), 896–904.
Mao, L., Cooper, J.R., Frostick, L.E., 2011. Grain size and topographical differences be-tween static and mobile armour layers. Earth Surface Processes and Landforms 36 (10), 1321–1334.
McEwan, I., Heald, J., 2001. Discrete particle modeling of entrainment fromflat uniformly sized sediment beds. Journal of Hydraulic Engineering ASCE 127 (7), 588–597.
Measures, R., Tait, S., 2008. Quantifying the role of bed surface topography in controlling sediment stability in water-worked gravel deposits. Water Resources Research 44 (4). doi:10.1029/2006WR005794.
Meyer-Peter, E., Müller, R., 1948. Formulas for bed-load transport. Proceedings of the 2nd Meeting of the International Association for Hydraulic Structures Research, Stockholm, Sweden. Int. Assoc. for Hydraul. Struct. Res, Madrid, Spain, pp. 39–64. Mignot, E., Barthelemy, E., Hurther, D., 2009. Double-averaging analysis and localflow
characterization of near-bed turbulence in gravel-bed channelflows. Journal of Fluid Mechanics 618, 279–303.
Mueller, E.R., Pitlick, J., Nelson, J.M., 2005. Variation in the reference shields stress for bed load transport in gravel-bed streams and rivers. Water Resources Research 41 (4). doi:10.1029/2004WR003692.
Nicholas, A.P., 2000. Modelling bedload yield in braided gravel bed rivers. Geomorphology 36 (1–2), 89–106.
Paola, C., 1996. Incoherent structure: turbulence as a metaphor for stream braiding. In: Ashworth, P.J., Bennett, S.J., Best, J.L., McLelland, S.J. (Eds.), Coherent Flow Structures in Open Channels. John Wiley & Sons, Chichester, UK, pp. 705–723.
Papanicolaou, A.N., Diplas, P., Dancey, C.L., Balakrishnan, M., 2001. Surface roughness effects in near-bed turbulence: implications to sediment entrainment. Journal of Engineering Mechanics ASCE 127 (3), 211–218.
Parker, G., 1978. Self-formed straight rivers with equilibrium banks and mobile bed: part 2. The gravel-bed river. Journal of Fluid Mechanics 89, 127–146.
Parker, C., Clifford, N.J., Thorne, C.R., 2011. Understanding the influence of slope on the threshold of coarse grain motion: revisiting critical stream power. Geomorphology 126 (1–2), 51–65.
Pender, G., Hoey, T.B., Fuller, C., McEwan, I.K., 2001. Selective bedload transport during the degradation of a well sorted graded sediment bed. Journal of Hydraulic Research 39 (3), 269–277.
Pender, G., Shvidchenko, A.B., Chegini, A., 2007. Supplementary data confirming the relationship between critical Shields stress, grain size and bed slope. Earth Surface Processes and Landforms 32 (11), 1605–1610.
Petit, F., Gob, F., Houbrechts, G., Assani, A.A., 2005. Critical specific stream power in gravel-bed rivers. Geomorphology 69 (1–4), 92–101.
Roy, A.G., Buffin-Bélanger, T., Lamarre, H., Kirkbride, A.D., 2004. Size, shape and dynamics of large-scale turbulentflow structures in a gravel-bed river. Journal of Fluid Mechanics 500, 1–27.
Sambrook Smith, G.H., Nicholas, A.P., 2005. Effect onflow structure of sand deposition on a gravel bed: results from a two-dimensionalflume experiment. Water Resources Research 41 (10). doi:10.1029/2004WR003817.
Schmeeckle, M.W., Nelson, J.M., Shreve, R.L., 2007. Forces on stationary particles in near-bed turbulent flows. Journal of Geophysical Research 112 (F02003). doi:10.1029/2006JF000536.
Shvidchenko, A.B., Pender, G., 2000. Flume study of the effect of relative depth on the incipient motion of coarse uniform sediments. Water Resources Research 36 (2), 619–628.
Shvidchenko, A.B., Pender, G., 2001. Macroturbulent structure of open-channelflow over gravel beds. Water Resources Research 37 (3), 709–719.
Singer, M.B., 2008. Downstream patterns of bed material grain size in a large, lowland alluvial river subject to low sediment supply. Water Resources Research 44 (12). doi:10.1029/2008WR007183.
Smart, G.M., 1999. Turbulent velocity profiles and boundary shear in gravel bed rivers. Journal of Hydraulic Engineering ASCE 125 (2), 106–116.
Wiberg, P.L., Smith, J.D., 1987. Calculations of the critical shear-stress for motion of uniform and heterogeneous sediments. Water Resources Research 23 (8), 1471–1480. Williams, J.J., Thorne, P.D., Heathershaw, A.D., 1989. Measurements of turbulence in the
benthic boundary-layer over a gravel bed. Sedimentology 36 (6), 959–971. Wittler, R.L., Abt, S.R., 1995. Shields parameter in low submergence or steepflows. In:
Thorne, C.R., Abt, S.R., Barends, F.B.J., Maynord, S.T., Pilarczyk, K.W. (Eds.), River, Coastal and Shoreline Protection: Erosion Control Using Riprap and Armourstone. John Wiley & Sons, New York, NY, pp. 93–101.