Investigating the Genetic Basis of Cranial Cruciate
Ligament Rupture in the Newfoundland Dog
Thesis submitted in accordance with the requirements of the
University of Liverpool for the degree of Doctor in Philosophy
by
Arabella Elizabeth Gardiner Baird
University of Liverpool
- 2 -
Acknowledgements
I would like to thank each of my supervisors Stuart Carter, Andrea Short and John Innes for their help, support and guidance throughout my PhD. My thanks also go to all of the staff who worked with me in the Department of Infection Biology (Institute of Infection and Global Health) at the University of Liverpool, especially to Di Isherwood and Nick Evans. Acknowledgements also go to Dr Ana Alfirevic and Dr Dan Carr in the pharmacology department, for allowing me access to the Sequenom equipment and training me to use it.
I would also like to thank all owners and vets who collected and submitted samples to the project (which would not have been able to take place without them).
Grateful thanks goes to the UK Kennel Club Charitable trust for funding this project and my stipend.
Thanks also goes to the Newfoundland Dog Club of Canada , especially the BC Region for the kind donation of money to purchase a new laptop – indispensable in my PhD writing/data analysis etc. and for their enthusiasm in the project and in sample collection.
- 3 -
Table of Contents
Abstract ... 8
List of abbreviations ... 9
Chapter 1. Introduction ... 10
Cruciate ligaments – anatomy and function ... 11
Veterinary diagnosis and treatment of CCL rupture ... 12
Pathology of CCL rupture ... 14
Susceptibility ... 14
Ligament structure ... 15
Bone conformation ... 18
Degeneration of the ligament structure ... 22
Size and obesity of dogs ... 22
Hormonal influences ... 23
Autoimmune components ... 24
Major Histocompatibility Complex and CCL rupture ... 25
Genetics ... 26
Newfoundland dogs and CCL rupture ... 28
Canine genetic studies ... 30
Genetic variations ... 33
Aims of the Project ... 37
Chapter 2. General Materials & Methods ... 39
Clinical diagnosis and phenotypic status ... 40
Dogs included in the study ... 41
Sample Collection for DNA extraction ... 44
DNA extraction ... 46
Blood ... 46
Saliva ... 46
Cleanup of DNA ... 47
Ethanol purification of DNA ... 48
Chloroform Cleanup of DNA ... 48
Qiagen Column cleanup of DNA ... 49
Quantification, normalisation and storage of DNA ... 50
Tissue collection and culture of ligament cells ... 50
Ligamentocyte cell identification ... 51
Monolayer cultures ... 51
Lysis of monolayer cells using Trizol ... 52
Cryopreservation and resuscitation of cryopreserved cells ... 53
RNA extraction ... 54
Assessment of quality and quantity of RNA... 54
cDNA synthesis ... 55
General analysis and statistical methods ... 57
Chapter 3. Genome Wide Association Study (GWAS) ... 62
Introduction ... 63
Methods ... 65
-- 4 --
Illumina genotyping ... 66
Quality Assurance ... 67
Assessing population structure ... 67
Assessing Significance ... 70
Haplotype analysis of GWAS data ... 70
Overview of genome wide data analyses ... 73
Results ... 74
Population stratification within the Newfoundland dogs ... 74
High Density Illumina Array Newfoundlands ... 76
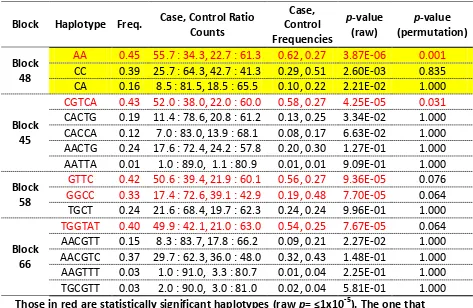
Haplotype associations ... 84
Low density Illumina Array – Labrador Retrievers and Golden Retrievers ... 92
Discussion ... 106
Low density data ... 109
Replication and validation of GWAS data ... 111
Chapter 4. GWAS validation study: SNP detection by Sequenom ... 112
Introduction ... 113
Methods ... 115
Sample selection ... 115
Sequenom genotyping ... 116
Assay design ... 117
PCR ... 118
iPLEX extension reaction ... 119
Mass Spectrometry ... 120
Quality Assurance ... 122
Results ... 123
Concordance between Illumina and Sequenom genotyping ... 123
Sequenom genotyping data ... 123
Discussion ... 139
Chapter 5. Candidate gene association with CCL rupture ... 149
Introduction ... 150
Methods ... 153
Sample selection ... 153
Candidate gene and SNP selection ... 153
Assay design ... 158
Quality assurance ... 158
Results ... 160
Discussion ... 169
Chapter 6. DLA typing of Newfoundlands with cruciate rupture... 176
Introduction ... 177
Methods ... 178
Sample selection ... 178
Primer design ... 179
PCR ... 179
DLA sequencing ... 180
Analysis of haplotypes... 181
Results ... 182
-- 5 --
Chapter 7. Quantitative gene expression analysis between ruptured & healthy CCL tissue ... 190
Introduction ... 191
Methods ... 193
Sample collection and storage ... 193
RNA Extraction ... 193
cDNA synthesis ... 194
Design of primers and probes ... 194
Reference gene selection ... 197
QPCR ... 198
Primer probe validation ... 200
Data analysis ... 201
Fold Change ... 201
Statistics ... 202
Results ... 203
Efficiency of primer/probe sets ... 203
Fold change ... 203
Discussion ... 207
-Chapter 8. Quantitative gene expression analysis in an in-vitro model of CCL rupture ... 214
Introduction ... 215
Methods ... 218
Sample collection ... 218
Sample preparation ... 219
Ligamentocyte stimulation with TNFα ... 219
RNA Extraction ... 221
cDNA synthesis ... 221
Design of primes and probes ... 221
Primer probe validation ... 221
QPCR ... 221
Data analysis ... 222
Fold Change ... 222
Statistics ... 222
Results ... 223
Fold Change ... 223
Discussion ... 227
Chapter 9. General Discussion & Conclusions ... 231
Introduction ... 232
Stratification ... 232
GWAS results ... 233
Candidate gene results ... 234
Changes in gene expression ... 235
DLA association ... 235
Conclusions ... 236
Chapter 10. References ... 238
-- 6 --
List of tables
Table 3.1. Significnat SNPs from each different analyses of the GWAS data. ... 81
Table 3.2. SNPs showing greatest association in the CMH GWAS data ... 82
Table 3.3. Haplotype blocks in chromosome 33. ... 89
Table 3.4. Haplotype blocks in chromosome 1. ... 90
Table 3.5. Most associated SNPs in Golden Retriever low density GWAS data. .. 96
Table 3.6 Most associated SNPs in Labrador Retriever low density GWAS data 98 Table 3.7. Most associated SNPs in the metaanalysis of the LD GWAS data .... 102
Table 3.8. Most significant SNPs in the metaanalysis of LD & HD GWAS data 105 Table 3.9. SNPs on chromosome 3 at position 68.2MB in the GWAS study. ... 109
Table 4.1. Cases and controls used for Sequenom ... 116
Table 4.2. Numbers of SNPs and cases and controls after QA ... 122
Table 4.3. Significantlyassociated SNPs in Newfoundlands. ... 125
Table 4.4. Significantly associated rupture SNPs in European Newfoundlands . 128 Table 4.5. Significantly associated SNPs in North American Newfoundlands. .. 130
Table 4.6. Significantly associated SNPs for the other breeds ... 132
Table 4.7. Intragenic SNPs shared by more than one breed ... 135
Table 4.8. Intergenic SNPs shared by more than one breed ... 136
Table 4.9. Metaanalysis of the most associated SNPs. ... 138
Table 5.1. Candidate genes and reason for inclusion ... 155
Table 5.2. Most associated SNPs in the Newfoundland CMH CG gene analysis 161 -Table 5.3. Associated SNPs in Newfoundlands from Europe, North America, Labrador Retrievers, Rottweilers & Staffordshire Bull Terriers in the candidate gene analyses ... 163
Table 5.4. Associated SNPs in the metaanalysis of the candidate gene data. .. 167
Table 6.1. DLA primers used for genotyping the DLA ... 179
Table 6.2. DLA haplotype frequencies, full cohort case control. ... 183
Table 6.3. DLA haplotype frequencies, European case control study. ... 183
Table 6.4. DLA haplotype frequencies, North American case control study. ... 184
Table 6.5. DLA haplotype frequencies, European versus North America ... 184
Table 7.1. Genes (including 3 reference genes) used for QPCR ... 196
Table 7.2. Fold change values for ruptured vs. healthy experiment. ... 206
-- 7 --
List of figures
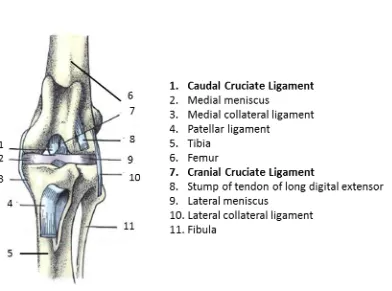
Figure 1.1. Cranial view of the stifle joint of the dog ... - 11 -
Figure 1.2. Microscopic structure of a tendon. ... - 15 -
Figure 1.3. Radiograph of the stifle joint. ... - 19 -
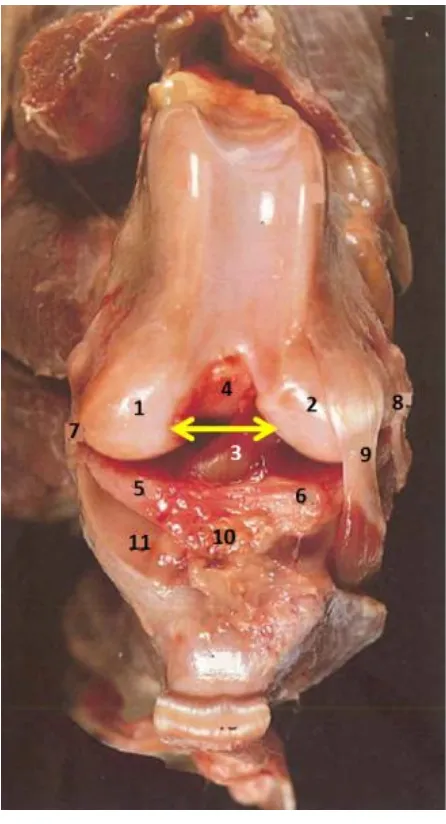
Figure 1.4. Cranial aspect of the stifle joint of a dog depicting the intercondylar notch .. - 21 -
Figure 1.5. Structure and form of a Newfoundland dog ... - 28 -
Figure 2.1. Three methods used to reverse transcribe RNA. ... - 56 -
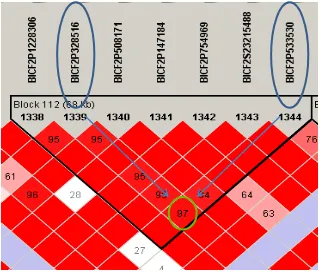
Figure 3.1. Haplotype LD plot example. ... - 72 -
Figure 3.2. Workflow methodology for the GWAS study. ... - 73 -
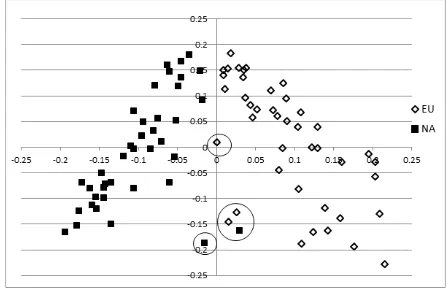
Figure 3.3. Eigenstrat PCA plot of the 81 Newfoundland dogs ... - 74 -
Figure 3.4. QQ plots and λ values of the GWAS data... - 75 -
Figure 3.5. Manhattan plot for CMH stratified GWAS analysis. ... - 77 -
Figure 3.6. Manhattan plot for EU Newfoundlands ... - 78 -
Figure 3.7. Manhattan plot for NA Newfoundlands. ... - 79 -
Figure 3.8. Manhattan plot for all Newfoundlands - EMMAX. ... - 80 -
Figure 3.9. LD plots chromosome 33 ... - 86 -
Figure 3.10. LD plots chromosome 1. ... - 87 -
Figure 3.11. Representation of haplotype blocks chromosome 33 ... - 88 -
Figure 3.12. Representation of haplotype blocks chromosome 1 ... - 88 -
Figure 3.13. Eigenstrat population stratification plot of the LD GWAS data ... - 93 -
Figure 3.14. Manhattan plot for LD Golden Retrievers. ... - 94 -
Figure 3.15. Manhattan plot for LD Labrador Retriever. ... - 95 -
Figure 3.16. Manhattan plot for LD meta analysis... - 101 -
Figure 3.17. Manhattan plot of for LD & HD meta analysis………..- 104 -
Figure 4.1. MALDI-TOF spectra showing genotype calls for a bialleleic SNP. ... - 121 -
Figure 4.2. Pathway linking SORCS2, Substance P & neuropeptide receptors. ... - 144 -
Figure 4.3. Sortilin and the neutrophin pathway ... - 145 -
Figure 5.1. SNPs and cases/controls remaining after QA in the CG study. ... - 159 -
Figure 6.1. Example chromatogram showing sequencing of DLA haplotypes. ... - 181 -
Figure 6.2. Pie charts showing the DLA haplotype frequencies... - 185 -
Figure 7.1. Diagrammatic representation of TaqMan probe chemistry ... - 199 -
Figure 7.2 Clustering of the ruptured and healthy samples ... - 205 -
Figure 7.3. Fold change between healthy and ruptured CCL tissue. ... - 206 -
Figure 8.1. Plate setup for biological and technical replicates. ... - 220 -
Figure 8.2. Clustering of the induced and control samples ... - 224 -
Figure 8.3. Fold Change for cells cultured with/without TNFα. ... 226
-List of Appendixes
Appendix 1. Summary of dog data. ... 270Appendix 2. Sample submission form ... 271
Appendix 3. Primer and probe sequences for the replication study ... 276
Appendix 4. Primer and Probe sequences for candidate gene study ... 279
Appendix 5. Normality test results for the QPCR datasets ... 287
-- 8 --
Abstract
This thesis presents work to examine the genetic basis of CCL rupture in dogs. It describes research to identify causative mutations that will help to develop a genetic screening test to identify dogs that have a high risk of developing CCL rupture.
Cranial Cruciate Ligament (CCL) rupture is the most common cause of hind limb lameness in dogs and is especially common in large and giant breeds such as Newfoundlands, Rottweilers and Staffordshire Bull Terriers.
CCL rupture cases and from two continents (Europe n = 48 and North America n = 48) were examined using genome wide association studies (GWAS). A candidate gene study was performed using Sequenom iPlex genotyping, on cases and controls from Newfoundlands (99 cases, 172 controls) and three other susceptible breeds: Labradors (124 cases, 165 controls), Rottweilers (57 cases, 81 controls) and Staffordshire Bull Terriers (13 cases, 38 controls). One hundred and eighty-six SNPs across 26 candidate genes were investigated for association with CCL rupture. To investigate downstream events, gene expression was compared between healthy and CCL rupture tissue. An in-vitro laboratory model of CCL rupture was investigated by examining ligamentocytes induced with and without TNFα. To investigate whether there was an auto-immune component to CCL rupture, the two main loci of the dog leucocyte antigen (DLA) system were assessed for disease association.
Principle component analysis of the GWAS data revealed population stratification within the Newfoundland breed, indicative of the continent of origin (Europe or North America). GWAS identified three main regions associated with CCL rupture (on chromosomes 1, 3 and 33). Significantly associated genes SORCS2 and SEMA5B function in neurological pathways; this may indicate that mechanotransduction, neurological and neuromuscular pathways play an important role in the pathogenesis and susceptibility to CCL rupture. Candidate gene analysis identified associations with two collagen genes (collagen type-V and collagen type-I) and three extracellular matrix proteins; Aggrecan (ACAN), Opticin (OPTC) and Latent transforming growth factor beta 2 (LTBP2). Gene expression analysis revealed significant differential expressions in COL1A1 and COL1A2. These results indicate that the strength and stability of the ligament is probably important in susceptibility to CCL rupture. Gene expression results also revealed that genes involved in degradation (TRAP and DIRC2) are upregulated, indicating that the cells are trying to repair themselves whilst a simultaneous degradative process is still on going. The TNFα model may be used as an in-vitro model to study CCL rupture, but may be more useful as a model for examining changes that occur after CCL rupture rather than the early stages of the disease. We showed no association with the DLA region and CCL rupture.
- 9 -
List of abbreviations
The following lists the commonly used abbreviations in this thesis:
ACL Anterior Cruciate ligament (human analogue of the CCL)
BONF Bonferroni multiple correction
BONF p Bonferroni multiple correction p-value
CCL Cranial Cruciate Ligament
cDNA Complementary DNA
Chr Chromosome
CMH Cochran-Mantel-Haenszel test for association
CT Threshold cycle
DLA Dog Leukocyte Antigen
DMEM Dulbecco's modified Eagle's medium
DNA Deoxyribonucleic acid
ECM Extracellular matrix
EDTA Ethylene-diamine-tetra-acetic acid
EMMAX Efficient Mixed-Model Association eXpedited analysis
EU European
GWAS Genome Wide Association Study
HWE Hardy Weinberg equilibrium
INDEL Insertion or Deletion of a base pair in the DNA sequence
Kb Kilobase
LD Linkage disequilibrium
MAF Minor allele frequency
Mb Megabase
MHC Major Histocompatibility Complex
NA North American
OR Odds ratio
p p-value
PCA Principle component analysis
PCR Polymerase chain reaction
Pos Position
QA Quality Assurance
Q-PCR Quantitative real time PCR
QQ Plot Quantile-Quantile plot
RNA Ribonucleic acid
SAP Shrimp alkaline phosphatase
SEM Standard error of the mean
SNP Single Nucleotide Polymorphism
TNFα Tumour necrosis factor alpha
- 10 -
Chapter 1.
- 11 - Cruciate ligaments – anatomy and function
Cranial cruciate ligament (CCL) rupture is the most common musculoskeletal condition that requires orthopaedic surgery in dogs (Canis familiaris). Complete rupture or partial tearing of the CCL is the most common cause of pelvic limb (hind leg) lameness [1-6].
Figure 1.1. Cranial view of the left stifle joint of the dog. The patella has been removed. Adapted from Textbook of Veterinary Anatomy, 4th Edition [7]
[image:11.595.123.515.245.536.2]- 12 -
ligament most commonly ruptured in both dogs and in humans (along with the medial collateral ligament [10]). The CCL attaches to the fossa on the caudal aspect of the medial side of the lateral femoral condyle [11]. The CCL passes cranially, medially and distally across the intercondylar fossa and attaches to the cranial intercondyloid area of the tibia [11]. The ligament acts to resist hyperextension of the stifle and limits internal rotation of the tibia with respect to the femur [12, 13]. The CCL has two distinct functional bands – the craniomedial and the caudolateral bands [11]. The craniomedial band is taut during flexion and extension of the stifle joint, whereas the caudolateral band is only taut when the stifle is in extension [11]. Both bands are taut during extension of the stifle, so they act to stabilise the joint and prevent over-extension. If the CCL becomes torn, instability results and this can be associated with lameness, chronic pain and stiffness. In dogs, osteoarthritis will develop and is unpreventable [14]. The CCL is analogous to the anterior cruciate ligament (ACL) in humans. They are often inappropriately used interchangeably; in this project CCL refers to the canine cruciate ligament and the ACL refers to the human ligament.
Veterinary diagnosis and treatment of CCL rupture
- 13 -
tissue (such as ligaments). Arthroscopy, ultrasound, magnetic resonance imaging (MRI) or exploratory arthrotomy may also be used to confirm the diagnosis [16, 17].
For treatment, a conservative approach, such as rest and analgesia (e.g. non-steroidal anti-inflammatory drugs) may initially be used, especially if the ligament is only stretched or partially torn, or when the patient is a small breed of dog. However, in most dogs, especially the large or giant breeds, surgical reconstruction options are the recommended approach to management and are the only way to stabilise the ruptured ligament.
- 14 -
registering over 200,000 pure bred dogs a year [24]. Within the UK, if a dog has had surgery to stabilise the stifle, it cannot be shown in championship shows without specific permission from the Kennel Club [24]. Following surgery, the dog may never recover 100% normal function [2, 14, 25] due to the knee failing to gain complete stability. Any underlying causes of CCL rupture or inflammation within the joint or synovium may still have an active effect whilst progressive osteoarthritis occurs simultaneously within the joint [26]. These add to the pain and inflammation in the joint.
Pathology of CCL rupture
Susceptibility
- 15 -
Ligament structure
Ligaments are strong connective tissue structures that connect bone to bone across a joint. Ligaments have a complex hierarchical structure similar to that of tendons [42-44], with many different collagen fibres of different sizes arranged longitudinally along the length [43, 45, 46]. For illustrative purposes the structure of the tendon is shown in Figure 1.2 (adapted from Kastelic et al. [47]).
Figure 1.2. The microscopic structure of a tendon (adapted from Kastelic et al.) [47]. This is shown to illustrate the longitudinal arrangement of collagen fibrils, which is similar to that which occurs in ligaments.
[image:15.595.116.534.268.478.2]- 16 -
fibres, arranged in a longitudinal direction [43, 46]. The cell population is mainly composed of fibroblasts, but chondrocyte-like cells may also be present [48, 49].
Ligaments are two thirds water and the main structural component in the dry weight of a ligament is collagen [37, 50]. Collagens are essential to the integrity, structure and strength of the ligament. Collagen is arranged in fibres made from many fibrils. The conversion of the fibrils to fibres involves the enzyme lysyl-oxidase (LOX) [51] which promotes cross-linking between each fibre. This gives the ligament its core structure and increased strength and stability. The fibrils, instead of being completely straight are crimped and it is thought that the crimp is important in allowing the ligament to absorb a degree of tensile load bearing without the ligament being damaged [43]. The greater the force applied to the ligament, the straighter the collagen fibres become.
- 17 -
47, 54]. As these are all structural components of ligament, important in tensile strength, they can be considered as possible candidate elements for CCL rupture.
Collagen is released from cells as procollagen, which is then cleaved into tropocollagen [55-57]. This tropocollagen is converted to collagen fibrils with the aid of the enzyme lysyl-oxidase (LOX) [58]. LOX acts on lysine and hydroxylysine residues deaminating them to aldehyde groups. This allows covalent bonding to form between the different tropocollagen molecules producing collagen fibrils [51]. This post-translational modification of the procollagen chains is crucial for the formation of mature collagen molecules [59]. Collagens are renowned for their triple helix structure which is formed as a result of a repetitive motif, typically (Gly-X-Y)n where X is normally proline and Y hydroxyproline [52]. This repetitive backbone forms a very stable, tightly coiled alpha helical structure – hence the high tensile strength of collagen fibres under normal conditions.
- 18 -
repair itself (remodelling) after an initial injury or it could be an underlying cause of the injury. The various histological changes over time may reflect weakening of the ligament which then fails when loaded [50, 60, 61]. One of the key problems in investigations into CCL rupture is that it is impossible to stage the injury (start of rupture, partial rupture or complete rupture), so it is difficult to equate the changes seen with certainty, to before, during or after the rupture.
Collagen is not the only component of interest in ligaments – proteoglycans (PGs) and glycosaminoglycans (GAGs) also play an important role in integrity of ligaments [43, 62, 63]. Examples of such PGs include aggrecan, biglycan, decorin, fibromodulin and lumican [64-68]. Cells secrete the PGs directly into the extracellular environment, where they are important in the strength, structure and assembly of the extracellular matrix. Due to the electrostatic attraction between the PGs and water [63], they are important in the osmotic potential of the ligament and the ability to withstand stress and compression. An increase in water content changes the viscoelastic properties of the ligament and may lead to an increase in CCL rupture [46, 50, 69, 70]. PGs are important in collagen formation, assembly and organisation of the fibrils [66, 71, 72]. They are also to be considered ideal candidates to study for association with CCL rupture susceptibility [68, 73].
Bone conformation
- 19 -
demonstrated on the radiograph (Figure 1.3) and is the angle at the top of the tibia bone (between the tibial plateau and the long axis of the tibia). It is thought to be important in CCL rupture as the gradient of the tibia determines the strain placed on the CCL. Static loading models have indicated that the gradient of the tibial plateau correlates with the strain placed on the CCL [79, 80]. However, such models do not involve dynamic stabilisation from major muscle groups acting across the stifle joint, so this remains a controversial area. Some researchers have found a significantly greater TPA in dogs with CCL rupture compared to dogs without CCL ruptures [81], whereas other research shows no statistical evidence for tibial plateau gradients and CCL rupture [82, 83].
[image:19.595.123.271.414.636.2]- 20 -
- 21 -
[image:21.595.113.336.77.489.2]- 22 -
Degeneration of the ligament structure
Although CCL rupture often presents as acute onset lameness, it is generally thought to occur after progressive degeneration and subsequent weakening of the ligament [4]. As such, it is typically a non-contact injury in dogs. This degeneration has been associated with changes in the extracellular matrix (ECM) [4, 50], with a reduction in the structural and functional properties of the CCL. This weakening may then enable the ligament to stretch or partially tear under what might be considered physiological loads, before a complete rupture presents itself [88]. The degeneration and weakening of the ligament may also be explained by higher than normal levels of collagenase being present in transected ligaments compared to normal, healthy ligaments. Amiel et al. [89] documented this finding when examining normal and transected CCLs of rabbits. Degeneration of the ligament may also be consistent with normal age related changes that occur over time. Over time, gradual functional and structural deterioration of the ligament structure occurs, with loss of ligamentocytes, metaplasia of the ligamentocytes to other cells (such as chondrocytes) and loss of collagen fibril organisation and strength [4, 90, 91]. Age related degenerative changes are consistent with reports that CCL rupture has an increased incidence in older dogs [27].
Size and obesity of dogs
- 23 -
weighing >22kg had a higher prevalence of CCL rupture, at a younger age, than smaller dogs under 22kg. Obesity has also been documented to increase the risk of CCL rupture in Cocker Spaniels [94]. This study showed that Cocker Spaniels with CCL had a greater body weight than Cocker Spaniels without CCL rupture. Another experiment in Labrador Retrievers showed that those on a limited food intake regime had a significantly lower incidence and severity of osteoarthritis compared to those dogs with no food restrictions [95].
Hormonal influences
- 24 -
Auto-immune components
Auto-immune reactions have been hypothesised as influencing factors for CCL rupture [3, 31, 105, 106] because synovial inflammation (synovitis) is commonly found in the joint during repair of the ligament. Whether this is a consequence of the CCL rupture or a damage initiating factor is still under debate. However, synovitis has been found to increase the risk of contralateral CCL rupture [31, 107]. In rabbits, persistent synovitis has been found to cause disorganisation of the ligament framework, causing marked changes in the morphological characteristics of the CCL. This resulted in a significant decrease in tensile strength of the ligament [108].
- 25 -
antigens, causing innate and adaptive immune response to local tissues [112, 113]. This process may not act alone in causing CCL rupture, but it may well act as a promoter for further rupture. Persistence of the antigen presence and subsequent immune response, along with the prolonged inflammation, is thought to play an exacerbatory role in CCL rupture and the associated pain and inflammation within the joint.
Whether the inflammatory and auto-immune components cause CCL rupture or if they occur secondary to the rupture of the CCL is still under debate [114-116]. Exposed antigens may also play a role in initiating osteoarthritis (OA), as OA has been proposed to be, at least partially, caused by an auto-immune response with collagen as the direct initiator [112, 117]. It is unclear whether the degradation of the CCL and subsequent release of collagen antigens is a significant cause of the OA or whether the direct and prolonged inflammation within the synovial joint leads to OA [26, 117]. Whichever the case, OA occurs simultaneously with the CCL injury and is unavoidable and untreatable.
Major Histocompatibility Complex and CCL rupture
- 26 -
(RA) [124]. In dogs the MHC region is found on chromosome 12 and the genes are called the “dog leucocyte antigen” (DLA) system.
MHC molecules are transmembrane glycoproteins, which capture and present epitopes of antigens to T-cell receptors and initiate immune response cascades. The MHC region is highly polymorphic, with many alleles existing for each gene. Expression of the genes is codominant, with most individuals being heterozygous. This allows a wide range of antigen presentation to be available and maximises the immune response to foreign antigens. Loss of heterogeneity (diversity of MHC) due to inbreeding can result in an increased susceptibility to autoimmune diseases [125].
Genetics
- 27 -
for the “risk” alleles before breeding. In order to achieve this, it would be necessary to identify a set of susceptibility markers.
It has been widely reported that several dog breeds are more or less susceptible to CCL rupture than others. Breeds such as the Greyhound, Dachshund, Basset Hound and Doberman Pinchers are less likely to rupture their CCL [27, 93] than dogs in the high risk category such as Newfoundlands, Labrador Retrievers, Rottweilers and Saint Bernards [2, 6, 13, 27, 60]. Dogs in the high risk category often rupture their ligament without any apparent traumatic circumstances and as a result, young dogs rupture their CCL suddenly when only performing simple day-to-day activities, such as during play, walking or running [6, 14].
Rupture of one CCL puts a dog at higher risk of rupturing (or otherwise damaging) the contralateral CCL - studies have indicated this to be around 54% risk in Labradors [107]. This value can vary between 22-54% depending on which breed is being studied [33, 107, 127, 128].
- 28 -
development of CCL rupture. Nonetheless, the inherited genetic component, although relatively small is still likely to play an important role in CCL susceptibility. As one cannot tell whether or not a dog will be affected, there is a need to identify the specific genes and/or genomic regions that might be involved in the CCL rupture susceptibility, initiation or progression.
Newfoundland dogs and CCL rupture
Newfoundlands are a large breed of dog commonly used for draught and water rescue work. They are known for their gentle docile nature as well as their strength and endurance [129].
Figure 1.5. Structure and form of a Newfoundland dog1
- 29 -
The origins of the Newfoundland dog as a breed are vague, but the breed is thought to have arisen when a “large Mastiff-type dog” was brought back to England from Canada by European fisherman and explorers. The modern breed as known today, developed from there around the 1800s. Many, if not all American Newfoundlands have an ancestry traceable back to one imported European dog (Siki) around the end of World War 1 and whose son (Ch. Harlingen Neptune of Waseek) started the first large kennel in the United States [130].
Strict breed standards dictate which dogs can be registered within a breed in the dog clubs. In the UK the standard colours for registration are solid black, brown or grey, black with white markings, brown with white markings and Landseer (white with black markings). American standard colours are the same with the solid colour markings, but registration restrictions mean white markings on the coat are only allowed on the chin, chest, toes and tip of tail. In Canada brown and grey colours are not recognised within the breed/kennel clubs and in some European countries such as France and Germany (including the Fédération Cynologique Internationale), the Landseer is considered to be a separate breed, although in the UK and USA/Canada the breed is considered to be the same [129, 131, 132].
- 30 -
prevalence in Newfoundland dogs, a heritability of 27% [6] with a postulated recessive mode of inheritance, strongly indicating that that there is a genetic component to the CCL rupture [6]. Heritability may be under-represented however, because a dog may have the risk alleles and not rupture its CCL; hence it is likely the true value could be much higher. In the past 10 years (from 2002-2011) the mean number of Newfoundlands registered each year with the UK Kennel Club was 976 (range 838 - 1,145). Considering the estimated impact of 22% prevalence of CCL rupture in Newfoundland dogs, this would estimate to be around 215 incidences of CCL rupture a year (excluding any contralateral ligament rupture). Radiograph scoring schemes for hip and elbow dysplasia [139, 140] and DNA screening tests for DCM and SAS [141] are already in place to try and reduce the incidence of these conditions in the breed. It is hoped that a DNA screening test for CCL rupture will be added to the list at some stage in the future, to help further improve the health and welfare of the breed.
Canine genetic studies
- 31 -
genome annotation, although many SNPs and genes investigated had sequences initially chosen from CanFam2.
Pedigree dogs are seen as a suitable species to study as models for many complex human genetic diseases. Studies of many naturally occurring diseases in dogs such as CCL rupture, arthritis, epilepsy, deafness and cataracts have identified similar aetiologies and/or pathogeneses to human versions of these diseases [142-145]. Comparative genetics is much easier to translate between dogs and humans than mice and humans because dogs are genetically more similar to the human than the mouse [146]. Many genes in dogs have orthologues in humans with the same function. Therefore, not only can the research from this study be used for studies of CCL rupture in Newfoundlands and other dog breeds, but it could also have implications in human research. Causal genetic variants for diseases such as Duchenne muscular dystrophy [147], narcolepsy [148] and osteogenesis imperfecta [149] were first identified in the canine version of the disease and then were subsequently systematically applied to these Mendelian disorders in Man.
- 32 -
taken into account. The dog has a highly conserved breed structure and comprehensive pedigree data is readily available from many generations [144]. Pure breed pedigree dogs in particular, show very high linkage disequilibrium (LD) [150]. This means that smaller numbers of a breed can be used in a genetic study to achieve the same statistical power needed for a similar study conducted on human subjects. It also means that fewer genetic variations need be studied within a breed as the SNPs are often in LD with each other.
- 33 - Genetic variations
The release of the human genome in 2001 enabled great advances in investigations into diseases and population genetics [153]. As a result the natural variations in DNA can be assessed and can provide estimation for risk of an individual to specific disease susceptibility or resistance. The most common variations in DNA are called single nucleotide polymorphisms or SNPs [154]. These are variations in the DNA sequence and involve substitution of one of the bases (A, T, C or G) in the DNA sequence with another. Other common DNA variations that have been identified in DNA include; INDELs (Insertion/deletion) [155] where a base or number of bases is/are inserted or deleted in the sequence, microsatellite markers (MSAT) [156] where 2-4 bases are repeated within the DNA sequence and the number of repeats can vary between individuals and copy number variations (CNV) [157] where a section of the DNA is replicated. MSATs have traditionally been used as the molecular markers of choice to determine genetic associations with disease [158]. More recently however, SNP chip arrays have superseded MSAT analysis due to the high frequency of SNPs within the genome [159].
- 34 -
protein generated as a result can have severe consequences in health and disease [161, 162]. SNPs can also be found in parts of the genome that are devoid of protein coding genes, i.e. intergenic regions, where the SNP may be involved in the regulation of gene expression (in promoter or enhancer regions) or non-coding regulatory RNA molecules. Intergenic SNPs that show association with disease may be in LD with SNPs that are up or downstream of an actual gene, or in LD with a SNP that is within a functional gene. The exact function of variants in non-coding regions of the genome still often remains unclear.
- 35 -
protein coding, structure and formation such as non-synonymous (missense) SNPs and frameshift mutations (INDELs) [165].
In order to study genetic variation within a species, it is important to understand how the variations are linked within a species. The developments of genetic maps and advances in analysing linkage disequilibrium (LD) have made this possible. LD is the non-random association of alleles at two loci during recombination [166]. When a particular allele at one locus is found together with a specific allele at a second locus, more often than expected if the loci were segregating independently, then they are said to be in linkage disequilibrium with each other. LD is also a measure of population size and genetic structure [167]. In large, out-bred populations (such as humans), genetic diversity is huge as there have been many recombination events throughout evolution i.e. LD is low. However, large populations themselves do not necessarily correspond with low LD if there are only a small number of founders in the population (i.e isolated populations).
- 36 -
[150]. This is due to the Labradors popularity as a breed (it is the UK’s most popular breed of dog [23]) in comparison to the Akita and Pekinese which are much less popular. There were severe reductions in the Akita breed numbers during World War 2 [150] which significantly reduced the number of founder dogs for the modern breed and consequently reduced LD.
Maintaining genetic diversity is of great importance when considering inherited diseases. Genetic diversity in dogs is reduced due to selection pressures (popular sires and dams), bottlenecks in breed creation and closed breeding populations [169]. This has led to a considerable number of inherited genetic diseases and defects that are overly prevalent in certain breeds. The inbreeding coefficient can be used to determine the level of genetic diversity within a breed [170]. The higher the inbreeding coefficient, the more common ancestors are present in a pedigree. The UK Kennel Club will no longer register mother/son, father/daughter or brother/sister matings, a plan that has been put into place to reduce the level of inbreeding. They have also introduced a MateSelect™ program that allows the breeder to determine the inbreeding coefficient of each mating.
The Kennel Club describes the inbreeding coefficient as:
“The probability that two copies of the same gene have been inherited from a
common founder - that is an ancestor shared by both parents. The lower the inbreeding
coefficient, the lower the probability (risk) that this will happen.” [171]
- 37 -
from a common ancestor that appears in both the sire’s and dam’s pedigree. For a pure-bred dog this is relatively low compared to some breeds such as the King Charles Spaniel which has an inbreeding coefficient of 11.8% and suffers severe hereditary health problems. The other breeds investigated in this project have inbreeding coefficient values of 6.4% (Labrador Retrievers), 6.8% (Rottweilers) and 6.7% (Staffordshire Bull Terriers).
Quantitative trait mapping for complex polygenic disorders (such as CCL rupture) remains difficult relative to monogenic trait/disease mapping [172]. This emphasises the need for accurate and clear phenotyping so that any background “noise” – such as breed, geographical location, coat colour etc. can be reduced. Since the release of the dog genome in 2004, many advances in understanding the genetic basis of canine (and human) diseases have been made in a relatively short time frame. With the release of the newest canine genome assembly (CanFam3 in 2012), in addition to the advent of newer next-generation sequencing platforms, it should become easier to identify causative mutations that are involved in complex diseases. Large regions of association within chromosomes can be narrowed down to specific mutations, which will hopefully then be used to develop screening tests.
Aims of the Project
- 38 -
1. Identify genetic mutations and putative genes which are associated with resistance or susceptibility to CCL rupture in Newfoundland dogs.
2. Determine whether there are any genetic differences between Newfoundland dogs from two different populations (Europe and North America).
3. Determine whether the genetic mutations identified within the Newfoundland breed are specific only to the Newfoundlands or can also be found in other CCL rupture susceptible dog breeds (Labrador Retrievers, Rottweilers and Staffordshire Bull Terriers).
4. To determine the expression levels of select candidate genes between ruptured and healthy CCL tissue.
5. To determine if there is an autoimmune component to CCL rupture by studying the DLA region for association.
6. To determine if TNFα stimulation of ligamentocytes in vitro can be used as a laboratory model of the pathological changes seen in CCL rupture.
- 39 -
Chapter 2.
General Materials
- 40 -
The laboratory techniques presented in this chapter are generic to all subsequent experiments described herein. Deviations from the general protocol for individual experiments are detailed in the relevant chapters of the thesis.
Clinical diagnosis and phenotypic status
The phenotypic description of the dogs was determined according to the inclusion/exclusion criteria of the study.
Inclusion criteria (cases): Dogs with CCL rupture of any age. CCL rupture must have been confirmed during surgery.
Exclusion criteria (controls): Healthy control dogs, with no symptoms of CCL damage, were over five years of age and showed no obvious signs of CCL rupture (hind limb lameness or pain).
- 41 - Dogs included in the study
Samples from Newfoundland dogs that had ruptured their CCL (cases) and those that had no clinical evidence of CCL rupture (controls) had DNA extracted from either EDTA blood (excess from other veterinary tests already being carried out), or salivary swabs – see Sample collection method, page 44, for more detail.
The majority of the Newfoundland CCL rupture cases and controls were collected by attending dog shows, mailing sample collection kits to the owners and breeders or by obtaining samples sent from veterinary surgeons. The remaining CCL rupture cases and controls, as well as the cases/controls for other breeds used in the study (see below) were taken from the UK DNA archive for companion animals (http://www.liv.ac.uk/dna_archive_for_companion_animals/) and had already been collected for previous research studies [173]. Full informed, written owner consent had been given to use these samples in research studies.
- 42 -
the majority of samples from these breeds were obtained from those already integrated into archive databases – which were limited in number.
The CCL rupture case samples for the other breeds were taken from the UK DNA archive for companion animals at Liverpool. The phenotype of the dog (breed, age, sex, CCL rupture) was known. The control samples for the Labrador Retrievers, Rottweilers, Staffordshire Bull Terriers and some Newfoundland samples were taken from the Veterinary Laboratory agency (VLA) archive (a subset of samples within the UK DNA archive for companion animals). The VLA samples represented a random population of UK dogs with no disease information and were therefore assumed to be controls with no cruciate ligament rupture – this is a recognised limitation in the project as no clear diagnostic information is available.
Specific information on breed, sex, age and numbers of cases and controls used are given in the Appendix (Appendix 1).
- 43 -
available. The owner also consented to allow the sample to be stored and integrated in the UK DNA archive for companion animals and used as appropriate in this study and other scientific research.
Samples were initially collected from dogs within the UK only, but sample submission rate was very low, despite multiple approaches and addresses to UK Newfoundland breeders and owners at their club meetings and dog shows for samples. On the basis that at the current rate of sample collection, progress would not be enough to enable the project to proceed within a suitable timeframe, the sample collection area was extended to include North America and mainland Europe.
- 44 -
Newfoundlands, 124 cases and 165 controls for the Labrador Retrievers, 57 cases and 81 controls for the Rottweilers with the Staffordshire Bull Terriers falling short at 13 cases and 38 controls. As the dogs are pure-breeds the relationship status between each dog is such that the linkage is high enough to detect mutations in a much smaller number of dogs than would be required if the study was being conducted on a human population.
Sample Collection for DNA extraction
In order to perform the experiments in this project it was necessary to collect biological samples to obtain DNA from dogs with and without CCL rupture. Blood or saliva samples were collected from Newfoundlands and other selected dog breeds (Labrador Retrievers, Rottweilers and Staffordshire Bull Terriers) and were integrated within the UK DNA archive for companion animals at Liverpool (www.liv.ac.uk/dna_archive_for_companion_animals). The research in this project was approved by the University's Research Ethics Sub-Committee.
- 45 -
Sample submission was either an EDTA tube of blood (residual blood remaining from routine veterinary diagnostic tests carried out on the dog), or, if blood was not available then salivary swabs were taken using the Oragene™ saliva collection kits (Oragene™, DNA Genotek, Ontario, Canada). Samples were only included in the project if the owners gave their full written consent to the blood/samples being stored and used in scientific research.
- 46 - DNA extraction
Blood
DNA was extracted and prepared from EDTA blood using the Qiagen DNA Blood midi kit (Crawley, UK) following the manufacturer’s instructions and as previously described [178]. The DNA was then quantified using a nanodrop spectrophotometer (Thermo scientific, Massachusetts, USA, www.nanodrop.com).
Saliva
- 47 -
transferred into a pre-labelled tube and was quantified using a nanodrop spectrophotometer (Thermo scientific, Massachusetts, USA, www.nanodrop.com).
Salivary DNA extraction often generates lower quality DNA than that of blood, due to potential carryover from contaminants like residual food, hair, ingested dirt etc. within the sample. Furthermore, the collection of samples from salivary collection kits may introduce additional variation as they are collected in an uncontrolled manner by the owners. Owners may not have followed the instructions adequately, for example the owner may have sampled the dog immediately after food or drink or dropped the swab on floor. Variation in the amount of saliva collected on the swabs may also have affected the amount of DNA available. Some dogs may have been sampled with a dry mouth resulting in fewer cells from which DNA can be extracted resulting in a lower yield of DNA. Pooling a large quantity of saliva into the collection kit (for example collecting “drool”) effectively overloads the extraction process and can also reduce the yield of the DNA. The quality and quantity of DNA from salivary swabs, although lower than whole blood extracted DNA, is adequate for downstream applications such as genetic studies [180, 181].
Clean-up of DNA
- 48 -
ultraviolet (UV) light at 260nm, protein and phenol absorb UV at 280nm and carbohydrates at 230nm. Any substantial decrease in the values will indicate contamination with protein/phenol/carbohydrate. In some instances it was necessary to “clean up” the DNA to remove contaminants, as there were notably lower 260:280 and 260:230 ratios and a greatly increased peak at 230nm caused by organic carryover from the extraction process. Several methods were evaluated before deciding which method was the best to use on the samples in question.
Ethanol purification of DNA
Briefly, 1/10th volume of 3M sodium acetate and 2½ times volume of 100% ethanol were added to the “dirty” DNA. Samples were vortexed and cooled on ice for 15 minutes before centrifugation at 10000g for 15 minutes. The supernatant was removed and 500µl of 70% ethanol was added to wash the pellet. The pellet was air dried for 15 minutes and then resuspended in 300µl buffer TE. DNA concentration and purity were quantified using a nanodrop spectrophotometer.
Chloroform Clean-up of DNA
- 49 -
Qiagen Column clean-up of DNA
Ethanol (200µl of 100%) was added to 200µl of DNA and vortexed briefly. The sample was transferred into a Qiagen spin column (Qiagen, Crawley, UK) and centrifuged at 6000g for 1 minute. The filtrate was discarded and 50µl of buffer AW1 (Qiagen, Crawley, UK) was added and the sample centrifuged again at 6000g for 1 minute. The filtrate was discarded and 500µl of buffer AW2 (Qiagen, Crawley, UK) was added and the sample centrifuged at 20000g for 3 minutes. The filtrate was discarded and the samples centrifuged again at 20000g for 1 minute. The spin column was transferred to a new collection tube, 200µl of buffer AE (Qiagen,
Crawley, UK) was added and the sample kept at room temperature for 1 minute before centrifuging at 6000g for 1 minute. The eluate was added back to the column and re-centrifuged at 6000g for 1 minute. The DNA was then transferred into a pre-labelled tube and was quantified using a nanodrop spectrophotometer.
- 50 -
for DNA prepared from blood. The chloroform clean-up method was used to “clean-up” the contaminated DNA in this project.
Quantification, normalisation and storage of DNA
DNA was quantified using a nanodrop spectrophotometer (Thermo Scientific, Massachusetts, US) and was normalised (standardised) using molecular grade water either by hand or by using the Hamilton Microlab® Star robot (Bonaduz, Switzerland). Samples were normalised to 100ng/μl for Illumina HD genotyping and 20ng/μl for Sequenom genotyping. DNA was stored at -20˚C or-80˚C until it was required in experiments. All DNA for long term storage was integrated in the UK DNA Archive for Companion Animals at -80˚C. An XL20 robot (BioMarkerLab, California, US) was used to cherry pick samples that were already in the archive that were required for the study using the unique 2D barcodes allocated to each sample tube.
Tissue collection and culture of ligament cells
- 51 -
degenerative joint disease and which had been donated to the University for teaching.
CCL tissue was harvested from the stifle of the cadavers by sharp dissection, using an aseptic technique. Additionally, separate scalpels were used for incision of skin and the remaining dissection and the scalpel was rinsed in 100% ethanol between the cut into joint capsule and the extraction of the CCL.
Ligamentocyte cell identification
The primary cell type within the CCL is the ligament fibrocyte, otherwise known as a ligamentocyte [46, 183, 184]. These ligamentocytes are responsible for the creation and the maintenance of the extracellular matrix (ECM). The predominant ECM protein in the CCL is collagen type I, which is essential for the integrity and support of the ligament structure. The cells show typical fibroblast-like morphology.
Monolayer cultures
- 52 -
digestion, the released cells were recovered by sieving through a 40µm sieve to remove debris. Cells were pelleted by centrifugation at 1000g for 10 minutes and the pellet washed by resuspension of cell pellet in 5ml media (DMEM/F12 glutamax). The cells were centrifuged at 1000g for a further 10 minutes to wash cells and remove all traces of collagenase.
The cell pellet was resuspended in 1ml of tissue culture medium (DMEM/F12 glutamax, 10% FBS, 1% penicillin, 1% streptomycin, 1% amphotericin) and the cells counted before seeding plates/flasks at appropriate density to allow cell proliferation and establishment of monolayer cultures. When cells reached 80% confluence, usually after 4-5 days at 37˚C, they were released with Trypsin/EDTA (1x). The media was replenished every 3 days. For subsequent experiments the cells were plated into six-well plates in triplicate and when confluent were either induced with TNFα (see Chapter 8) in media for 24 hours, or left in normal media as a control.
After all experiments the cells were either cryopreserved for long term storage or lysed with Trizol for the first stage of RNA extraction.
Lysis of monolayer cells using Trizol
- 53 -
(250µl for 24 well plate, 500µl for 12 well plate and 1ml for 6 well plate, 2.5ml for T25 flask). The cells were lysed by pipetting up and down several times and then left for 5 minutes at room temperature. The lysed cells were then transferred to RNAase-free eppendorf tubes and stored at -80˚C until RNA was extracted.
Cryopreservation and resuscitation of cryopreserved cells
Cryopreservation was used for long term storage of cells [185]. After trypsinisation the ligamentocytes were pelleted by centrifugation at 1000g for 5 minutes. 1x10⁶ cells were placed in each cryotube. The majority of media was removed leaving the cell pellet in approximately 300µl of media to which 1ml of cryofluid (92% FBS, 8% DMSO) was added. The cell pellet was resuspended. The cells were transferred to a cryotube which was subsequently wrapped in cotton wool and placed in a padded envelope at -80˚C overnight before being transferred to liquid nitrogen for long term storage [method from Professor SD Carter: personal communication].
- 54 - RNA extraction
Samples were lysed using Trizol (Invitrogen, California, US). For tissue samples, the tissue was wrapped in foil and placed into liquid nitrogen to deep freeze the samples. The tissue was then homogenised using a dismembrator (Mikro-Dismembrator, Sartorius Stedim Biotech, France) and the powder was placed in Trizol (1ml of Trizol for 100mg tissue). For monolayer cells, the cells were lysed directly on the plate by adding 1ml of Trizol per 10cm3 as detailed above.
RNA was extracted using PureLink RNA mini kits (Ambion, UK) using the normal phase separation, binding, washing and elution stages as detailed in the manufacturer’s protocol [186]. An added step of on-column DNase treatment (PureLink DNAase kit, Ambion, UK) [187] was carried out on the sample to remove genomic DNA contamination. RNA was eluted with 100µl RNAase free water.
Assessment of quality and quantity of RNA
- 55 -
the RNA was assessed using the RNA Integrity number (RIN) value [189]. The RIN is calculated from the electrophoretic trace and is a measure of the integrity of the RNA, it ranges from 10 (intact RNA) to 1 (completely degraded RNA). The bioanalyser also gives the quantity of RNA present in the sample, as well as the 28s:18s ratio, which for pure RNA has a 2:1 ratio.
For this project, samples that had a 28s:18s ratio of ≥1.6 and a RIN value of ≥8 were selected. If necessary, the RNA was normalised to 0.1μg/μl using RNAase free molecular grade water before conversion to cDNA.
cDNA synthesis
cDNA is more stable than single stranded RNA, therefore the mRNA samples were transcribed immediately into cDNA to avoid any degradation and deterioration of the sample. There are three commonly used methods of producing cDNA from single stranded RNA, oligo dT’s, specific primers or random hexamers, as shown in Figure 2.1.
- 56 -
Figure 2.1. The three methods commonly used to reverse transcribe RNA into cDNA – Baird 2013.
OligoDt was chosen in this project as it only hybridises to polyadenylated mRNA at the 3’ end polyA tail and therefore minimises genomic DNA contamination. This method is highly specific in only transcribing polyA mRNA, but it can be limited in the fact that transcription may only proceed as far as 1.5KB, such that very long mRNA may not be transcribed completely to the 5’ end. Any primers designed for the cDNA should be designed as close to the 3’ end of the RNA as possible to ensure efficient conversion.
[image:56.595.130.491.80.329.2]- 57 -
Invitrogen, California, US) and 1µl of 10nM dNTP mix (Invitrogen, California, US). The RNA was heated at 65˚C for 5 minutes, before being quickly chilled on ice. The tube was centrifuged to sediment the contents before 4µl of 5x first strand buffer (Invitrogen, California, US), 2µl of 0.1M DTT (Invitrogen, California, US) and 1µl of RNAsin (40U/μl, Promega, Wisconsin, US) was added. The tube was gently mixed and then heated at 42˚C for 2 minutes. Superscript II reverse transcriptase (1µl, 200U/μl, Invitrogen, California, US) was added and the sample heated at 42˚C for 50 minutes, before the reaction was inactivated by heating at 70˚C for 15 minutes. The cDNA was stored at -20˚C until use in the Q-PCR gene expression studies.
General analysis and statistical methods
All genotyping data were analysed using freely available software PLINK [190, 191] implemented using the program BCgene (BC Platforms, Finland).
Quality assurance (QA) was carried out on the genotyping data to ensure only the top quality data was used for analysis. Cut off values were assigned for each of the following values and are specified in each individual chapter:
Minor allele frequency - frequency of less common allele in a population
(denoted in PLINK by --maf)
Exact Hardy-Weinberg equilibrium in controls (denoted in PLINK by --hwe)
- 58 -
Case control associations were performed on the genotype data using a standard case control allelic association unless otherwise detailed [192, 193]. This is a basic chi-squared test of association (using a 2x2 contingency table with 1 degree of freedom) of the allele counts between cases and controls, regardless of the genotype combination from which they arise. This assumes a multiplicative model of inheritance, so that the risk of the disease increases by factor r for each allele carried. For example with genotypes AA, AT and TT, the risk increases by r for each T allele carried – AA = 1, AT = r, TT = r2[192, 194].
A Cochran-Mantel-Haenszel (CMH) test (2x2xK) was performed on the genotype data when a stratified analysis was needed [195, 196]. This is a cluster based analysis that generates an average odds ratio that controls for confounding factors between clusters. This is referred to as a stratified analysis.
- 59 -
Haploview case control analysis was performed to determine haplotype associations within the genotype datasets [198]. This was implemented using PLINK and Haploview. The standard Gabriel method was used to define haplotype blocks [199].
Significance of the data was determined by p-values, a raw p-value of ≤0.05 or a corrected p-value (see below) was used to infer significance in the data unless otherwise stated.
- 60 -
expected percentage of false positives among all the claimed positive associations. The three methods will all be used in this thesis and the results compared.
Hardy-Weinberg equilibrium (HWE) states that in an outbred, randomly mating population the allele frequencies will remain constant from one generation to another [203, 204]. It is represented by the equation: where p
and q are the frequencies of alleles for a locus in the population, p2 and q2
represent the proportions of each homozygote and 2pq represents the proportion of heterozygotes. In an inbred population (such as pure-breed dogs) the populations are non-randomly mated and therefore the allele frequencies will not conform to the HWE. The observed allele frequencies are compared to the expected allele frequencies using an exact test designed by Wiggington et al. 2005 [205] in PLINK, to produce a p-value which denotes the deviation of the SNPs from HWE.
The odds ratio (OR) is used to provide an estimation of relative risk of an allele in the population [206]. It is a measure of magnitude of association between the cases and controls and can be calculated by dividing the odds of the allele in the cases by the odds of the allele in the control population:
OR = ( )
( )
- 61 -
- 62 -
Chapter 3.
Genome Wide
Association
- 63 - Introduction
High density whole genome scanning provides an unbiased approach for scanning the entire genome to identify novel candidate genomic regions of disease association. Previously, candidate genes were selected based on their perceived involvement in the disease or disease process. Many genes were not screened for disease association because their function was unknown or was not thought to be relevant to disease susceptibility, onset or progression [207]. Consequently many associations may have been missed for not being in obviously “associated” genes.
- 64 -
High density SNP arrays have been successfully used to determine genetic involvement in canine disorders including atopic dermatitis, epilepsy and pituitary dwarfism as well as non-disease traits such as coat colour [174, 177, 209, 210]. These arrays are available for genome wide analyses of many veterinary species including the dog and are commercially available from Illumina (www.illumina.com) and Affymetrix (www.affymetrix.com). As these arrays offer so much in terms of screening the genome for regions of disease association and generate high quality data unobtainable by other means, a genome wide approach was used to examine the canine genome for SNP associations with CCL rupture in Newfoundland dogs.
- 65 -
interesting to examine the associations in other breeds and to determine whether the same associations for CCL rupture are fixed in the different breeds – this is beyond the scope of the current project.
This is the first GWA study that has been conducted on CCL rupture using the high density CanineHD array. It is hoped that this study will allow novel mutations that have not previously been associated with CCL rupture to be determined in a cohort of Newfoundland dogs.
Methods
Sample collection and preparation
Samples collection was either via salivary swabs (Oragene™, DNA genotek, Ontario) or from residual blood excess from veterinary investigations already being carried out (for more details see the main methods Chapter 2). The DNA was extracted as described in the main methods (Chapter 2) and then normalised to 100ng/µl using a Nanodrop spectrophotometer.
- 66 -
Illumina genotyping
The genome wide SNP genotyping of Newfoundland dog DNA samples was performed using the Illumina CanineHD chip (San Diego, California, US), with the hybridisation being performed at the Roslin Institute in Edinburgh. The SNPs on the chip were selected from the CanFam2 assembly of the dog genome. The new SNP chip (CanineHD) contains many more SNPs than the original Canine SNP chip array from Illumina (CanineSNP20), which contained 22,362 validated SNP probes; it also has greater coverage across the whole genome. The CanineHD SNP chip contains 173,662 markers evenly spaced across the genome with an average coverage of greater than 70 markers per megabase (Mb). This allows an unbiased approach to screening the whole of the canine genome for differences associated with normal or disease phenotypes.
- 67 -
The GWAS data were analysed using a freely available whole genome association analysis toolset PLINK [190, 191] implemented using the program BCGene (BC Platforms, Finland). Graphical representation of the data was performed using the GenABEL and ggplot packages in R [213].
Quality Assurance
Raw genotypes from the Illumina final report file were directly uploaded to the BCgene program. The GWAS data were then assessed and filtered for quality assurance (QA) before association testing. Samples and SNPs were excluded if the sample call rate was <85%, the genotype call rate <90%, the control population was not in Hardy-Weinberg equilibrium (p<0.05) and/or the minor allele frequency ≤0.05. Following QA, 81 samples remained. The data were then assessed for population stratification and any outliers deviating from the main cluster(s) were removed from subsequent analyses – five samples were classed as outliers and removed, leaving 76 samples for further analysis.
Assessing population structure