MEDIUM-TERM
REVIEW
2008-2015
JOHN FITZ GERALD
ADELE BERGIN
THOMAS CONEFREY
SEÁN DIFFNEY
DAVID DUFFY
IDE KEARNEY
SEÁN LYONS
LAURA MALAGUZZI VALERI
KAREN MAYOR
RICHARD TOL
MAY 2008 NUMBER 11
Copies of this paper may be obtained from The Economic and Social Research Institute (Limited Company No. 18269).
Registered Office: Whitaker Square, Sir John Rogerson’s Quay, Dublin 2. www.esri.ie
Authors
MEDIUM-TERM
REVIEW
2008-2015
JOHN FITZ GERALD
ADELE BERGIN
THOMAS CONEFREY
SEÁN DIFFNEY
DAVID DUFFY
IDE KEARNEY
SEÁN LYONS
LAURA MALAGUZZI VALERI
KAREN MAYOR
RICHARD TOL
MAY 2008 NUMBER 11
© THE ECONOMIC AND SOCIAL RESEARCH INSTITUTE DUBLIN, 2008
ISBN 0 7070 0265 6
W
ork on this year’s Medium-Term Review has been a lengthy process, which involved many experts both from within and outside of The Economic and Social Research Institute (ESRI). In preparing the Review for publication the authors have drawn heavily on the expertise of the Director and staff of the ESRI.The authors, and their research, have benefited hugely from the invaluable assistance of the Central Statistics Office (CSO). The CSO has been a key partner in this long-standing research programme. Over successive Reviews the range and quality of the data for economic modelling available from the CSO has dramatically improved. With such a wide range of information now available, the advice and timely assistance of the experts in the CSO is more than ever important in making good use of this very fine resource. This advice and assistance was very freely given in preparing this Review.
Over the last six months, the authors have been in contact with several leading institutions and experts from various fields of the economy. Such meetings, as always, proved to be more than useful. In particular we would like to thank the Department of Finance, the Department of the Environment & Local Government, the Department of Communications, Energy & Natural Resources, the Department of Transport, the Environmental Protection Agency (EPA), Teagasc, Forfás, the ESB, BGE, EirGrid, ICTU and IBEC, John McCartney, Austin Hughes, Marian Finnegan, John Beggs, Brian O’Gallachóir and the other individuals who offered us useful advice.
The research on the environment was undertaken as part of a programme of work funded by the EPA. The research on energy was undertaken as part of a programme of work funded by the Department of Communications, Energy & Natural Resources, the ESB, BGE, EirGrid, the CER, SEI, and Viridian.
Once again the National Institute of Economic and Social Research, London, proved to be invaluable in offering advice and in allowing us access to their global econometric model, NiGEM which enabled us to formulate the External Environment section of this year’s Review, as well as allowing us to carry out various shocks in the model.
The work on the housing sector benefited from research in the ESRI by Bettina Drepper. The last word of thanks goes to Regina Moore, Mary Cleary and Deirdre Whitaker all of the ESRI, because without their professionalism, expertise and attention to detail, publication would simply not have been possible.
CONTENTS
Page
ACKNOWLEDGEMENTS IV
EXECUTIVE SUMMARY VII
Chapter
1 INTRODUCTION 1
2 THE BEHAVIOUR OF THE IRISH ECONOMY 6
3 BACKGROUND ECONOMIC ENVIRONMENT AND ASSUMPTIONS 40
4 THE BENCHMARK FORECAST 56
5 ENERGY, ENVIRONMENT AND TRANSPORT 99
6 ALTERNATIVE SCENARIOS 127
7 CONCLUSIONS 139
REFERENCES 151
Appendices
1 FORECASTING RECORD OF THE MEDIUM-TERM REVIEW 157
2 MODELLING THE IRISH ECONOMY 165
E
XECUTIVE
S
UMMARY
D
espite the very real difficulties that are currently being encountered, the essential message of this Review is that the economy will eventually rebound, and return to its medium-term growth path. The analysis in the Review suggests that the Irish economy is resilient in the face of adverse circumstances. When we wrote the last Medium-Term Review in December 2005 we were more concerned that a misplaced sense of economic invincibility had taken hold in Ireland and we sought to draw attention to the very real dangers facing the economy at that time. Unfortunately, some of these problems have now come to pass (along with some we did not envisage). However, if properly managed the slowdown that is occurring in the economy today should pass and the economy should recover fully in the early years of the next decade.Introduction
While our understanding of the key factors driving the economy has evolved over recent years, our view of its likely medium-term growth rate has not. The forecast for the growth in GNP over the period 2007-2015 is identical to what it was when we published the last Review in December 2005, an average of around 3¾ a year.1 This expectation is based on a
detailed examination of the potential growth in productivity and the likely development in the labour force. Our analysis suggests that, even if the current downturn were to be more severe than anticipated, the economy would eventually recover more vigorously to realise the medium-term growth rate. This resilience is crucially dependent on the assumption that appropriate policies are pursued.
GNP is a crude measure of well-being and a number of other factors will be important if the standard of living, broadly defined, is to continue rising. Important among these issues are the delivery of a public and a private infrastructure suitable for a rich economy in the 21st century, the
provision of high-quality public services and the protection of the environment. An innovation in this Review is the inclusion of detailed environmental forecasts that contribute to our understanding of the sustainability of development in Ireland.
T
he Irish economy has entered into a new phase of development and structural change is affecting how it behaves in response to developments in the world economy (Chapter 2). Business and financial services are in the process of “taking over the baton” from the manufacturing sector as the key channel through which growth in world trade is transmitted to the Irish economy. While this analysis indicates that the manufacturing sector stillThe
Behaviour of
the Economy
1 The housing shock in the 2005 Review, which included a US slowdown,is compared to
the Benchmark forecast in this publication.
VIII MEDIUM-TERM REVIEW 2008-2015
remains very important to the economy, net expansion of employment in the sector will only occur in the high tech industries where the technology involves skilled workers in the production process. Ireland’s recent performance shows that its comparative advantage on world markets is shifting towards the production and export of business and financial services.2 Major employment growth in the future is expected to occur in
this sector, which is among the most human capital intensive in the economy.
There are other changes under way in the labour market where the characteristics of migration have changed. Whereas in the past there was emigration, with a large potential supply of mobile Irish labour that moved backwards and forwards from the UK, the rest of the EU or even the US, today there is net immigration, with the bulk of the mobile workers being foreigners. In addition, the rapid growth of the economy in recent years means that public infrastructure and housing are in short supply, raising the cost of living in Ireland. These changes make the supply of labour less sensitive to wage rates affecting the labour market in two important ways:
1. Unlike the 1980s and early 1990s when there was spare capacity, in the future, if the economy is growing rapidly, any domestic stimulus to the economy from fiscal policy would tend to raise domestic wages and prices, tending to crowd out the domestic tradable sector.
2. In the past, most of the incidence of reductions in labour taxes ultimately accrued to employers, leading them to increase output and employment. By contrast, today a significant part of any cut in labour taxation would accrue to employees, so that the positive impact on competitiveness and employment would be more limited than in the past. We, nonetheless find that a shift from labour to environmental taxation has a positive effect on growth and employment.
T
he global forecast underlying this Review anticipates that the problems in the US economy, which began in the housing sector and now encompass the financial sector, will result in a major slowdown in that economy this year. However, it is anticipated that a recovery will begin next year, returning the US to its trend growth path by 2010 or 2011. For the Euro Area the slowdown is expected to be milder this year and, consequently, the recovery in 2009 and 2010 will be less pronounced. This external environment is particularly unfavourable for Ireland due to exchange rate changes, which reduce Irish competitiveness on world markets.Background
Assumptions
The structure of the population remains very favourable for the next twenty years, with Ireland’s dependency rate being considerably lower than that of our EU neighbours. There will be a very substantial increase in the supply of skilled labour out to 2020. While the growth in aggregate labour supply from domestic sources (natural increase and increased female labour force participation) is slowing, there will continue to be significant net
2 The business and financial sector includes banking and insurance, real estate, IT services,
immigration. However, this forecast anticipates that the inflow will be much smaller than in the current decade.
A broadly neutral fiscal policy is assumed over the forecast horizon with the share of current expenditure and taxation in GNP remaining relatively unchanged out to 2015. It is assumed that the National Development Plan will be implemented as planned and that, after the current Plan is completed, further major investment will be needed out to around 2020. Thereafter, with the necessary infrastructure in place, government capital expenditure should fall to levels more normal in a developed EU economy. As a result, the state’s debt, net of financial assets, will disappear after 2020.
In line with the increased priority being attached to environmental policy, we assume that a carbon tax will be introduced in 2010 at the market price of carbon. It is assumed that the resulting revenue will be used to keep labour taxes lower than they would otherwise be.
S
ummary details of the Benchmark forecast are shown in Table 1 for five-year periods out to 2020.3 This Table shows a gradual slowdown in theaverage rate of growth of GNP from 2000 through to 2020. However, the rate of increase in income per head (GNP per head) is expected to remain broadly unchanged. The growth in labour productivity, measured by GNP per worker, was particularly low in the first half of this decade due to the
Forecast
Table 1: Forecast Summary, Benchmark
1995-2000 2000-2005 2005-2010 2010-2015 2015-2020
Average Annual Growth, %
GNP 8.6 4.4 4.1 3.8 3.5
GNP per head 7.5 2.6 2.4 2.6 2.4
GNP per worker 3.5 1.2 2.0 2.5 2.4
Non-Agricultural Wage Rates 5.9 6.0 4.2 4.3 4.8
Consumption Deflator 3.4 3.3 2.4 2.8 3.2
Employment, April 5.0 3.2 2.0 1.2 1.1
Labour Force, April 3.4 3.0 2.6 0.9 0.9
Energy use 6.2 3.2 1.9 1.6 1.7
Greenhouse gas emissions 3.1 0.4 0.0 0.1 1.0
For end Year: 2000 2005 2010 2015 2020
Net Immigration, thousands 26 55 10 15 15
Unemployment rate, ILO Basis % 4.3 4.2 6.6 5.3 4.4
Balance of Payments, % of GNP -0.3 -4.2 -5.6 -0.6 3.0
General Government Balance, % of GNP 5.1 1.2 -1.4 1.2 3.8
Debt/GNP Ratio4 34.0 25.5 21.0 21.1 5.8
Housing Completions, thousands 49.8 81.0 46.8 48.6 47.1
3 Detailed year-by-year numbers are set out in Appendix 3.
X MEDIUM-TERM REVIEW 2008-2015
exceptional level of investment in housing, which had low or negative productivity growth. With building having a much smaller weight in future, the rate of productivity growth is expected to average around 2½ per cent a year in the next decade.
The increase in wage rates, while slower than in the boom years, will continue at a significant pace reflecting above average productivity growth in Ireland relative to the EU. The rate of inflation in consumer prices, measured by the consumption deflator, will remain low.
The unemployment rate is rising quite rapidly at the moment and we expect that the future return to full employment will lag the economic recovery. As a result of the higher unemployment and increased competition within the EU for immigrants from the New Member States, net immigration will continue at a very much reduced rate than in the recent past.
Population growth and the relatively small number of dwellings per adult in Ireland (relative to the EU-15) mean that there will be a continued need for more dwellings out to 2020. This demographic pressure will place a floor on the housing market in the medium term.
O
ver the last fifteen years the pressures on the environment have risen much more slowly than the rate of economic growth – there has been a substantial decoupling between economic growth and environmental pressures. This has occurred partly because of technological progress and the modernisation of the power generation sector, but mostly because growth was concentrated in the environment-friendly services sectors. Based on the forecast for the economy, the new ESRI environment model, ISus, shows a further decoupling between economic growth, energy use, emissions to air, and waste. In some cases – sulphur dioxide, ammonia, hazardous and other waste, and carbon dioxide from electricity – there is even a reduction in environmental pressure. However, these trends are not sufficient to meet the stated targets of environmental policy.The
Environment
In the areas of waste and climate change – perhaps the most significant environmental challenges for Ireland – the trends are in the opposite direction of the declared policy targets, even though the Benchmark scenario assumes an acceleration of policy implementation.
The projected price level in the EU Emissions Trading System is likely to drive change in electricity generation, resulting in a fall in carbon dioxide emissions from power generation by 2020. Ireland will also easily meet the EU renewables target in power generation. However, the assumed carbon tax would not be high enough to induce a major reduction in emissions elsewhere before 2020.
In sum, although we expect that the rate of progress in environmental protection will accelerate, there will remain a substantial gap between the ambitions of policy makers and reality – particularly for climate change and waste – unless new policy initiatives are put in place.
B
ecause of the uncertainty that surrounds all forecasting exercises, this Review examines three scenarios. The first two scenarios focus on how competitiveness on world markets affects the Irish economy. They provide possible upper and lower bounds for our medium-term forecasts. The high growth scenario examines what the economy would look like if growth were an average of 0.7 per cent a year above the Benchmark forecast because of enhanced competitiveness. The “wasted opportunity” scenario considers the possibility that a serious loss of competitiveness could see the economy under-perform by an average of 0.7 per cent a year. The results suggest that there are significant downside risks over the medium term if policy does not promote competitiveness, broadly defined.Alternative
Scenarios
A third scenario looks at the possibility that the current slowdown in the world economy could be sharper and deeper than in the Benchmark. This scenario suggests that a severe liquidity crisis in the US could lead to a more serious recession there, with serious short-term consequences for Ireland. In such an event the Irish government deficit could mushroom, posing serious problems for policymakers. However, what this scenario also shows is that, if the problems in Ireland were appropriately managed, the US recession would not do long-term damage to the Irish economy. In the medium term, when the global economy recovered, the rate of growth in Ireland would accelerate to return the economy to its medium-term growth path.
T
he changing behaviour of the economy holds significant implications for fiscal policy. While not immediately relevant, because of the current economic downturn, in the future it will be important to tighten fiscal policy when the economy is growing rapidly, resulting in substantial surpluses in the “good times” (i.e., adopt a counter-cyclical policy). This will leave scope to loosen fiscal policy in the “tough times”. If such a policy had been adopted consistently since the end of the 1990s there would have been more scope today to insulate the economy from the current downturn. Fiscal policy has a greater impact now than in the past and, with EMU membership, it is the only effective tool open to the government to manage the housing market.Medium-Term
Challenges
While governments can smooth the cycle through appropriate use of fiscal policy, this policy is not the appropriate instrument to influence productivity growth and living standards in the long term. Instead, structural policy, including investment in public infrastructure, is the appropriate policy instrument that governments can use for such longer-term goals. Efficient delivery of the National Development Plan and of other public services will be very important for future growth in living standards.
XII MEDIUM-TERM REVIEW 2008-2015
human capital. We have extensive experience in facilitating new manufacturing firms to set up in Ireland. However, in the future most of the additional jobs will be in the business and financial sector. The supply of labour with appropriate skills for the services sector will be important for future growth. This will involve not only ensuring an adequate output of graduates but it will also be necessary to ensure that Ireland is an attractive location for the skilled workers in the sector, be they Irish or foreign. Thus ensuring a good urban infrastructure, high quality health care and education and a clean environment may be of substantial indirect benefit to the sector through its potential effects on labour supply.
Research on investment priorities suggests that the implementation of policies to ensure efficient use of the infrastructure is at least as important as the physical investment itself. Enhanced competition in the production of public services together with improved regulation where competition is not feasible and where network benefits need to be exploited (e.g. public transport) will be important In particular, there is a need for policy on physical planning to focus on developing sustainable urban centres that are good to live in. This not only involves investment but it also requires an appropriate regulatory response to move towards much denser development. If good value is to be obtained from the huge investment in infrastructure, and if we are to develop sustainable urban centres, it will be important to move fairly rapidly towards some system of congestion charging, as is happening in other EU countries. Given the EU’s plans for reducing emissions of greenhouse gases, and given its proposed limits for Ireland, the current trend towards dispersed development and long distance commuting is simply not sustainable on environmental grounds.
While the end is not quite in sight in the race to deliver an adequate public infrastructure, the major investments are likely to be completed around 2020. After that the funds that will be released as public investment is wound down will need to be reallocated to dealing with the “greying” of Ireland.
1. I
NTRODUCTION
W
hen we wrote the last Medium-Term Review in December 2005 we were concerned that a sense of economic invincibility had taken hold in Ireland and that the very real dangers facing the economy at that time were being ignored. While in that Review we did not want to overdo the sense of foreboding, mindful of the fate of Cassandra,5 still wanted to alert readersto our concerns. For this Review the task is rather different. Some of the potential difficulties that concerned us in 2005 have now come to pass (along with some we did not envisage). In addition, there is widespread concern about the immediate future prospects for the world economy. However, our essential message in this Review is upbeat, recognising that there is a danger that Irish society could be transfixed by the current very real difficulties, missing the opportunity to plan and prepare for a better future in the next decade.
1.1
Background
This focus on medium-term prospects is not intended to obscure the serious immediate problems facing the economy. However, the conclusion of this Review is that, whatever the severity of the immediate economic difficulties, if appropriately managed the current downturn will not do lasting damage to the economy’s long-term growth potential. As a result, when the economy exits from its current difficulties we anticipate a return to steady growth. While this medium-term growth in GNP will be somewhat slower than we have been accustomed to – around 3.5 per cent a year – it will, if delivered, represent a very satisfactory performance. Of course GNP is a crude measure of well-being and a number of other factors will be important if the standard of living, broadly defined, is to continue rising. Among these important issues is the delivery of an infrastructure, public and private, suitable for a rich economy in the 21st
century. Alongside this is the need to provide high quality public services efficiently. There will also need to be investment in protecting and developing our environment. An innovation in this Review is the inclusion of detailed environmental forecasts.
Setting Ireland in an international context, we must recognise that when Ireland had a standard of living well below that of our EU neighbours, there was a lot of room to outperform them. Now that we are richer than most other EU countries, outperforming our neighbours becomes much more problematic. The Benchmark forecast in Chapter 4 suggests that the Irish economy, if properly managed, can continue to make marginal improvements in living standards relative to our neighbours out to 2015.
5In Greek mythology Cassandra was fated to forecast the future with accuracy and always
to be ignored.
2 MEDIUM-TERM REVIEW 2008-2015
To some extent this superior prospective performance will be facilitated by a broadly favourable demographic profile that is not available to other EU members. Because this bonus will not last indefinitely, some of it should be used to prepare for the challenges of an ageing population that will affect Ireland in the second quarter of this century.
This Review analyses some important changes in the underlying behaviour of the economy that have become apparent in recent years. These changes have been incorporated in a revised version of the HERMES macro-economic model that is used to prepare our forecasts. For the first time the Review uses a new sustainable development model, ISus, to extend the coverage of the forecasts to examine the likely pressures on key environmental variables.
In Greek mythology HERMES was the messenger of the gods and one of his tasks was to bring dreams to mortals. We feel that the medium-term forecasts for economic growth in this Review are not merely “dreams” but, with appropriate public policies, they can be turned into a reality over the coming decade.
I
n recent years the Irish economy has undergone significant changes, which affect the way it operates. The working of the labour market has altered and the services sector is playing an increasing role in transmitting increases in world trade into demand for Irish output. For this reason we have overhauled the HERMES macro-economic model to capture the changing processes which drive growth in Ireland. The alterations in behaviour and how we have captured them in the revised model are discussed in Chapter 2. The understanding gained from this analysis has been very important in developing our medium-term forecasts for the Irish economy.1.2
Outline of
the
Review
In Chapter 3 we consider a range of background assumptions which drive our forecasts. First, we have developed a forecast for the major world economies based on the January 2008 National Institute Economic Review, and the IMF’s January 2008 forecast.6 This Benchmark forecast sees the US
economy undergoing a major slowdown this year and next and then recovering. More recent forecasts suggest a more severe downturn and this possibility is considered in a separate scenario described in Chapter 6. The Benchmark scenario sees the major world economies recovering in 2010 and returning to trend growth in subsequent years. The second set of assumptions is derived from the ESRI’s demographic model. These relate to future population structure, labour force, household formation and educational attainment. The third set of assumptions relate to the public finances.
Chapter 4 sets out our Benchmark forecast, which has been developed using the HERMES model based on the assumptions set out in Chapter 3. The figures for 2008 and 2009 are taken from the Spring Quarterly Economic
6Forecasts have changed since January involving downward revisions in growth
Commentary. This forecast includes numbers year by year out to 2015 for the major economic aggregates and for five-year average growth rates thereafter out to 2025.7
Chapter 5 of this Review produces the first set of forecasts using the ESRI’s new ISus sustainable development research model.8 This model
relates pressures on the Irish environment to key economic aggregates – for example how economic growth affects the quantity of greenhouse gas emissions. The model has been used in conjunction with the HERMES model to produce detailed energy and environmental forecasts for Ireland out to 2025. These forecasts are consistent with the Benchmark economic forecast outlined in Chapter 4. This is the most ambitious exercise of its kind undertaken in Ireland and it throws new light on the sustainability implications of the economic growth forecasts.
Because forecasts are inevitably uncertain, Chapter 6 examines three scenarios around the Benchmark forecast. The first and second scenarios examine the possibility that the Irish economy grows on average by between one half and one percentage point a year more or less than in the Benchmark forecast. These scenarios can be used to stress test policies to ensure that they are likely to prove robust in the face of an uncertain future.
The third scenario considers what the implications would be of a more severe and long-drawn out recession in the US relative to that assumed in Chapters 3 and 4.
Our conclusions are set out in Chapter 7. These conclusions draw out some of the key implications of the analysis contained in the Review for public policy. The discussion suggests that, while there are dangers for future development inherent in the forecasts, prudent policy could minimise these risks and help ensure that the Irish economy realises its considerable potential to produce a further increase in living standards.
The forecasting record of past Reviews is analysed in Appendix 1. This shows than past publications have had a reasonable track record in forecasting the average medium-term growth rate. However, they have been less successful in predicting turning points. The Benchmark forecast for the 2008-2015 period in this Review is almost identical to the housing shock scenario in the last Review. Two and a half years’ additional data have not changed our view as to the medium-term growth potential of the economy. However, the timing of the growth in the economy in this Review is rather different than in the last. As a result of this analysis we put much more emphasis in this Review on the five-year average growth rates than on the forecasts for individual years.
7More details of the numbers are available on CD from ESRI. Details, including the price,
are available from [email protected]
8This model has been developed as part of a programme of research at the Institute
4 MEDIUM-TERM REVIEW 2008-2015
T
he forecast presented in this Review, and the analysis underlying the range of different scenarios, has been developed with the assistance of five different economic models. In developing our forecast for the world economy and the external environment for the Irish economy we have used the NiGEM world model of the National Institute of Economic and Social Research in the United Kingdom. This model allows us to simulate different options on how the US economy will adjust to its current problems and how these different options are likely to affect the rest of the world. The benefit of such a model is that it allows “what if” experiments to explore the sensitivity of forecasts to changes in assumptions. This model has proved an essential tool in preparing a consistent set of forecasts for the major world economies of relevance to Ireland.1.3
Methodology
In analysing changes in the population structure that are taking place we have used the ESRI’s demographic model. This model uses very detailed data from successive CSO Labour Force Surveys and Quarterly National Household Surveys on labour force status, broken down by level of education, age and sex. The model is driven by the educational attainment of the population. In the model individuals, as they reach the age of 20 years, are assigned a level of education based on current trends. This level of education has a major impact on their labour force behaviour. The model is used to project births, deaths, the population, the labour force, the number of households, and the human capital of the work force. The level of migration is taken from the HERMES macroeconomic model. The demographic model differs from that used by the CSO in that educational attainment drives labour force participation.
The HERMES macroeconomic model has been used for two decades in preparing successive Medium-Term Reviews. Major changes were made in 2002 to incorporate a sub-model of energy demand and greenhouse gas emissions from energy use (Fitz Gerald, Hore and Kearney, 2002).9 We
have re-estimated the latest version of HERMES using data from the CSO National Income and Expenditure, 2006. The forecasts for 2008 and 2009 are based on the Spring Quarterly Economic Commentary. Appendix 1 of the Medium-Term Review: 2003-2010 provided a description of the key mechanisms in that model. As discussed in Chapter 2, this latest version of the model takes account of the major changes in the behaviour of the Irish economy that have recently been identified.
Finally, a new model relating economic activity to energy use and environmental pressures has been developed – ISus (O’Doherty, Mayor and Tol, 2007). This model is designed to take the forecasts from HERMES and use them to predict likely environmental pressures. These pressures include emissions to air, especially greenhouse gas emissions, solid waste, and water. The ISus model has been used in Chapter 6 to produce forecasts of energy demand and environmental pressures out to 2025 based on the macro-economic forecasts in Chapter 4. When forecasting energy use in electricity generation the ISus and HERMES models are supplemented by a model of the electricity sector (McCarthy, 2005).
9Development of this sub-model was supported by research grants from the
2. T
HE
B
EHAVIOUR OF
T
HE
I
RISH
E
CONOMY
T
o the outside world the recent history of Ireland is viewed as something of an economic miracle. From a relatively low standard of living within the EU-15 in the early 1990s, over the course of a little more than a decade the standard of living rose to take Ireland to the top of the scale in recent years. This achievement naturally provokes interest in whether Ireland has found the “elixir of eternal growth” and what the secret of the success actually is. In particular, can that prescription, which worked so well for Ireland, be applied elsewhere with equally advantageous results?2.1
Introduction
The answer from recent research is that there is no secret ingredient that can be prescribed for other economies. While there are some exceptional elements to the Irish experience, which are elucidated later in this chapter, the main lesson of research is that Ireland pursued very unwise economic policies with exceptional consistency in the forty years after Independence and it was not until the 1990s that Ireland reaped a reward for very belated policy reforms, implementing changes that had occurred a quarter of a century earlier in most of Ireland’s EU neighbours.
This issue of Ireland’s recent economic success has already been addressed in an extensive literature. The first phase of exceptional growth in the economy, from the early years of the 1990s through to the early years of this decade, has been extensively analysed (MTR 1997 and 1999, Fitz Gerald, 2000, Honohan and Walsh, 2002, O’Gráda, 2002). These papers suggest that to a significant extent this growth represented a catch up by the Irish economy to the standard of living of its neighbours in North-Western Europe, a catch up which had been delayed for many years by past policy failures. However, the analysis also indicated that the rapid growth owed a significant amount to demographic particularities, to the way Ireland connected with the globalisation process, FDI and corporation tax, (Barry, 2002), and to investment in human capital (Bergin and Kearney, 2007). The analysis in these papers differs as to the emphasis placed on these different factors but agrees about the range of factors involved.
This chapter, rather than replaying an old film, considers a new script on how recent developments in the economy suggest a different phase of development over the coming decade. This new phase of development is unlikely to see growth on the scale of the late 1990s. However, in the light of the changing structure of the economy apparent in recent years, there remains the prospect that the Irish economy will experience continued growth for some years to come at rates somewhat above the long-term trend for the EU-15. While on the basis of income per head Ireland comes
across as one of the rich countries in the EU, this may not be the best measure of welfare, as discussed in Section 2.2.
This chapter considers the evidence that the economy has entered a rather different phase of development. The evidence for a change in behaviour comes from a range of sources. In many cases sub-models of important processes have been estimated and included in the HERMES macro-economic model used in the rest of this Review. These sub-models are briefly discussed in Appendix 2.
Section 2.3 examines some of the key trends apparent in the recent data for the economy. Section 2.4 considers the growing importance of the market services sector, in particular that of business and financial services. Section 2.5 examines changes in productivity and in the terms of trade in recent years and considers how recent trends may affect development out to 2020. It also considers how investment in human capital may affect future trends in productivity.
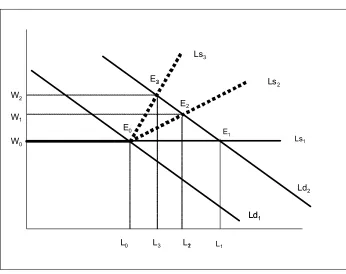
The last decade has also seen a radical change in the behaviour of the labour market. This change has been concentrated on the factors affecting the supply of labour, and its elasticity with respect to real after tax wages. The changing shape of the supply curve of labour, and the change in the factors affecting wage formation in Ireland, have important policy implications. These are discussed in Section 2.6. The housing market and the factors driving it are discussed in Section 2.7. Section 2.8 summarises the implications of this analysis for the Irish economy in the medium term.
T
here are many different ways of measuring living standards. Probably the best income based measure is Gross National Disposable Income (GNDI), which takes account, inter alia, of EU transfers and, more important, changes in the terms of trade (the purchasing power of Irish exports relative to imports). However, when comparing living standards across countries the most common approach is to compare GDP per head or per person employed, adjusted for the cost of living. In the case of Ireland GDP is not the appropriate measure because of the large amount of profits repatriated abroad by foreign firms, which are not available for domestic consumption. For that reason here we use GNP for Ireland instead of GDP. For other EU countries GNP is very similar to GDP.2.2
Measuring
Living
Standards
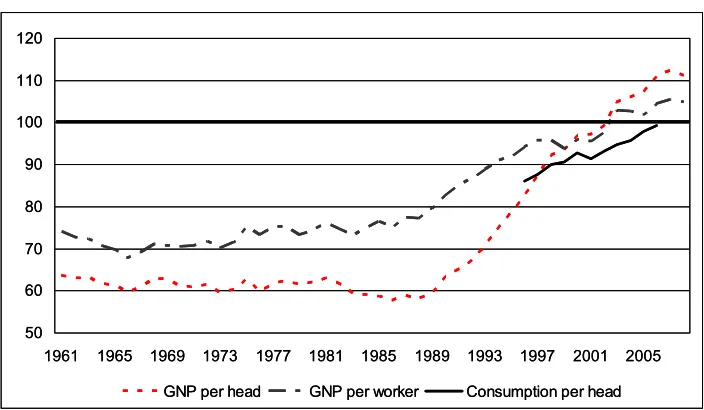
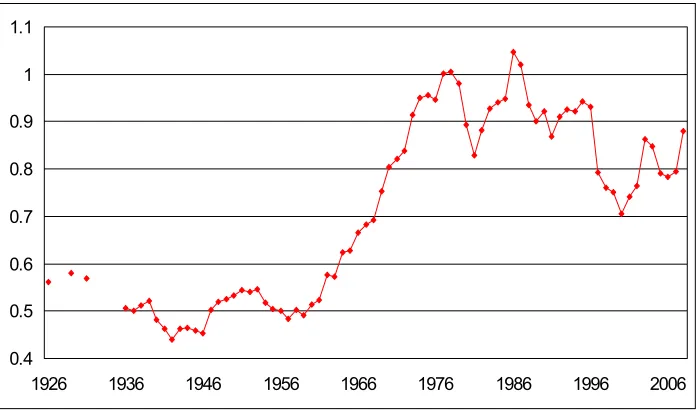
By the conventional measure of living standards Ireland is now one of the richest countries in the EU. Figure 2.1 shows the trend in GNP per capita relative to the EU-15 over more than four decades.10 This graph
shows that, measured in terms of GNP per head, there was very limited change in Ireland’s relative position between 1960 and 1990. However, from 1990 onwards there was very rapid convergence, taking Ireland to an income per head, adjusted for purchasing power, which is 10 per cent above the average for the EU-15 today.
10 The figures for Ireland are for GNP per capita. Those for the rest of the EU are GDP
8 MEDIUM-TERM REVIEW 2008-2015
Figure 2.1: Relative Standard of Living, Ireland v 15, in PPS, EU-15=100
50 60 70 80 90 100 110 120
1961 1965 1969 1973 1977 1981 1985 1989 1993 1997 2001 2005
GNP per head GNP per worker Consumption per head
50 60 70 80 90 100 110 120
1961 1965 1969 1973 1977 1981 1985 1989 1993 1997 2001 2005
GNP per head GNP per worker Consumption per head
Source: EU Commission: European Economy, and ESRI databank.
As shown in Figure 2.1 there was somewhat steadier progress in terms of convergence in productivity levels – GNP per person employed. Ireland today has a level of GNP per person employed that is about 5 per cent above the average for the EU-15, a significantly smaller gap than for income per head. The difference between these two measures reflects the very favourable trend in the dependency ratio in Ireland since 1990. This is discussed in more detail in Chapter 3.
Figure 2.1 also shows consumption per head for Ireland for the period 1995-2006. This suggests that Ireland is only today reaching the average EU-15 level of consumption. This is a more appropriate measure of current standard of living than the income per head measure. The gap between this measure and the measure of income reflects the fact that Ireland has a much lower endowment of public infrastructure than most of the rest of the EU-15. As a result it has to invest much more to catch up, leaving less resources available for current consumption, private or public.
T
he channels through which changes in world economic activity have been transmitted to the Irish economy have altered over time. Half a century ago the primary channel was through agricultural exports. More recently the manufacturing sector has been the conduit through which the growth in world trade has impacted on the economy. However, since the turn of the century the services sector has grown rapidly in importance as a link between domestic economic activity and world trade.2.3
The
Changing
Structure of
the
Economy
In the latest version of the HERMES model activity in both the manufacturing sector and the tradable market services sector is modelled as a function of world growth and Ireland’s share of world output is a function of Ireland’s competitiveness on the world market, broadly defined (Bradley and Fitz Gerald, 1988 and Bradley, Fitz Gerald and Kearney, 1993). The research results, described in Appendix 2, indicate that this model, which for many years has been used to model Irish manufacturing sector output, now applies equally to the rapidly growing trade in services. Initially, the key point of contact between the production sector of the Irish economy and the outside world was through agricultural exports. In the early 1960s agricultural exports accounted for over 40 per cent of all exports but only 12 per cent of GNP (Table 2.1). These exports underwent limited processing in Ireland and the terms of trade for such exports were generally unfavourable.
From the late 1950s onwards there was an increasing consciousness among policymakers that future economic prosperity would depend on developing a vibrant manufacturing sector to take over gradually from agriculture as the driving force of growth. The approach that Ireland adopted to opening up its economy belatedly to the globalisation process from 1960 onwards was unusual (Honohan and Walsh, 2002). Considerable reliance was placed on the attraction of foreign firms to Ireland to help modernise the manufacturing sector. A key element in this policy was the effective exemption of profits on all export sales from corporation tax.
While the change in the corporate tax regime was made in the late 1950s, it was really only with the reduction in the protective barriers to trade with Ireland’s trading partners that this policy began to bear fruit. The first reduction in tariff barriers began in the early 1960s and the process culminated in membership of the EU in 1973.11 By 1980 agricultural
exports still accounted for just over a quarter of exports while industrial exports had by then risen to account for almost 60 per cent of the total and 28 per cent of GNP.
Between 1980 and 2000 the manufacturing sector grew dramatically in size so that by 2000 industrial exports accounted for just under three- quarters of all exports and amounted to 85 per cent of the value of GNP. Over this period the growth in the manufacturing sector was clearly the major channel through which the growth in world trade (and output) was transmitted to the Irish economy.
11 For a few sectors (e.g. motor vehicle assembly) the barriers were not fully phased out till
10 MEDIUM-TERM REVIEW 2008-2015
Table 2.1: Exports Share of the Economy, Value, %
Share of 1960 1980 2000 2007
Agricultural Exports 40.9 26.1 4.3 3.7
GNP 12.1 12.2 5.0 3.5
Industrial Exports 29.4 59.5 73.8 52.9
GNP 8.7 27.9 85.2 49.4
Services Exports 29.8 14.5 21.9 43.4
GNP 8.9 6.8 25.3 40.5
However, from the late 1990s onwards there has been a dramatic rise in the role of the market services sector. By 2000 exports of services already accounted for 22 per cent of exports, amounting to 25 per cent of GNP. By 2007 this had risen to over 40 per cent of both exports and GNP. Clearly, this is now a major channel through which world economic growth is transmitted to the Irish economy. As discussed in Chapter 4, this channel is likely to continue growing in importance over the coming decade, gradually replacing the manufacturing sector as the key channel for the transmission of world growth to the economy.
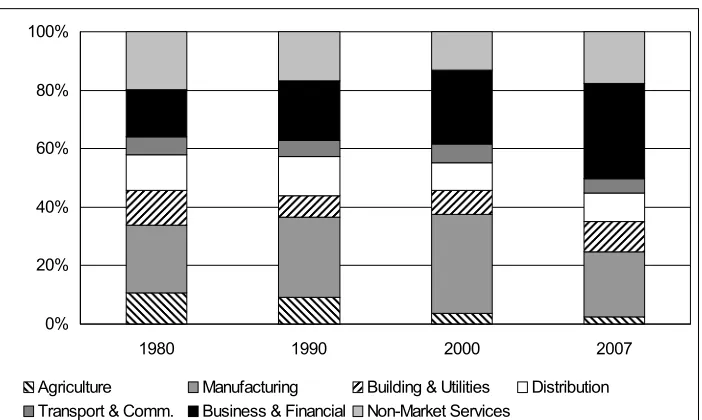
This change in the pattern of exports over time has also been reflected in a change in the pattern of output in the economy (Figure 2.2). Twenty-five years ago the agricultural sector was still a significant contributor to output in Ireland accounting for over 10 per cent of GDP (and agricultural exports were 12 per cent of GNP). Manufacturing accounted for just under a quarter of output, somewhat greater than would be the contribution in most of the more developed world economies at that time. However, the last quarter century has seen a transformation in the structure of the economy. Today, agriculture accounts for only 2 per cent of output and manufacturing, which grew rapidly in importance in the 1990s to account for a third of output in 2000, had by 2007 fallen back to its position in 1980, accounting for 22 per cent of GDP.
Figure 2.2: Share of GDP by Productive Sector
0% 20% 40% 60% 80% 100%
1980 1990 2000 2007
Agriculture Manufacturing Building & Utilities Distribution
It is the business and financial sector,12 which has grown continuously in
importance as reflected in its share of GDP over the period, so that today it accounts for about a third of the output of the economy. Within that sector, the financial services sub-sector itself now accounts for 10 per cent of total GDP. New data from the Central Statistics Office (CSO) show for the first time gross output by the services sector for the years 2002 and 2003 (the GDP figures above are based on value added – wages and profits). While not directly comparable, the ratio of exports of other services (excluding tourism) to the gross output of the business and financial services sector in 2003 was over 70 per cent, up from 60 per cent in 2002. While this exaggerates the share of the output of the sector which is exported, as a significant part of services exports comes from other sectors, it is still an indication of the globalisation of the sector in recent years and its crucial importance as a link between Ireland and the world economy.
One surprise in these data is the relatively small share of value added accounted for directly by the building and construction sector – approximately 10 per cent of GDP. This contrasts with the share of gross output of the construction sector, which accounted for just under 20 per cent of GDP in 2007. It reflects the fact that there are substantial inputs, largely from domestic sources, which are used in the sector, so that the footprint of building and construction spreads to many other sectors in the economy – especially business and financial services and manufacturing. Finally, the production of non-market services (the public sector) accounted for 18 per cent of GDP in 2007, up from 13 per cent in 2000, but still below its share of 20 per cent in 1980.
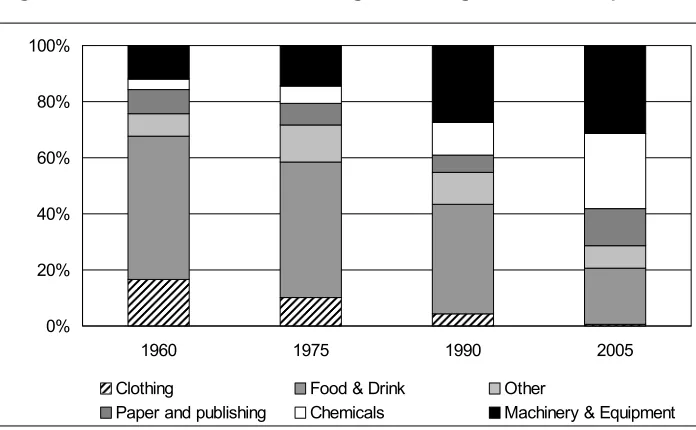
Within manufacturing there has also been a major change in structure over the period (Figure 2.3). Clothing, which accounted for 17 per cent of gross output in 1960 has now effectively disappeared as a sector. Food, drink and tobacco, which accounted for just under 50 per cent of gross output as late as 1975 now accounts for just 20 per cent. The three sectors which have grown very substantially in share are chemicals, including pharmaceuticals; paper and publishing, which includes reproduction of computer media,13 and machinery and equipment which includes
computers, instrument engineering etc.
In the case of machinery and equipment, the growth in share was particularly rapid between 1975 and 1990. Further growth to 2005 has taken it to over 31 per cent of gross output of manufacturing. The growth in chemicals has been particularly large since 1990, accounting for 27 per cent of gross output by 2005. The rapid growth in the paper and publishing sector is even more recent. By 2005 it accounted for 13 per cent of output, the bulk of it being in the reproduction of computer media category. This means that the three more “high-tech” sectors now account for over 70 per
12 The Business and Financial sector includes banking and insurance, real estate, computer
services, R&D, professional services and other market services not included elsewhere. Distribution includes retailing and wholesaling. The coverage of Transport and Communications is self-explanatory.
13 The measured output of this manufacturing sector may be affected by changes in the
12 MEDIUM-TERM REVIEW 2008-2015
[image:23.595.167.515.134.349.2]cent of manufacturing output. With food and drink still accounting for 20 per cent, it means that the rest of manufacturing now makes a very small contribution to total output.
Figure 2.3: Structure of Manufacturing, Percentage of Gross Output
0% 20% 40% 60% 80% 100%
1960 1975 1990 2005
Clothing Food & Drink Other
Paper and publishing Chemicals Machinery & Equipment
Figure 2.4: Share of Manufacturing Output Exported, %
0 20 40 60 80 100
1990 1995 2000 2005
An important feature of the manufacturing sector today is the very high proportion of its output that is exported (Figure 2.4). With the proportion now exceeding 80 per cent, it means that fluctuations in domestic demand have a very limited impact on the output of the sector. Also, because such a high proportion of the output of the sector is destined for the EU market, it is fluctuations in demand within that much wider market that drives day-to-day fluctuations in the output of the sector in Ireland. This contrasts with the market services sector, which still produces the majority of its output for the domestic market, though also serving an ever-increasing export demand.
[image:23.595.168.519.380.581.2]firms to attribute as much of their profits as legitimately possible to their Irish operations. The result has been a high observed rate of profit in manufacturing in recent years.
Figure 2.5 shows the operating surplus (profit) rate for the three sub-sec
In 1989 the favourable corporate tax regime applicable to the ma
tors of manufacturing since 1980. This figure shows that, while there were major differences in profit rate twenty-five years ago, the profit rates have tended to converge over time to their current level. Over the course of the 1980s the profit rate in the traditional and high-tech sectors tended to drift upwards stabilising in the 1990s at between 25 per cent and 30 per cent of gross output. The most recent years for which data are available suggest some downturn to a rate of around 25 per cent, possibly reflecting rapidly rising costs in Ireland and a more competitive external environment. For food processing the rate of profit was exceptionally low in the 1980s, reflecting the fact that the sector was dominated by farmer-owned co-operatives that sought to maximise input prices (paid to farmers) rather than profits. However, the change in the structure of the sector in the 1980s and the 1990s has seen it achieve profit rates of around 20 per cent in recent years, the kind of behaviour observed for other manufacturing sectors.
Figure 2.5: Profit Rate, Manufacturing
0% 5% 10% 15% 20% 25% 30% 35%
1980 1982 1984 1986 1988 1990 1992 1994 1996 1998 2000 2002 2004
High Tech. Traditional Food
14 MEDIUM-TERM REVIEW 2008-2015
Figure 2.6: Profit Share of Value Added, Financial Services
0% 20% 40% 60% 80%
1970 1975 1980 1985 1990 1995 2000 2005
A substantial share of the profits earned in the Irish economy, especially in manufacturing and business and financial services, are the property of owners who are resident outside Ireland, in particular, foreign multinational firms. However, this also applies to many of the largest firms, such as banks, the majority of whose shareholders are resident outside Ireland. The profits, whether paid as dividends or retained in the firms are considered the income of these foreign residents and deducted from GDP to arrive at GNP. The diversification geographically in financial portfolios also means that there is a substantial, though smaller inflow of profits into Ireland to those residents who own assets abroad.
Profit repatriations from the business and financial sector are now of a similar magnitude to those from the manufacturing sector. This has to be taken into account in considering the impact of growth in the business and financial sector on the wider economy. The latest version of the HERMES
macro-economic model incorporates such an adjustment.
T
he external environment in which the Irish economy operates has changed markedly over the last fifteen years. The rise of China, India, and more recently Brazil, as major players in world trade has brought about changes throughout the world economy. These newly emerging industrial economies have a huge potential supply of unskilled and semi-skilled labour available to work in manufacturing.2.4
Market
Services –
New Driver
of Growth
that their economies have a comparative advantage in producing less-skill intensive manufactured goods.
Developments in information technology and transport have also had their effects. These innovations have made goods and services, which had previously been non-traded, into very fast-growing areas of trade. In the services sector, especially financial services, globalisation and the reduction in non-tariff barriers, combined with developments in information technology, have produced an integrated financial system spanning most developed economies. Some of the most rapidly growing areas, such as financial services, use English as their language of communication, which confers an advantage on the Irish economy.
In addition to the changing pattern of world supply the pattern of world demand has also been changing. As incomes have risen in the developed world and the relative price of goods has fallen, demand has shifted towards services, especially towards new products and services related to the revolution in information technology. These goods and services, the production of which requires a major input of skilled labour, are in ever-increasing demand.
This changing global context means that Ireland’s comparative advantage is also shifting. Obviously, the speed with which change takes place in Ireland is partially determined by developments in Irish competitiveness. However, it is also affected in a more positive way by developments in education, R&D, and information technology, which develop niches where the Irish economy may find new opportunities. As a result of the changes in the global trading environment the baton of economic growth is passing from manufacturing to the business and financial services sector of the Irish economy. This reflects long-term changes in Ireland’s comparative advantage in the global economy. In recent years the loss of competitiveness relative to our EU partners has taken its toll on Irish manufacturing. This sector has to compete in a global market and the specialised advantages of the Irish economy (e.g. the tax regime) are increasingly outweighed by the rise in other costs. While some parts of this sector are human-capital intensive, it is less dependent on such skills than the business and financial sector. The closure of much of lower skilled manufacturing, as a result of the loss of competitiveness, is more than offsetting the effects of a growth in the most skill-intensive sectors. This is reflected in the decline in employment in the sector in recent years and also in the changed composition of manufacturing output as reflected in Figure 2.3.
16 MEDIUM-TERM REVIEW 2008-2015
comparative advantage indicate that Ireland has a comparative advantage in the supply of financial services, computer and IT services and other business services.14
Developments in the world economy impact on Ireland through a range of different channels. These channels include financial markets, world trade, and labour mobility. Here we concentrate on the transmission of changes in world activity directly to the Irish economy through trade. Domestic competitiveness relative to the rest of the world determines what share of world output is produced in Ireland.
The latest version of HERMES has a new sub-model of the business and financial sector that reflects the factors driving the sector. As explained in Appendix 2, this model first explains exports of services (excluding tourism) in terms of the growth in world activity, the rate of corporation tax payable by the sector, and the cost of Irish output relative to that of competitors (competitiveness). Then the output of the sector is modelled as being driven by exports and by domestic demand as well as by Irish competitiveness. The model indicates that, while foreign demand accounted for less than 10 per cent of the output of the sector a decade ago, it now accounts directly for around 30 per cent of output. This model also indicates that the move to a common low rate of corporation tax had a major impact on the output of the sector over the period 1995-2005. However, that effect is now completed and, while underpinning existing output, it is not likely to contribute to further growth in the sector.
The sub-model of the manufacturing sector is also described in Appendix 2. As with market services, Ireland’s share of world output of manufactured goods is a function of Ireland’s competitiveness (Bradley and Fitz Gerald, 1988 and Bradley, Fitz Gerald and Kearney, 1993). Thus the growth in the sector is driven by the growth in world output and by Ireland’s competitiveness as a location for manufacturing.
A third, though much less important channel through which changes in world activity impact on the Irish economy is tourism. As with the other sectors trading on a world market, tourism exports are sensitive to the growth in world activity and to competitiveness.
Thus, there are three main sectors through which the growth in world trade directly affects the Irish economy – manufacturing, business and financial services and tourism. Using the HERMES model it is possible to decompose the effects of the growth in world trade to determine the relative importance of these three channels. Table 2.2 shows the impact on certain key variables through the three different channels and the combined effect of all three. These effects are presented for two cases, one where the positive shock to world activity occurs in 1990, before the boom in services exports really began, and one where it occurs in 2006, the latest date for which we have the necessary published data. Comparing the results from these two shocks illustrates the changing importance over time of the different channels through which world growth is transmitted to the Irish economy.
Table 2.2: Effects of a 1 Per Cent Increase in World Activity Through Different Channels
Stimulus in 2006, effects shown for 2010
Channel: Combined Tourism Manufacturing Business
Services Effect in % points on:
GNP 1.32 0.16 0.79 0.44
Manufacturing output 2.51 0.00 2.96 0.00
Business services
output 1.59 0.16 0.32 1.37
Total employment 0.57 0.09 0.42 0.35
Business services exports
3.68 0.00 0.00 4.80
Tourism exports 2.21 2.41 0.00 0.00
Stimulus in 1990, effects shown for 1994
Channel: Combined Tourism Manufacturing Business
Services Effect in % points on:
GNP 0.85 0.16 0.55 0.10
Manufacturing output 1.93 0.00 2.20 0.00
Business services output
0.77 0.17 0.32 0.29
Total employment 1.94 0.00 2.46 0.00
Business services
exports 0.50 0.15 0.28 0.24
Tourism exports 0.59 0.09 0.64 0.05
In this case the stimulus is assumed to amount to 1 per cent of world activity in either 1990 or 2006, sustained indefinitely. The effect on the Irish economy is measured for 1994 and 2010, the fifth year of the change, allowing time for production to adjust to the increase in demand. The combined effect of all three channels is shown in the first column of the table. For 2010 they sum to less than the sum of the parts because the rise in domestic activity through each of the channels raises the demand for labour leading to increased wage rates. To a limited extent this rise in wage rates offsets the benefits of the increase in foreign demand for Irish output.
The combined effects (through all channels) of growth in world demand on the Irish economy in 1990 were substantially less than they would be today. In the case of the shock beginning in 1990, in the fifth year, 1994, the effect would have been to raise GNP by 0.85 percentage points above what it otherwise would have been, compared to an addition of 1.32 percentage points in 2010 for a shock beginning in 2006. This substantial increase in the impact of world growth on Ireland is due to the changing structure of the economy. It is now more integrated into the global economy and the internationalisation of business services has contributed an important additional link between the Irish economy and the world market for traded goods and services.
18 MEDIUM-TERM REVIEW 2008-2015
of the increase in Irish output would actually occur in business services, providing services as an input to domestic manufacturing.
Table 2.3: Share of GNP Growth from Different Channels
Tourism Manufacturing Business
Services
2010 11.5 56.8 31.7
1994 19.8 67.9 12.3
Today, almost one-third of the effect on the Irish economy of an increase in world output would be transmitted to GNP directly through the business and financial services sector (Table 2.3).15 In this case (and the
case of tourism exports) there is no real effect on domestic manufacturing as such a high proportion of manufacturing output is now exported – it is not used elsewhere in the services sector. Finally, the increase in tourism exports, as a result of higher world output (driving foreign demand for holidays in Ireland), would account for just over 10 per cent of the ultimate impact of an increase in world output on Irish GNP.
The results for the 1990 shock are very different from those for the 2006 shock. In the case of the earlier shock, by 1994, some 68 per cent of the effect would have come through manufacturing with only 12 per cent through business and financial services. In the earlier period tourism was also more important, accounting for 20 per cent of the impact of growth in world activity on the Irish economy. What this illustrates is the major increase in importance of the business and financial services sector as a crucial link between the Irish economy and world growth. The sector, which was largely providing for a domestic market in 1990, is now a major exporter. The rise in services exports (excluding tourism) has been a very recent phenomenon and has taken place at a very rapid pace. This trend is likely to continue in the forecast period, as discussed in Chapter 4.
This change has major importance in understanding what drives growth in the Irish economy. Until very recently all the emphasis was put on attracting manufacturing to Ireland, very often owned by foreign multinationals. However, for the future new factories will be less common and the major impetus to growth will come from expansion of the business and financial services sector. This has implications for a range of policy areas, including “industrial policy” and regional policy. In planning for the years ahead, while manufacturing will remain important for the foreseeable future, the major growth in activity is likely to occur in business and financial services. Public policy will need to plan for the infrastructural needs of the Irish and foreign firms that will provide this future growth. These needs will be rather different from those of traditional manufacturing plants. Regional policy will need to take account of the fact that business and financial services jobs tend to be concentrated in large urban centres. With this sector providing the major growth in employment in the future, it emphasises the importance of the National Spatial Strategy’s approach of concentrating on a few key “gateways”.
15 All of these results leave out the transmission to Ireland of the effects of changes in
While Ireland clearly has enjoyed a competitive advantage in the business and financial services sector in world markets over the last decade, this advantage is in no way guaranteed. The HERMES model indicates that business services exports and output are very sensitive to Ireland’s competitiveness (Appendix 2). This is illustrated in Table 2.4, which shows the impact of a one percentage point improvement in Ireland’s competitiveness relative to the rest of the world, assumed to begin in 2006, and sustained for twenty years. Wages in Ireland are held constant (as are import prices). To capture the full long-run effects of competitiveness changes the effects on the key variables are shown for 2025. The results indicate that the supply response for both tourism and business services exports is similar lying in the range 1.29 to 1.35.
Table 2.4: Effects of a 1 Per Cent Improvement in Competitiveness
Stimulus in 2006 effects in 2025
Effect in Percentage Points on:
GNP 0.83
Manufacturing output 1.08
Business services output 0.72
Total employment 0.45
Business services exports 1.29
Tourism exports 1.35
Manufacturing output shows a supply elasticity of just over unity when faced with a one percentage point improvement in competitiveness. When the combined effects on the three sectors exposed to international competition are taken into account, the effect of the improvement in competitiveness on GNP is around 0.85 percentage points by the end of the period.
While Ireland is specialising into certain sectors where it has special advantages, there are other developed countries with similar advantages. As a result, these model results suggest that competitiveness relative to our neighbours is very important, not just for manufacturing, but also for business services. This conclusion is also broadly consistent with the results using a much simpler model of the Irish economy in Bergin and Kearney (2007).
20 MEDIUM-TERM REVIEW 2008-2015
T
he manufacturing sector has seen very high rates of productivity increase over a prolonged period. This reflects the heavy weighting of the high-tech sub-sector in manufacturing. The nature of the product of this sector means that technical innovation is particularly rapid resulting in substantial cost reductions each year. Table 2.5 shows the five-year average growth in labour productivity for the three sub-sectors of the manufacturing sector used in the HERMES model, as well as for market services.2.5
Productivity,
Human
Capital and
the Terms of
Trade
Table 2.5: Labour Productivity, 5 Year Averages, Per Cent
1980- 85
1985-90
1990-95
1995-00
2000-05 Manufacturing
Traditional 5.2 6.0 4.8 4.5 4.8
Food Processing 7.4 7.9 5.9 2.9 7.0
High-Tech. 14.2 8.3 8.3 14.5 9.3
Total 6.9 6.4 5.8 8.3 7.7
Market services
Business & Financial -1.8 6.5 -1.6 6.7 0.3
Distribution 2.3 -1.3 -1.0 0.6 2.9
Transport &
Communications 3.0 6.9 4.0 4.6 3.5
Total 1.5 1.7 -0.1 3.0 2.5
The exceptionally high rate of productivity increase was not confined to what we have here defined as the high-tech sector – chemicals and engineering.16 In addition, what is here defined as the “traditional” sector
includes paper and publishing, which has within it the “reproduction of computer media” category, which is properly a high-tech business. The high rate of productivity increase owes much to the gradual replacement of low productivity firms by firms in niches with much higher productivity (Haller, 2007). The result of this transformation is a continuing very high rate of productivity increase in manufacturing. This is not just a phenomenon of the 1990s but has been sustained over a very long period, as shown in Table 2.5, and it has been accompanied by a major change in the structure of the sector.
The existence of very high rates of productivity growth in the manufacturing sector has, of course, meant that the very high rate of growth in output has been accompanied by a moderate, though nonetheless significant, increase in employment. However, if the industry matures and experiences slower growth in output in the future the continuation of such a high rate of productivity increase will involve a contraction in the employment of the sector. This appears to have happened in the most recent years, with a substantial fall in employment since its peak in 2001.
16 Because of problems in availability of suitable national accounts data it is not possible to