Statistics
in focus
ECONOMY AND FINANCE
23/2008
Authors
Anne PATERNOSTER
Monika WOZOWCZYK
Alessandro LUPI
C o n t e n t s
Highlights ... 1
Government revenue and expenditure by country ... 2
Government expenditure, main components... 4
Government revenue, main components... 5
Government deficit and net saving... 8
Link between saving and net lending/net borrowing ... 10
Definitions ... 11
Ge ne ra l gove rnm e nt
e x pe ndit ure a nd re ve nue in
t he EU , 2 0 0 6
Highlights
• Total EU27 government expenditure represented 46.8% of GDP in 2006, the lowest ratio in five years; for the EA13 it amounted to 47.3%
• EU27 and EA13 government revenue-to-GDP ratio reached 45.2% and 45.7% respectively in 2006, the highest values in five years;
• EU27 and EA13 government net lending/ net borrowing was at 1.6% of GDP in 2006, the lowest since 2002;
• EU27 and EA13 government net saving in 2006 was positive for the first time since 2001;
[image:1.595.224.553.344.524.2]• Ten out of the 27 Member States (six out of the 13 members of the euro area) reported net lending in 2006, the highest number since 2001.
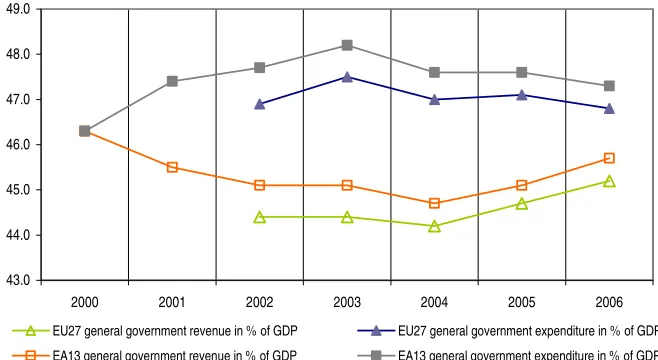
Figure 1: Total government revenue and expenditure in % of GDP
43.0 44.0 45.0 46.0 47.0 48.0 49.0
2000 2001 2002 2003 2004 2005 2006
EU27 general government revenue in % of GDP EU27 general government expenditure in % of GDP
EA13 general government revenue in % of GDP EA13 general government expenditure in % of GDP
Source: Eurostat, Economy and finance, Government statistics.
Government revenue, expenditure and deficit/surplus are concepts used to analyse fiscal policy. The Maastricht Treaty stipulates that Member States shall “regard their economic policies as a matter of common concern”, and Article 104 of the Treaty on European Union obliges Member States to avoid excessive government deficits, including the possibility of financial sanctions. The protocol on the Excessive Deficit Procedure, annexed to the Treaty, defines two criteria and reference values for compliance. These are a government deficit to Gross Domestic Product (GDP) ratio of 3 per cent, and a government debt to GDP ratio of 60 per cent.
In the framework of the ESA 95 transmission programme, European Union Member States have reported, in most cases, their half-finalized general government expenditure and revenue data for 20061, as well as data on net lending/ net borrowing that underlie the definition of government deficit/surplus for the reporting of EU Member States under the Excessive Deficit Procedure (EDP).
1
Commission Regulation (EC) No 1500/2000 implementing Council Regulation (EC) No 2223/96. Reporting of European System of Accounts (ESA 95) transmission table 2 by Member States to Eurostat is at t+3 and t+9 months. These data correspond to the end-September 2007 transmission.
(
#
Manuscript completed on: 04.03.2008 Data extracted on: 25.05.2007 ISSN 1977-0316
Government revenue and expenditure by country
Sweden, Denmark and France have the largest government sector in the EU in relative terms
Table 1 shows the size of the general government sector in each country in terms of its revenue and expenditure. Relative to GDP, using a combined measure (adding together the revenue and expenditure of each country), Sweden has the largest government sector in the EU, followed by Denmark and France. The government sector is smallest in Lithuania, Romania, and Estonia. In general the twelve Member States that joined the EU after 2003 have a small government sector. Out of the ‘old’ Member States, Ireland has by far the smallest government sector. It should be noted that, for the main transactions taking place between entities classified within the government sector - property income (ESA code D.4) – mainly interest, other current transfers (D.7), capital transfers (D.9) - the data are consolidated. In other words, such transactions are excluded from the revenue and expenditure figures shown. However, for several countries2 the data are overstated as a result of recording some of these transactions on a non-consolidated basis.
EU government revenue-to-GDP ratio at its highest in five years
After remaining stable for a couple of years, the revenue to GDP ratio increased from 2004 on (see Figure 1). In 2006 EU27 government revenue represented 45% of GDP, the highest value in five years. The development for the euro area followed a similar trend (with a slightly sharper decrease between 2003 and 2004), but with revenue slightly higher. Across countries government revenue to GDP varied strongly (table 1). In 2006 government revenue to GDP was lowest in Romania (33%), Lithuania (33%), and Slovakia (34%). The largest shares were observed for Sweden (58%), Denmark (56%), and Finland (53%). The variance between Member States’ revenue-to-GDP ratios has been considerably reduced since 2000.
EU government expenditure-to-GDP ratio at its lowest in five years
In 2006 EU27 government expenditure represented 46.8% of GDP, the lowest value in five years (Figure 1). The highest ratio was reported in 2003 (47.5%). Lower expenditure growth than GDP growth brought the ratio slightly under its 2002 value in 2006. The euro area experienced a similar trend but expenditure-to-GDP was higher. This gap however was gradually reduced from 0.8% in 2002 to 0.5% in 2006. Comparing expenditure-to-GDP across countries reveals relatively large differences (Table 1). Five Member States recorded in 2006 a government expenditure exceeding 50% of their GDP: Sweden (56%), France (53%), Hungary (52%), Denmark (52%) and Italy (50%), while in four Member States the level of expenditure-to-GDP was equal to or
2 These countries are as follows: Slovenia (before 2002), Denmark,
[image:2.595.309.548.147.316.2]lower than 35%: Romania (35%), Ireland (34%), Lithuania (34%), Estonia (33%).
Figure 2: Total government revenue per inhabitant in euro, 2000 to 2006
8,500 9,000 9,500 10,000 10,500 11,000 11,500 12,000 12,500 13,000
2000 2001 2002 2003 2004 2005 2006 EU27 general government revenue per inhabitant EA13 general government revenue per inhabitant
Source: Eurostat, Economy and finance, Government statistics
EU government revenue and expenditure per inhabitant constantly increasing
As for revenue compared to GDP, EU government revenue per inhabitant has increased since 2002. In 2006, it amounted to almost 11 thousand euro. The trend for the euro area followed the same pattern, but with higher revenue per inhabitant.
Over the last seven years the government revenue per inhabitant exceeded 20,000 EUR in Luxembourg and Denmark, while it was less than 1,500 EUR in Romania and Bulgaria.
[image:2.595.309.549.559.716.2]Figure 3 shows that expenditure per inhabitant for EU general government has grown slightly slower than government revenue per inhabitant.
Figure 3: Total government expenditure per inhabitant in euro, 2000 to 2006
8,500 9,000 9,500 10,000 10,500 11,000 11,500 12,000 12,500 13,000
2000 2001 2002 2003 2004 2005 2006 EU27 general government expenditure per inhabitant EA13 general government expenditure per inhabitant
#
"
________________________________________________23/2008
—
Eco
nomy and finance
—
S
ta
ti
s
ti
c
s
i
n
f
o
c
u
s
[image:3.842.55.780.91.478.2]3
Table 1: Government revenue and expenditure by country in percentage of GDP and per capita, from 2000 to 2006
2000 2001 2002 2003 2004 2005 2006 2000 2001 2002 2003 2004 2005 2006 2000 2001 2002 2003 2004 2005 2006 2000 2001 2002 2003 2004 2005 2006
EU27 : : 44.4 44.4 44.2 44.7 45.2 : : 46.9 47.5 47.0 47.1 46.8 : : 9,054 9,161 9,520 9,980 10,605 : : 9,566 9,806 10,126 10,522 10,992
EU25 45.8 45.1 44.5 44.5 44.2 44.8 45.3 45.5 46.5 47.0 47.6 47.1 47.2 47.0 9,208 9,411 9,588 9,700 10,070 10,538 11,182 9,158 9,700 10,132 10,384 10,714 11,114 11,592
EA13 46.3 45.5 45.1 45.1 44.7 45.1 45.7 46.3 47.4 47.7 48.2 47.6 47.6 47.3 10,168 10,378 10,590 10,829 11,098 11,500 12,152 10,168 10,798 11,193 11,571 11,805 12,132 12,569
EA12 46.3 45.5 45.1 45.1 44.7 45.1 45.7 46.3 47.4 47.7 48.2 47.6 47.6 47.3 10,204 10,413 10,624 10,863 11,131 11,533 12,187 10,202 10,833 11,229 11,607 11,841 12,168 12,606
BE 49.1 49.6 49.8 51.1 49.1 49.9 49.1 49.1 49.1 49.8 51.1 49.2 49.9 48.9 12,072 12,496 12,900 13,534 13,655 14,211 14,623 12,059 12,368 12,909 13,543 13,676 14,226 14,555
BG : : 39.6 40.3 42.0 41.6 40.3 : : 39.7 40.3 39.7 39.6 37.1 : : 839 917 1,075 1,179 1,317 : : 841 917 1,017 1,123 1,211
CZ 38.1 38.7 39.5 40.7 42.2 41.3 40.7 41.8 44.5 46.3 47.3 45.1 44.9 43.6 2,281 2,617 3,101 3,230 3,649 4,051 4,518 2,503 3,004 3,632 3,754 3,903 4,397 4,843
DK 56.5 56.0 55.4 55.6 57.3 57.8 56.2 54.2 54.8 55.2 55.7 55.4 53.1 51.5 18,374 18,737 19,052 19,429 20,789 22,205 22,756 17,636 18,342 18,971 19,464 20,096 20,426 20,870
DE 46.4 44.7 44.4 44.5 43.3 43.5 43.8 45.1 47.6 48.1 48.5 47.1 46.9 45.4 11,650 11,482 11,548 11,657 11,614 11,848 12,350 11,320 12,206 12,498 12,715 12,626 12,764 12,803
EE 36.2 35.0 36.0 36.4 35.9 35.4 36.6 36.5 35.1 35.6 34.6 34.1 33.4 33.0 1,611 1,772 2,052 2,337 2,534 2,941 3,602 1,622 1,775 2,031 2,219 2,407 2,782 3,252
IE 36.3 34.3 33.2 33.8 35.2 35.4 37.1 31.5 33.3 33.6 33.4 33.9 34.2 34.2 9,987 10,398 11,014 11,820 12,886 13,785 15,246 8,682 10,100 11,139 11,676 12,386 13,316 14,041
EL 43.0 40.6 40.0 39.3 38.2 38.0 39.5 46.7 45.0 44.8 45.0 45.4 43.2 42.3 5,428 5,463 5,738 6,104 6,388 6,804 7,610 5,899 6,057 6,427 6,987 7,594 7,743 8,142
ES 38.1 38.0 38.4 38.2 38.5 39.4 40.4 39.1 38.6 38.9 38.4 38.9 38.5 38.6 5,967 6,348 6,780 7,115 7,590 8,256 8,992 6,123 6,458 6,864 7,157 7,660 8,054 8,585
FR 50.2 50.0 49.5 49.2 49.6 50.7 50.8 51.6 51.6 52.6 53.4 53.2 53.7 53.4 11,901 12,239 12,434 12,656 13,177 13,858 14,408 12,251 12,619 13,230 13,715 14,142 14,674 15,138
IT 45.3 44.9 44.4 44.8 44.2 44.0 45.6 46.2 48.0 47.4 48.3 47.7 48.3 50.1 9,479 9,843 10,055 10,380 10,566 10,677 11,435 9,660 10,523 10,738 11,201 11,413 11,733 12,558
CY 34.7 35.9 35.9 38.6 38.8 41.2 42.7 37.0 38.2 40.3 45.1 42.9 43.7 43.9 5,035 5,532 5,637 6,281 6,660 7,419 8,049 5,371 5,875 6,330 7,340 7,361 7,854 8,276
LV 34.6 32.5 33.4 33.2 34.7 35.2 37.0 37.3 34.6 35.6 34.8 35.8 35.6 37.2 1,238 1,286 1,414 1,423 1,679 1,993 2,613 1,337 1,368 1,511 1,493 1,728 2,013 2,633
LT 35.9 33.2 32.9 32.0 31.8 33.1 33.4 39.1 36.8 34.8 33.2 33.4 33.6 34.0 1,267 1,294 1,425 1,523 1,679 2,006 2,338 1,381 1,433 1,507 1,584 1,760 2,037 2,379
LU 43.6 44.2 43.6 42.4 41.3 41.7 39.7 37.6 38.1 41.5 41.9 42.5 41.8 39.0 21,855 22,616 23,459 24,130 24,761 26,897 28,421 18,860 19,494 22,330 23,849 25,472 26,967 27,927
HU 43.6 43.2 42.4 41.9 42.4 42.1 42.6 46.5 47.3 51.3 49.1 48.9 49.9 51.9 2,220 2,522 2,948 3,091 3,457 3,714 3,806 2,371 2,760 3,571 3,620 3,981 4,401 4,632
MT 34.8 36.6 37.7 37.9 41.0 42.0 41.6 41.0 43.1 43.2 47.8 45.8 45.1 44.1 3,769 4,007 4,274 4,208 4,576 4,929 5,148 4,437 4,710 4,893 5,301 5,120 5,290 5,462
NL 46.1 45.1 44.2 43.9 44.3 44.9 46.7 44.2 45.4 46.2 47.1 46.1 45.2 46.1 12,113 12,586 12,738 12,920 13,377 14,002 15,257 11,595 12,657 13,313 13,846 13,910 14,090 15,079
AT 49.8 50.7 50.0 49.3 48.9 48.2 47.8 51.4 50.8 50.7 51.1 50.2 49.9 49.3 13,073 13,615 13,662 13,738 14,136 14,372 14,893 13,502 13,643 13,851 14,231 14,513 14,868 15,357
PL 38.1 38.6 39.2 38.4 36.9 39.0 40.1 41.1 43.8 44.2 44.6 42.6 43.3 43.9 1,847 2,145 2,150 1,926 1,975 2,499 2,855 1,994 2,429 2,425 2,240 2,280 2,776 3,126
PT 40.2 40.1 41.4 42.5 43.1 41.7 42.5 43.1 44.4 44.3 45.5 46.5 47.7 46.4 4,803 5,037 5,404 5,647 5,919 5,877 6,225 5,158 5,580 5,782 6,039 6,384 6,737 6,795
RO 43.8 36.7 37.6 32.1 31.2 32.2 33.2 40.6 38.8 39.6 33.6 32.7 33.6 35.0 788 736 835 776 875 1,185 1,492 731 777 880 813 917 1,235 1,576
SI 43.6 44.1 44.6 44.4 44.2 44.5 44.1 47.4 48.2 47.1 47.1 46.5 46.0 45.3 4,634 4,969 5,395 5,635 5,921 6,285 6,682 5,035 5,422 5,696 5,980 6,223 6,491 6,864
SK 38.3 37.8 36.6 37.7 35.6 35.6 33.9 50.5 44.3 44.8 40.5 38.0 38.4 37.7 1,569 1,656 1,772 2,051 2,241 2,519 2,767 2,067 1,940 2,167 2,201 2,390 2,719 3,072
FI 55.2 52.7 52.9 52.4 52.3 53.0 52.5 48.3 47.7 48.8 50.0 50.2 50.5 48.8 14,119 14,212 14,636 14,668 15,237 15,888 16,670 12,349 12,872 13,502 14,010 14,632 15,126 15,490
SE 60.9 58.3 56.6 57.2 57.5 58.7 57.9 57.1 56.7 58.1 58.3 56.9 56.6 55.6 18,026 16,218 16,417 17,205 17,974 18,714 19,511 16,888 15,755 16,838 17,544 17,788 18,040 18,725
UK 41.2 41.5 39.9 39.5 40.0 41.2 41.9 39.8 40.7 41.8 42.9 43.3 44.5 44.6 11,005 11,332 11,279 10,729 11,656 12,336 13,229 10,632 11,121 11,818 11,627 12,637 13,324 14,076
IS 43.6 41.9 41.7 42.8 44.2 47.6 45.9 41.9 42.6 44.3 45.6 44.0 42.3 40.7 14,596 12,982 13,740 14,373 16,113 21,039 19,981 14,028 13,195 14,580 15,311 16,050 18,723 17,707
NO 57.7 57.4 56.3 55.5 56.6 57.4 58.7 42.3 44.1 47.1 48.2 45.4 42.2 40.7 23,447 24,299 25,297 24,198 25,661 30,127 33,665 17,197 18,664 21,156 21,016 20,609 22,142 23,360
Revenue per inhabitant, in euro Expenditure per inhabitant, in euro
Revenue in % of GDP Expenditure in % of GDP
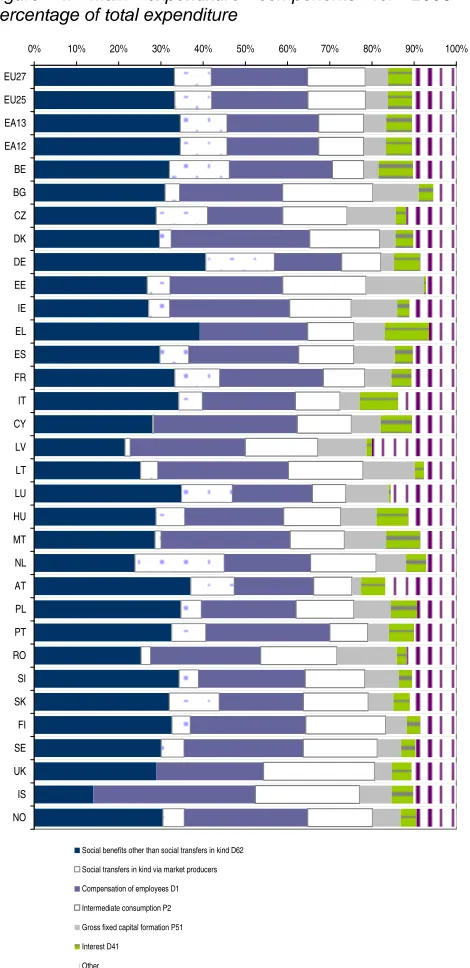
Government expenditure, main components
Social transfers were the main expenditure
component in 2006, accounting for 42% of EU total Figure 4 and table 2 clearly show that the share of social transfers in total government expenditure is very significant in all countries. Typically these transfers cover social risks or needs such as sickness, disability, old age, and unemployment, and can be divided into two categories:
- ‘social benefits other than social transfers in kind’ (ESA 95 category D.62), accounting for one third of total spending and
- ‘social transfers in kind related to expenditure on products supplied to households via market producers’ (D.6311+D.63121+D.63131) with a share of almost 9% in EU27 government expenditure.
The second largest expenditure item was compensation of employees, representing more than one fifth of EU total spending
After social transfers, ‘compensation of employees’ was the second largest expenditure item for the EU27 in 2006. This component represented over a fifth of total government expenditure in the EU for the period covered. ‘Compensation of employees’ (D.1), comprises wages and salaries and employers’ social contributions (actual and imputed). The relative importance of this expenditure component varied across countries. It was highest in Cyprus (34% of total government expenditure) and Denmark (33%) and lowest in Germany (16%), the Czech Republic (18%), Austria (19%) and Luxembourg (19%).
Intermediate consumption was the third most important category of EU government expenditure in 2006
‘Intermediate consumption’ (P.2) refers to the value of goods and services consumed as inputs in the production process, excluding fixed assets. This type of spending accounted for 14% of total government expenditure in the EU 27 and 11% in the EA13 in 2006. The difference between the EU27 and euro area aggregates in this respect is partly explained by the treatment of social transfers in kind in the figures of the UK. In fact, for Greece and Cyprus as well as for the UK, the category ‘social transfers in kind related to expenditure on products supplied to households via market producers’ does not appear because the amounts have been classified under ‘intermediate consumption’. A breakdown of government expenditure by reporting EU Member State is shown in table 2. Government interest and investment spending over 5% each of total EU27 expenditure in 2006
EU27 expenditure on interest in 2006 amounted to just under 6% of total government spending. For the euro area this share was higher at just over 6%. The Member States who spent the largest share of their total expenditure on interest in 2006 were Greece (10%), Italy (9%), Belgium (8%) and Malta (8%), whereas in the
Czech Republic, Romania, the Baltic States and Luxembourg this share lay around or below 2.5%.
Net acquisitions of fixed assets (but gross of consumption of fixed capital) in 2006 amounted to just over 5% of total expenditure in the EU27. The highest value was recorded in Romania, the Baltic States and the Czech Republic (above 11%), the lowest by Austria, Germany, Belgium and Denmark (below 4%).
[image:4.595.309.544.264.748.2]The ‘other’ category of expenditure consists mainly of ‘subsidies’ (D.3), ‘other current transfers’ (D.7), and ‘capital transfers’ (D.9). It should be recalled that the data reported in categories D.4, D.7, and D.9 are consolidated.
Figure 4: Main expenditure components for 2006 as percentage of total expenditure
0% 10% 20% 30% 40% 50% 60% 70% 80% 90% 100% EU27
EU25 EA13 EA12 BE BG CZ DK DE EE IE EL ES FR IT CY LV LT LU HU MT NL AT PL PT RO SI SK FI SE UK IS NO
Social benefits other than social transfers in kind D62 Social transfers in kind via market producers Compensation of employees D1 Intermediate consumption P2 Gross fixed capital formation P51 Interest D41 Other
________________________________________________ 23/2008 — Economy and finance — St a t ist ic s in foc us 5
[image:5.595.46.554.89.523.2]#"
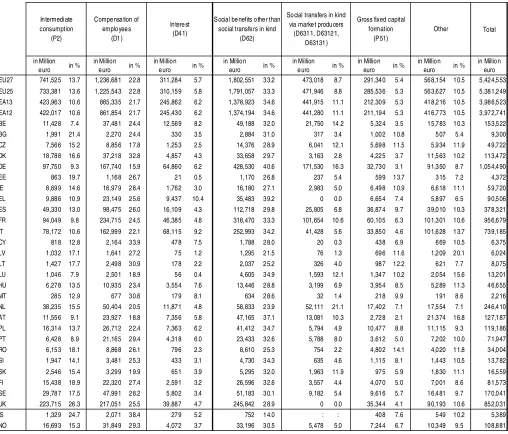
Table 2: Government expenditure by main components and country in 2006, as percentage of total expenditure and in million euro
Total
in Million
euro in %
in Million
euro in %
in Million
euro in %
in Million
euro in %
in Million
e uro in %
in Million
euro in %
in Million
euro in %
in Million euro
EU27 741,525 13.7 1,236,681 22.8 311,284 5.7 1,802,551 3 3.2 473,018 8.7 291,340 5.4 568,1 54 10.5 5,42 4,5 53
EU25 733,381 13.6 1,225,543 22.8 310,159 5.8 1,791,057 3 3.3 471,946 8.8 285,536 5.3 563,6 27 10.5 5,38 1,2 49
EA13 423,963 10.6 865,335 21.7 245,862 6.2 1,378,923 3 4.6 441,915 11.1 212,309 5.3 418,2 16 10.5 3,98 6,5 23
EA12 422,017 10.6 861,854 21.7 245,430 6.2 1,374,194 3 4.6 441,280 11.1 211,194 5.3 416,7 73 10.5 3,97 2,7 41
BE 11,428 7.4 37,481 24.4 12,569 8.2 49,188 3 2.0 21,750 14.2 5,324 3.5 15,7 83 10.3 153,5 22
BG 1,991 21.4 2,270 24.4 330 3.5 2,884 3 1.0 317 3.4 1,002 10.8 5 07 5.4 9,3 00
CZ 7,566 15.2 8,856 17.8 1,253 2.5 14,376 2 8.9 6,041 12.1 5,698 11.5 5,9 34 11.9 4 9,7 22
DK 18,788 16.6 37,218 32.8 4,857 4.3 33,658 2 9.7 3,163 2.8 4,225 3.7 11,5 63 10.2 113,4 72
DE 97,750 9.3 167,740 15.9 64,860 6.2 428,530 4 0.6 171,530 16.3 32,730 3.1 91,3 50 8.7 1,05 4,4 90
EE 863 19.7 1,168 26.7 21 0.5 1,170 2 6.8 237 5.4 599 13.7 3 15 7.2 4,3 72
IE 8,699 14.6 16,979 28.4 1,762 3.0 16,180 2 7.1 2,983 5.0 6,498 10.9 6,6 18 11.1 5 9,7 20
EL 9,886 10.9 23,149 25.6 9,437 10.4 35,483 3 9.2 0 0.0 6,654 7.4 5,8 97 6.5 9 0,5 06
ES 49,330 13.0 98,475 26.0 16,109 4.3 112,718 2 9.8 25,805 6.8 36,874 9.7 39,0 10 10.3 378,3 21
FR 94,049 9.8 234,715 24.5 46,385 4.8 318,470 3 3.3 101,654 10.6 60,105 6.3 101,3 01 10.6 956,6 79
IT 78,172 10.6 162,999 22.1 68,115 9.2 252,993 3 4.2 41,428 5.6 33,850 4.6 101,6 28 13.7 739,1 85
CY 818 12.8 2,164 33.9 478 7.5 1,788 2 8.0 20 0.3 438 6.9 6 69 10.5 6,3 75
LV 1,032 17.1 1,641 27.2 75 1.2 1,295 2 1.5 76 1.3 696 11.6 1,2 09 20.1 6,0 24
LT 1,427 17.7 2,498 30.9 178 2.2 2,037 2 5.2 326 4.0 987 12.2 6 21 7.7 8,0 75
LU 1,046 7.9 2,501 18.9 56 0.4 4,605 3 4.9 1,593 12.1 1,347 10.2 2,0 54 15.6 1 3,2 01
HU 6,278 13.5 10,935 23.4 3,554 7.6 13,446 2 8.8 3,199 6.9 3,954 8.5 5,2 89 11.3 4 6,6 55
MT 285 12.9 677 30.6 179 8.1 634 2 8.6 32 1.4 218 9.9 1 91 8.6 2,2 16
NL 38,235 15.5 50,404 20.5 11,871 4.8 58,833 2 3.9 52,111 21.1 17,402 7.1 17,5 54 7.1 246,4 10
AT 11,556 9.1 23,927 18.8 7,356 5.8 47,165 3 7.1 13,081 10.3 2,728 2.1 21,3 74 16.8 127,1 87
PL 16,314 13.7 26,712 22.4 7,363 6.2 41,412 3 4.7 5,794 4.9 10,477 8.8 11,1 15 9.3 119,1 86
PT 6,428 8.9 21,165 29.4 4,318 6.0 23,433 3 2.6 5,788 8.0 3,612 5.0 7,2 02 10.0 7 1,9 47
RO 6,153 18.1 8,868 26.1 796 2.3 8,610 2 5.3 754 2.2 4,802 14.1 4,0 20 11.8 3 4,0 04
SI 1,947 14.1 3,481 25.3 433 3.1 4,730 3 4.3 635 4.6 1,115 8.1 1,4 43 10.5 1 3,7 82
SK 2,546 15.4 3,299 19.9 651 3.9 5,295 3 2.0 1,963 11.9 975 5.9 1,8 30 11.1 1 6,5 59
FI 15,438 18.9 22,320 27.4 2,591 3.2 26,596 3 2.6 3,557 4.4 4,070 5.0 7,0 01 8.6 8 1,5 73
SE 29,787 17.5 47,991 28.2 5,802 3.4 51,183 3 0.1 9,182 5.4 9,616 5.7 16,4 81 9.7 170,0 41
UK 223,715 26.3 217,051 25.5 39,887 4.7 245,842 2 8.9 0 0.0 35,344 4.1 90,1 93 10.6 852,0 31
IS 1,329 24.7 2,071 38.4 279 5.2 752 1 4.0 : : 408 7.6 5 49 10.2 5,3 89
NO 16,693 15.3 31,849 29.3 4,072 3.7 33,196 3 0.5 5,478 5.0 7,244 6.7 10,3 49 9.5 108,8 81
Other In tere st
(D4 1) Compensa tion of
employees (D1 ) Intermediate
consumption (P2)
Social be nefits othe r than social transfers in kind
(D62)
So cial transfers in kind via marke t produ cers (D631 1, D63121,
D63131 )
Gross fixed capital formation
(P51)
Source: Eurostat, Economy and finance, Government statistics.
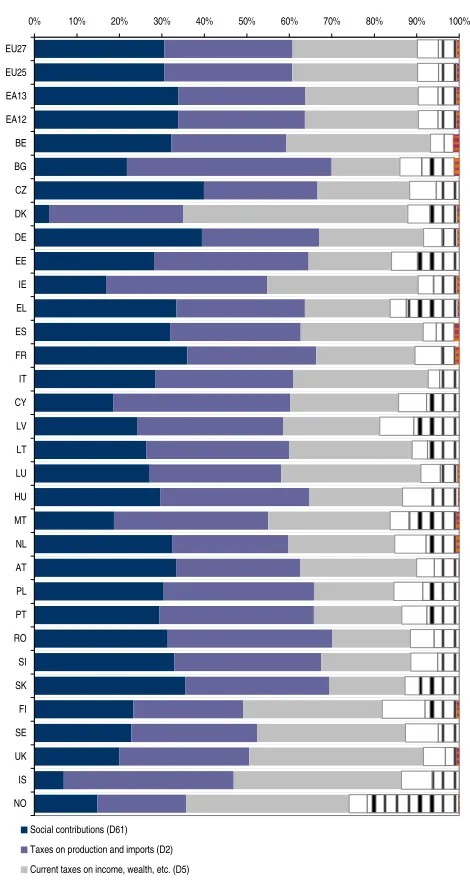
Government revenue, main components
Taxes and social contributions accounted for over 90% of EU general government revenue in 2006 Compulsory levies in the form of taxes and social contributions accounted for over 90% of general government revenue in the EU in 2006. In figure 5, compulsory levies are split into the following ESA 95 categories: ‘taxes on production and imports’ (D.2), ‘current taxes on income, wealth, etc.’ (D.5), ‘capital taxes’ (D.91), and ‘social contributions’ (D.61).
Social contributions represented 31% of EU government revenue in 2006
‘Social contributions’ cover actual and imputed amounts (see ESA 95 paragraphs 4.98 - 4.102 for an explanation of imputed social contributions) paid by employers and employees to social insurance schemes to make provision for social insurance benefits.
Taxes on production and imports accounted for 30% of EU government revenue in 2006
‘Taxes on production and imports’ refer to value-added tax, import and excise duties, taxes on financial and capital transactions, on land and buildings, on payroll, and other taxes on products and production.
The highest share in total revenue was recorded by Bulgaria (48%) and Cyprus (42%), while the Czech Republic and Finland were the Member States who used this source of financing the least (under 27%). Taxes on income, wealth etc., accounted for 29% of EU government revenue in 2006
The category ‘current taxes on income, wealth, etc.’ comprises taxes on income and on holding gains of households and corporations, current taxes on capital, taxes on international transactions, and payments for licences. This source of revenues was used in 2006 to the greatest extent by Denmark (53%) and the United Kingdom (41%) and did not exceed 20% of total government financing in Bulgaria (16%), Slovakia (18%), Romania (19%), Poland (19%) and Estonia (20%).
The term ‘capital taxes’ is used in ESA 95 in the restricted sense of taxes levied at irregular and infrequent intervals on the value of assets or net worth owned, or transferred in the form of legacies or gifts. The share of the revenues from capital taxes in the total revenues exceeded 1% in only three Member States: Belgium (1.4%), Spain (1.2%) and Bulgaria (1.1%), whereas for the whole EU27 it amounted to 0.5%. Estonia does not collect this type of tax revenues.
The remainder of government revenue shown in figure 5 is in the form of:
- government sales, composed of the following ESA 95 categories: ‘market output, output for own final use and payments for other non-market output’ (P.11+P.12+P.131), amounting in 2006 in the EU27 to 5% of total revenue; with the highest shares in Finland (10%), and Latvia (8%) and the lowest in Italy (2.7%) and Spain (3.1%).
[image:6.595.308.543.84.525.2]- ‘other’ revenue, the main components of which are ‘property income’ (D.4), ‘other current transfers’ (D.7), and ‘other capital transfers and investment grants’ (D.92+D.99). The data for D.4, D.7 and D.9 are consolidated. These components amounted in 2006 to over 10% of total revenue in Greece (12%), Malta (11%) and Latvia (11%).
Figure 5: Main revenue components for 2006, as a percentage of total revenue
0% 10% 20% 30% 40% 50% 60% 70% 80% 90% 100%
EU27 EU25 EA13 EA12 BE BG CZ DK DE EE IE EL ES FR IT CY LV LT LU HU MT NL AT PL PT RO SI SK FI SE UK IS NO
Social contributions (D61) Taxes on production and imports (D2) Current taxes on income, wealth, etc. (D5)
Market ouput: output for own final use and payments for other non market output (P11, P12, P131) Other
Capital taxes (D91)
________________________________________________ 23/2008 — Economy and finance — St a t ist ic s in foc us 7
[image:7.595.45.554.85.517.2]#"
Table 3: Government revenue by main components and country in 2006, as percentage of total revenue and in million euro
Total
in Million
euro in %
in Million
euro in %
in Million
euro in %
in Million
euro in %
in Million
euro in %
in Million
euro in %
in Million euro
EU27 258,4 64 4.9 1,580,340 30.2 1,539,688 29.4 1,598,928 30.6 28,341 0.5 22 7,802 4.4 5,233,562
EU25 256,1 59 4.9 1,563,013 30.1 1,532,116 29.5 1,586,627 30.6 28,233 0.5 22 5,106 4.3 5,191,254
EA13 179,6 39 4.7 1,147,363 29.8 1,028,202 26.7 1,307,085 33.9 22,307 0.6 16 9,434 4.4 3,854,029
EA12 178,7 92 4.7 1,142,727 29.8 1,025,365 26.7 1,302,667 33.9 22,302 0.6 16 8,761 4.4 3,840,613
BE 5,0 01 3.2 41,708 27.0 52,363 33.9 49,743 32.3 2,161 1.4 3,264 2.1 154,240
BG 5 16 5.1 4,873 48.2 1,625 16.1 2,203 21.8 108 1.1 789 7.8 10,114
CZ 2,9 20 6.3 12,400 26.7 10,049 21.7 18,517 39.9 33 0.1 2,468 5.3 46,387
DK 6,4 12 5.2 39,071 31.6 65,458 52.9 4,237 3.4 466 0.4 8,082 6.5 123,726
DE 44,3 80 4.4 280,430 27.6 250,040 24.6 401,080 39.4 3,760 0.4 3 7,540 3.7 1,017,230
EE 2 96 6.1 1,761 36.4 946 19.5 1,365 28.2 0 0.0 476 9.8 4,844
IE 2,3 30 3.6 24,607 37.9 23,034 35.5 10,924 16.8 336 0.5 3,614 5.6 64,845
EL 3,2 12 3.8 25,560 30.2 16,976 20.1 28,288 33.4 285 0.3 1 0,268 12.1 84,589
ES 12,1 67 3.1 121,273 30.6 114,417 28.9 127,076 32.1 4,692 1.2 1 6,655 4.2 396,280
FR 56,6 49 6.2 275,861 30.3 211,847 23.3 328,057 36.0 8,346 0.9 2 9,756 3.3 910,516
IT 18,1 60 2.7 218,250 32.4 213,664 31.7 192,038 28.5 222 0.0 3 0,784 4.6 673,118
CY 4 08 6.6 2,588 41.7 1,581 25.5 1,147 18.5 1 0.0 475 7.7 6,199
LV 4 81 8.0 2,054 34.4 1,361 22.8 1,445 24.2 0 0.0 639 10.7 5,980
LT 2 87 3.6 2,663 33.6 2,300 29.0 2,093 26.4 1 0.0 591 7.4 7,935
LU 6 15 4.6 4,158 30.9 4,416 32.9 3,648 27.2 48 0.4 550 4.1 13,435
HU 2,6 47 6.9 13,474 35.2 8,393 21.9 11,341 29.6 81 0.2 2,393 6.2 38,329
MT 93 4.4 759 36.3 600 28.7 390 18.7 15 0.7 232 11.1 2,088
NL 18,4 06 7.4 68,135 27.3 62,447 25.0 80,860 32.4 1,811 0.7 1 7,660 7.1 249,319
AT 5,1 81 4.2 36,022 29.2 33,764 27.4 41,161 33.4 132 0.1 7,079 5.7 123,339
PL 7,4 42 6.8 38,635 35.5 20,353 18.7 33,133 30.4 66 0.1 9,249 8.5 108,879
PT 3,8 68 5.9 23,995 36.4 13,662 20.7 19,360 29.4 4 0.0 5,023 7.6 65,912
RO 1,7 90 5.6 12,454 38.7 5,946 18.5 10,098 31.4 0 0.0 1,906 5.9 32,195
SI 8 47 6.3 4,636 34.6 2,836 21.1 4,418 32.9 6 0.0 673 5.0 13,416
SK 5 04 3.4 5,042 33.8 2,669 17.9 5,302 35.5 0 0.0 1,398 9.4 14,915
FI 8,8 23 10.1 22,728 25.9 28,736 32.7 20,431 23.3 505 0.6 6,568 7.5 87,791
SE 13,6 75 7.7 52,470 29.6 61,873 34.9 40,388 22.8 13 0.0 8,756 4.9 177,175
UK 41,3 55 5.2 244,733 30.6 328,334 41.0 160,185 20.0 5,250 0.7 2 0,913 2.6 800,770
IS 4 39 7.2 2,432 40.0 2,402 39.5 420 6.9 : : 388 6.4 6,081
NO 6,6 58 4.2 32,751 20.9 60,190 38.4 23,322 14.9 256 0.2 3 3,737 21.5 156,914
Market oup ut: output fo r own fi nal use and payments for other non
market output (P11, P12, P 131)
Social contributio ns (D61) Capital taxes
(D91) Oth er
Current taxes on income, wealth, etc. (D5) Taxes o n productio n and
imports (D2)
Government deficit and net saving
EU government net borrowing at 1.6 % of GDP in 2006, the lowest since 2001
As already mentioned, the difference between general government expenditure and revenue results in a surplus or deficit, known in the ESA 95 methodology as 'general government net lending /net borrowing' (ESA 95 category B.9). Net lending/net borrowing is seen as an important measure of government finances that shows the amount of resources remaining for purposes of lending or that need to be borrowed. It is used, for example, as the definition of government deficit/surplus for the reporting of EU Member States under the Excessive Deficit Procedure (EDP), allowing for a different accounting treatment of swaps and forward rate agreements. For the purpose of EDP reporting, net lending/net borrowing includes streams of interest payments resulting from swap and forward rate agreements. For many countries, however, this methodological difference has little or no impact on the data.
[image:8.595.308.549.431.581.2]It can be seen in figure 6 that the net borrowing of the EU27 and euro area decreased in 2006 to 1.6% of GDP, from 3.1% in 2003. Turning to the country data in Table 4, it is clear that the variation is strong. In fact, ten out of the 27 Member States and 6 out of 13 members of euro area reported net lending rather than net borrowing. This is the highest number of countries reporting net lending since 2001.
Figure 6: General government net lending/net borrowing as a percentage of GDP, 2000 to 2006
-3.5 -3.0 -2.5 -2.0 -1.5 -1.0 -0.5 0.0 0.5 1.0
2000 2001 2002 2003 2004 2005 2006
EU27 net borrowing in % of GDP EA13 net borrowing in % of GDP
Source: Eurostat, Economy and finance, Government statistics.
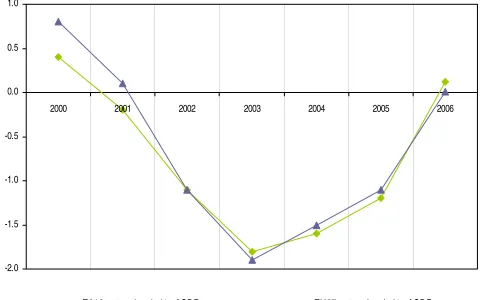
EU government net saving-to-GDP ratio positive for the first time since 2001
Figure 7 shows the concept of 'net saving' (ESA 95 category B.8n). This is defined as the (positive or negative) amount resulting from current transactions which establishes the link with accumulation. In the ESA 95 sequence of accounts, it is the balance of current transactions before taking into account capital transactions (capital transfers and net acquisitions of non-financial assets). When positive, net saving represents that part of disposable income that is not spent on consumption goods and services and must, therefore, be used to acquire non-financial or financial assets of one kind or another, including cash, or to repay liabilities. When negative, net saving measures the amount by which final consumption expenditure exceeds disposable income: the excess must be financed by disposing of assets or incurring new liabilities (SNA93 paragraph 10.30).
[image:8.595.50.289.453.621.2]Table 4 shows, for each reporting country, its net saving and net lending/net borrowing position. Since 2003 negative net saving (or 'dissaving') has tended to decrease and in 2006 it fell to zero percent of GDP, from -1.1% in 2005, in the EU27. For the euro area the improvement seems to have been even more significant (from -1.2% in 2005 to 0.1% in 2006).
Figure 7: General government net saving as a percentage of GDP, 2000 to 2006
-2.0 -1.5 -1.0 -0.5 0.0 0.5 1.0
2000 2001 2002 2003 2004 2005 2006
EA13 net saving, in % of GDP EU27 net saving, in % of GDP
#
"
________________________________________________23/2008
—
Eco
nomy and finance
—
S
ta
ti
s
ti
c
s
i
n
f
o
c
u
s
[image:9.842.63.786.82.453.2]9
Table 4: General government deficit (-) / surplus (+) and net saving, in percentage of GDP and Million of euro
2000 2001 2002 2003 2004 2005 2006 2000 2001 2002 2003 2004 2005 2006 2000 2001 2002 2003 2004 2005 2006 2000 2001 2002 2003 2004 2005 2006 EU27* 69,547 11,565 -108,941 -187,801 -163,573 -122,399 944 24,049 -131,897 -248,764 -313,991 -296,969 -266,630 -190,990 0.8 0.1 -1.1 -1.9 -1.5 -1.1 0.0 0.3 -1.4 -2.5 -3.1 -2.8 -2.4 -1.6 EU25* 67,063 11,220 -110,180 -187,423 -164,808 -124,260 -2,433 22,831 -131,000 -247,776 -313,206 -296,501 -265,970 -189,995 0.7 0.1 -1.1 -1.9 -1.6 -1.1 0.0 0.3 -1.4 -2.5 -3.1 -2.8 -2.4 -1.7 EA13* 29,239 -11,981 -79,416 -137,074 -121,827 -93,638 10,139 79 -129,671 -186,919 -231,554 -221,943 -199,652 -132,494 0.4 -0.2 -1.1 -1.8 -1.6 -1.2 0.1 0.0 -1.8 -2.6 -3.1 -2.9 -2.5 -1.6 EA12* 29,386 -11,745 -79,423 -137,168 -122,011 -93,904 9,753 877 -128,769 -186,317 -230,865 -221,341 -199,240 -132,128 0.4 -0.2 -1.1 -1.8 -1.6 -1.2 0.1 0.0 -1.8 -2.6 -3.1 -2.9 -2.5 -1.6 BE 2,445 1,808 677 -2,915 -985 361 1,393 133 1,318 -100 -87 -214 -153 718 1.0 0.7 0.3 -1.1 -0.3 0.1 0.4 0.1 0.5 0.0 0.0 -0.1 -0.1 0.2 BG 446 347 270 426 977 1,305 1,543 -66 30 -15 1 451 436 814 3.3 2.3 1.6 2.4 4.9 6.0 6.1 -0.5 0.2 -0.1 0.0 2.3 2.0 3.2 CZ -1,572 -1,428 -2,088 -2,722 -482 -947 -1,136 -2,289 -3,964 -5,414 -5,339 -2,595 -3,542 -3,336 -2.6 -2.1 -2.6 -3.4 -0.5 -0.9 -1.0 -3.7 -5.7 -6.8 -6.6 -2.9 -3.5 -2.9 DK 3,373 1,711 -273 -1,014 2,831 8,892 9,720 3,939 2,115 434 -191 3,744 9,639 10,255 1.9 1.0 -0.1 -0.5 1.4 4.3 4.4 2.3 1.2 0.2 -0.1 1.9 4.6 4.7 DE -1,750 -32,590 -53,140 -63,080 -64,610 -57,260 -20,820 27,090 -59,610 -78,340 -87,280 -83,560 -75,570 -37,260 -0.1 -1.5 -2.5 -2.9 -2.9 -2.6 -0.9 1.3 -2.8 -3.7 -4.0 -3.8 -3.4 -1.6 EE 119 185 318 390 316 446 775 -14 -4 29 159 171 215 472 1.9 2.7 4.1 4.5 3.3 4.0 5.9 -0.2 -0.1 0.4 1.8 1.8 1.9 3.6 IE 7,474 5,104 3,550 4,130 5,548 5,652 9,872 4,960 1,151 -490 577 2,030 1,948 5,126 7.1 4.4 2.7 3.0 3.7 3.5 5.7 4.7 1.0 -0.4 0.4 1.4 1.2 2.9 EL -333 -252 -1,063 -2,014 -4,069 -2,287 : -5,151 -6,502 -7,573 -9,726 -13,346 -10,403 -5,917 -0.2 -0.2 -0.7 -1.2 -2.2 -1.2 : -3.7 -4.4 -4.8 -5.7 -7.2 -5.2 -2.8 ES 9,103 13,471 16,993 18,338 20,374 31,477 45,568 -6,283 -4,492 -3,476 -1,793 -2,985 8,752 17,959 1.4 2.0 2.3 2.3 2.4 3.5 4.6 -1.0 -0.7 -0.5 -0.2 -0.4 1.0 1.8 FR -2,976 -4,535 -32,696 -50,296 -43,035 -37,924 -24,944 -21,240 -23,285 -49,010 -65,684 -60,215 -51,262 -46,163 -0.2 -0.3 -2.1 -3.2 -2.6 -2.2 -1.4 -1.5 -1.6 -3.2 -4.1 -3.6 -3.0 -2.6 IT -3,642 -10,342 -18,993 -34,294 -31,024 -35,005 -7,974 -10,288 -38,733 -39,009 -47,319 -49,255 -61,910 -66,067 -0.3 -0.8 -1.5 -2.6 -2.2 -2.5 -0.5 -0.9 -3.1 -3.0 -3.5 -3.5 -4.4 -4.5 CY 60 61 -161 -374 -160 -61 268 -233 -241 -492 -765 -519 -330 -175 0.6 0.6 -1.4 -3.2 -1.3 -0.5 1.8 -2.3 -2.2 -4.4 -6.5 -4.1 -2.4 -1.2 LV -392 -303 -329 -277 -76 92 453 -235 -194 -225 -162 -114 -46 -44 -4.6 -3.2 -3.3 -2.8 -0.7 0.7 2.8 -2.8 -2.1 -2.3 -1.6 -1.0 -0.4 -0.3 LT -60 -146 33 72 119 241 377 -398 -483 -282 -211 -279 -105 -140 -0.5 -1.1 0.2 0.4 0.7 1.2 1.6 -3.2 -3.6 -1.9 -1.3 -1.5 -0.5 -0.6 LU 1,988 1,818 1,518 1,136 745 1,189 1,542 1,313 1,379 504 127 -326 -33 234 9.0 8.1 6.3 4.4 2.7 4.0 4.6 6.0 6.1 2.1 0.5 -1.2 -0.1 0.7 HU -784 -1,064 -2,786 -4,034 -4,338 -5,546 -6,395 -1,537 -2,429 -6,326 -5,357 -5,296 -6,926 -8,326 -1.5 -1.8 -3.9 -5.4 -5.3 -6.2 -7.1 -3.0 -4.1 -8.9 -7.2 -6.4 -7.8 -9.3 MT -199 -199 -164 -203 -198 -191 -169 -261 -277 -245 -436 -219 -146 -128 -4.7 -4.6 -3.7 -4.6 -4.4 -4.0 -3.4 -6.2 -6.4 -5.5 -9.8 -4.9 -3.1 -2.5 NL 8,696 4,723 -3,150 -8,891 -5,611 1,439 5,128 8,244 -1,141 -9,278 -15,014 -8,679 -1,440 2,909 2.1 1.1 -0.7 -1.9 -1.1 0.3 1.0 2.0 -0.3 -2.0 -3.1 -1.8 -0.3 0.5 AT 233 4,407 2,943 766 2,444 1,238 1,528 -3,436 -219 -1,528 -4,003 -3,081 -4,090 -3,848 0.1 2.0 1.3 0.3 1.0 0.5 0.6 -1.6 -0.1 -0.7 -1.8 -1.3 -1.7 -1.5 PL -4,062 -6,475 -6,067 -7,232 -7,536 -5,762 -3,608 -5,624 -10,880 -10,496 -12,008 -11,640 -10,568 -10,308 -2.2 -3.0 -2.9 -3.8 -3.7 -2.4 -1.3 -3.0 -5.1 -5.0 -6.3 -5.7 -4.3 -3.8 PT -1,407 -2,956 -2,715 -4,257 -5,951 -7,347 -5,367 -3,627 -5,587 -3,913 -4,092 -4,876 -9,073 -6,035 -1.2 -2.3 -2.0 -3.1 -4.1 -4.9 -3.5 -3.0 -4.3 -2.9 -3.0 -3.4 -6.1 -3.9 RO 2,038 -2 969 -804 257 556 1,834 1,284 -927 -973 -786 -919 -1,096 -1,809 5.1 0.0 2.0 -1.5 0.4 0.7 1.9 3.2 -2.1 -2.0 -1.5 -1.5 -1.4 -1.9 SI -146 -236 7 94 184 265 387 -798 -903 -602 -689 -602 -412 -366 -0.7 -1.1 0.0 0.4 0.7 0.9 1.3 -3.8 -4.0 -2.5 -2.7 -2.3 -1.5 -1.2 SK -894 -1,209 -1,436 -980 -1,048 -727 -1,533 -2,693 -1,526 -2,123 -805 -803 -1,079 -1,644 -4.0 -5.1 -5.5 -3.4 -3.1 -1.9 -3.5 -12.2 -6.5 -8.2 -2.8 -2.4 -2.8 -3.7 FI 9,554 7,599 6,653 4,209 4,162 4,565 6,360 9,162 6,953 5,896 3,429 3,166 3,994 6,218 7.2 5.4 4.6 2.9 2.7 2.9 3.8 6.9 5.0 4.1 2.3 2.1 2.5 3.7 SE 11,349 5,581 -1,583 -1,051 3,465 8,513 10,265 10,101 4,116 -3,758 -3,029 1,676 6,084 7,134 4.3 2.3 -0.6 -0.4 1.2 3.0 3.4 3.8 1.7 -1.5 -1.1 0.6 2.1 2.3 UK 30,885 26,486 -16,229 -32,924 -35,874 -35,570 -21,589 21,996 12,437 -31,959 -53,509 -58,686 -59,515 -51,261 2.0 1.6 -1.0 -2.0 -2.1 -2.0 -1.1 1.4 0.8 -1.9 -3.3 -3.4 -3.3 -2.7 IS 435 253 23 -19 320 951 949 160 -61 -242 -272 19 685 692 4.6 2.9 0.2 -0.2 3.0 7.3 7.2 1.7 -0.7 -2.6 -2.8 0.2 5.2 5.2 NO 30,540 27,076 20,732 16,808 25,225 38,936 50,578 28,069 25,430 18,796 14,523 23,195 36,908 48,033 16.7 14.2 10.2 8.4 12.1 16.1 18.9 15.4 13.3 9.2 7.3 11.1 15.2 18.0 Net saving, million of euro Net borrowing (-) or Net lending (+), million of euro Net saving in % of GDP Net borrowing (-) or Net lending (+) in % of GDP
Source: Eurostat, Economy and finance, Government statistics.
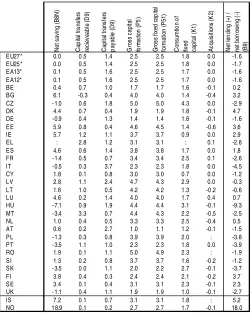
Link between saving and net lending/net
borrowing
Net lending/net borrowing (B.9) reflects the changes to net worth (the total value of the assets owned minus the total value of its liabilities) due to saving, capital transfers and acquisition less disposal of non-financial assets net of consumption of fixed capital. It is described by the following equation:
Net lending/ net borrowing (B.9) =
+ Net saving (B.8n)
+ Capital transfers (D.9), receivable – Capital transfers (D.9), payable – Gross capital formation (P.5) + Consumption of fixed capital (K.1)
– Acquisition less disposals of non-financial non-produced assets (K.2)
[image:10.595.43.293.352.666.2]This relationship is illustrated in Table 5 for the EU members plus Iceland and Norway.
Table 5: Transition from general government net saving to net lending/net borrowing in % of GDP in 2006
N et sa vi ng ( B 8N ) C ap ita l t ra nsf er s rec iev eabl e ( D 9) C apit al t rans fe rs p ay abl e ( D 9) G ros s c apit al for m at io n ( P 5) G ro ss fi xe d ca p ita l for m at ion (P51) C ons um tio n o f fix ed capi tal ( K 1) Ac qui si tions (K 2) N et len di ng (+ ) / net bor row ing (-) (B9)
EU27* 0.0 0.5 1.4 2.5 2.5 1.8 0.0 -1.6 EU25* 0.0 0.5 1.4 2.5 2.5 1.8 0.0 -1.7 EA13* 0.1 0.5 1.6 2.5 2.5 1.7 0.0 -1.6 EA12* 0.1 0.5 1.6 2.5 2.5 1.7 0.0 -1.6 BE 0.4 0.7 1.0 1.7 1.7 1.6 -0.1 0.2 BG 6.1 -0.3 0.4 4.0 4.0 1.4 -0.4 3.2 CZ - 1.0 0.6 1.8 5.0 5.0 4.3 0.0 -2.9 DK 4.4 0.7 0.4 1.9 1.9 1.8 -0.1 4.7 DE - 0.9 0.4 1.3 1.4 1.4 1.6 -0.1 -1.6 EE 5.9 0.8 0.4 4.6 4.5 1.4 -0.6 3.6 IE 5.7 1.2 1.1 3.7 3.7 0.9 0.0 2.9
EL : 2.8 1.2 3.1 3.1 : 0.1 -2.8
ES 4.6 0.6 1.4 3.8 3.8 1.7 0.0 1.8 FR - 1.4 0.5 0.7 3.4 3.4 2.5 0.1 -2.6 IT - 0.5 0.3 3.7 2.3 2.3 1.8 0.0 -4.5 CY 1.8 0.1 0.8 3.0 3.0 0.7 0.0 -1.2 LV 2.8 1.1 2.4 4.7 4.3 2.9 0.0 -0.3 LT 1.6 1.0 0.5 4.2 4.2 1.3 -0.2 -0.6 LU 4.6 0.2 1.4 4.0 4.0 1.7 0.4 0.7 HU - 7.1 0.9 1.9 4.4 4.4 3.1 -0.1 -9.3 MT - 3.4 3.3 0.7 4.4 4.3 2.2 -0.5 -2.5 NL 1.0 0.4 0.5 3.3 3.3 2.5 -0.4 0.5 AT 0.6 0.2 2.7 1.0 1.1 1.2 -0.1 -1.5 PL - 1.3 0.3 0.8 3.9 3.9 2.0 : -3.8 PT - 3.5 1.1 1.0 2.3 2.3 1.8 0.0 -3.9 RO 1.9 0.1 1.1 5.0 4.9 2.3 : -1.9 SI 1.3 0.2 0.8 3.7 3.7 1.6 -0.2 -1.2 SK - 3.5 0.0 1.1 2.0 2.2 2.7 -0.1 -3.7 FI 3.8 0.4 0.3 2.4 2.4 2.1 -0.2 3.7 SE 3.4 0.1 0.4 3.1 3.1 2.3 -0.1 2.3 UK - 1.1 0.4 1.1 1.9 1.9 1.0 -0.1 -2.7
IS 7.2 0.1 0.7 3.1 3.1 1.8 : 5.2
NO 18.9 0.1 0.2 2.7 2.7 1.7 -0.1 18.0
Source: Eurostat, Economy and finance, Government statistics. * EU/EA aggregates for K2 exclude PL and RO. Estimated values of EL B8N and K1 used for needs of calculation of EA/EU aggregates.
In 2006, in most Member States capital transfers paid by general government to other sectors of the economy (households, corporations) exceeded those received and have reduced net lending or increased net borrowing. Only in Denmark, Estonia, Ireland, Greece, Lithuania, Malta, Portugal and Finland were net capital transfers (receivables less payables) positive.
________________________________________________ 23/2008 — Economy and finance — St a t ist ic s in foc us 1 1
#"
E S S E N T I A L I N F O R M A T I O N – M E T H O D O L O G I C A L N O T E S
This box gives some background explanation on general government expenditure and revenue. More exhaustive information and data can be found on Eurostat’s homepage in the section dedicated to Government finance statistics.
GOVERNMENT REVENUE AND EXPENDITURE, DATA TRANSMISSION
Government revenue and expenditure are concepts used to analyse fiscal policy. They appear often in international comparisons. The initial ESA 95 manual did not define government revenue or expenditure. However, a Commission Regulation3 extended the ESA 95 in relation to these concepts, ensuring that a common definition is used in the EU. In the Regulation, revenue and expenditure are defined with reference to ESA 95 categories and thus follow the principles laid down in the ESA 95 for the delimitation of general government, as well as the principles for the valuation and time of recording of transactions.
MAASTRICHT DEBT AND DEFICIT
The application of the Protocol on the excessive deficit procedure are made operational by
Council Regulation (EC) No 3605/93, as amended by Council Regulation (EC) No 475/2000
and by Commission Regulation (EC) No 351/2002. The protocol on the Excessive Deficit Procedure, annexed to the treaty, defines two criteria and reference values for compliance. These are a government deficit to Gross Domestic Product (GDP) ratio of 3 per cent, and a government debt to GDP ratio of 60 per cent.
GOVERNMENT REVENUE, EXPENDITURE AND ITS LINK TO DEFICIT/SURPLUS
Government revenue and expenditure are concepts used to analyse fiscal policy. Total revenue and total expenditure are defined in ways such that the ESA 95 government deficit (ESA 95 B.9, net lending (+)/net borrowing (-)) is equal to the difference between them. Note that a deficit is shown as a negative number, and a surplus as a positive number.
E S A 9 5
Fiscal data are compiled in accordance with national accounts rules, as laid down in the European System of Accounts (ESA 1995) adopted in the form of a Council and Parliament Regulation (EC) of 25 June 1996, No 2223/96. The full text of ESA95 is available on the Eurostat internet site. The compilation of General government revenue and expenditure data complies with ESA95 rules, especially concerning the sector classification of institutional units, the consolidation rules, the classification of financial transactions and of financial assets and liabilities, and the time of recording but not valuation rules.
G E N E R A L G O V E R N M E N T
According to ESA95, paragraph 2.68 "the sector general government (S.13) includes all institutional units which are other non-market producers [institutional units whose sales do not cover more than the 50% of the production costs, see ESA95 paragraph 3.26] whose output is intended for individual and collective consumption, and mainly financed by compulsory payments made by units belonging to other sectors and/or all institutional units principally engaged in the redistribution of national income and wealth".
General government is divided into four sub-sectors: central government (S.1311), local government (S.1313), social security funds (S.1314), and when applicable state government (S.1312).
Definitions
P.2, Intermediate consumption: the purchase of goods and services by government; D.1, Compensation of employees: the wages of government employees plus non-wage costs such as social contributions;
D.41, Interest: (consolidated, so excludes payments within the general government sector), excludes settlements under swaps and FRAs, as these are treated as financial transactions in the ESA 95;
D.62, Social payments: cover social benefits and pensions paid in money
D.6311, D.63121, D.63131, Social transfers in kind cover expenditure on products supplied to households via market producers;
P.51, Gross fixed capital formation consists of acquisitions, less disposals, of fixed assets during a given period plus certain additions to the value of non-produced assets realized by the productive activity of producer or institutional units. Fixed assets are tangible or intangible assets produced as outputs from processes of production that are themselves used repeatedly, or continuously, in processes of production for more than one year; P.11, P.12, P.131, Market output, output for own final use and payments for other non-market output. It includes non-market output (P.11), output for own final use (P.12) and payments for the other non-market output (P. 131);
D.2, Taxes on production and imports consist of compulsory, unrequited payments, in cash or in kind which are levied by general government, or by the institutions of the European Union, in respect of the production and importation of goods and services, the employment
3
Commission Regulation (EC) No 1500/2000.
of labour, the ownership or use of land, buildings or other assets used in production. These taxes are payable whether or not profits are made;
D.5, Current taxes on income, wealth, etc., cover all compulsory, unrequited payments, in cash or in kind, levied periodically by general government and by the rest of the world on the income and wealth of institutional units, and some periodic taxes which are assessed neither on the income nor the wealth;
D.61, Actual social contributions includes ‘employers' actual social contributions’ (D.611), ‘employees' social contributions’ (D.6112) and ‘social contributions by self-employed and non-employed persons’ (D.6113);
D.91, Capital taxes consist of taxes levied at irregular and very infrequent intervals on the values of the assets or net worth owned by institutional units or on the values of assets transferred between institutional units as a result of legacies, gifts inter vivos or other
transfers;
D.9, Capital transfers are different from current transfers by the fact that they involve the acquisition or disposal of an asset, or assets, by at least one of the parties to the transaction. Whether made in cash or in kind, they should result in a commensurate change in the financial, or non-financial, assets shown in the balance sheets of one or both parties to the transaction;
P.5, Gross capital formation consists of: (a) gross fixed capital formation (P.51); (b) changes in inventories (P.52); (c) acquisitions less disposals of valuables (P.53); K.1, Consumption of fixed capital represents the amount of fixed assets used up, during the period under consideration, as a result of normal wear and tear and foreseeable obsolescence, including a provision for losses of fixed assets as a result of accidental damage which can be insured against.;
K.2 Acquisitions less disposals of financial produced assets: Non-financial non-produced assets consist of land and other tangible non-non-produced assets that may be used in the production of goods and services, and intangible non-produced assets.
C O N S O L I D A T I O N
Revenue and expenditure figures on general government statistics and each of its sub-sectors are reported consolidated (plus a separate reporting for non-consolidated general government). Consolidation is a method of presenting statistics for a grouping of units, such as institutional sectors or sub-sectors, as if it constituted a single unit. Consolidation thus involves a special kind of cancelling out of flows and stocks: eliminating those transactions or debtor/creditor relationships that occur between two transactors belonging to the same grouping. ESA 95 recommends compiling both consolidated and non-consolidated financial accounts. For macro-financial analysis, the focus is on consolidated figures.
A B B R E V I A T I O N S
Euro area 13: BE (Belgium), DE (Germany), IE (Ireland), EL (Greece), ES (Spain), FR (France), IT (Italy), LU (Luxembourg), NL (the Netherlands), AT (Austria), PT (Portugal), SI (Slovenia) and FI (Finland).
EU or EU-27 (European Union of 27 Member States): Euro area countries plus BG (Bulgaria), CZ (Czech Republic), DK (Denmark), EE (Estonia), CY (Cyprus), LV (Latvia), LT (Lithuania), HU (Hungary), MT (Malta), PL (Poland), RO (Romania), SK (Slovakia), SE (Sweden), and UK (United Kingdom).
P R E V I O U S R E L E A S E S
• Statistics in focus 19/2006, Economy and finance, General government expenditure and revenue in the EU: 2005 data, KS-NJ-06-019-EN-N;
• Statistics in focus 24/2005, Economy and finance, General government expenditure and revenue in the EU in 2004, KS-NJ-05-024-EN-N;
• Statistics in focus 41/2004, Economy and finance, General government expenditure and revenue in the EU in 2003, KS-NJ-04-041-EN-N.
M O R E D A T A
Further information:
Data: EUROSTAT Website/Home page/Economy and finance//Data
Economy and finance
Government statistics
Journalists can contact the media support service: Bech Building Office A4/125
L - 2920 Luxembourg Tel. (352) 4301 33408 Fax (352) 4301 35349
E-mail: eurostat-mediasupport@ec.europa.eu
European Statistical Data Support:
Eurostat set up with the members of the ‘European statistical system’ a network of support centres, which will exist in nearly all Member States as well as in some EFTA countries.
Their mission is to provide help and guidance to Internet users of European statistical data.
Contact details for this support network can be found on our Internet site: http://ec.europa.eu/eurostat/
A list of worldwide sales outlets is available at the:
Office for Official Publications of the European Communities.
2, rue Mercier L - 2985 Luxembourg
URL: http://publications.europa.eu
E-mail: info-info-opoce@ec.europa.eu